1
AN OPTIMIZATION MODEL FOR BLOCKS ALLOCATION TO SERVICE VESSELS IN A PORT CONTAINER TERMINAL
FATEMEH NASROLLAHPOURNIAZI
i
AN OPTIMIZATION MODEL FOR BLOCKS ALLOCATION TO SERVICE VESSELS IN A PORT CONTAINER TERMINAL
FATEMEH NASROLLAHPOURNIAZI
A project report submitted in partial fulfilment of the requirements for the award of the degree of
Master of Engineering (Industrial Engineering)
Faculty of Mechanical Engineering
Universiti Teknologi Malaysia
iii
I would like to dedicate this dissertation to my beloved father and mother, Jahanbakhsh Nasrollahpourniazi and Mahin Rahgozar who taught me with their
love, how to be strong on hard days with hopeness to better life. I also dedicate it to my dear teacher, Seyed Hassan Saviz who learnt me how kind is our Allah.
iv
ACKNOWLEDGMENTS
Firstly, I like to thank my supervisor, Associate Professor Dr. Wong Kuan Yew, for his valuable advice, guidance and insights, without which the completion of this research would be impossible.
Moreover, I would like to thank the authority of Universiti Teknologi
Malaysia (UTM) for providing me a good environment and facilities. In addition, not forget to my parents for giving me to further study at Master level and always
praying for me to get Master title.
v
ABSTRACT
This study developed a new mathematical model on allocation of cargo of a
service in a port’s container terminal. The objective of the project was minimizing
the oveall distances between vessels in berth and blocks in yard side. Each service
had some data. The service in operation concepts in the port had three groups of
participants: 1) Discharging vessels, 2) Cargo by the number of containers, 3)
Loading vessels. The containers were discharged from vessels to yard blocks by
trucks then loaded to next vessel. Each truck could transfer one container at a
time.The purpose of this project was finding the best blocks between all available
blocks in port to minimize the overall distances which the trucks had to pass for
discharging or loading. Solving this problem had other important benefits for
reducing the port costs, like minimizing the fuel usage by trucks, minimizing the
staying time of the vessels at the port, and consequently improving the quality of the port service, which in today’s competitive market would retain and absorb customers.
There were only two input data for the problem: 1) the availability of the yard blocks,
and 2) the number of containers in each service (either discharging or loading) and
the location of the vessel in which berth. The method used in this project was Mixed
Integer Linear Programming to mathematical modelling and solving by GAMS
software. The distance between berth to blocks was divided into three distances. The
Momentum formulation was used to find a point in the berth, which considered the
number of containers as the forces and the berth as the location. The point was
transferred to the yard then all blocks were prioritize by the nearest distance to this
main point in the yard side. Then the needed blocks should be chosen from all the
nearest blocks. The research was done based on the data from the 17th busiest port in
vi
ABSTRAK
Kajian ini bertujuan mengembangkan satu model Matematik baru dalam
penetapan servis kargo dalam terminal kontena pelebuhan. Objektif projek ini adalah
antuk mengurangkan jarak yang perlu dilalui antara kapal di dermaga ke blok-blok
penyimpanan.setiap servis mempunyaibeberapa data. Servis dalam konsep operasi di
pelabuhan mempunyau 3 kumpulan: 1) Pemindahan dari kapal, 2) Kargo mengikut
bilangan kontena and 3) Pemindahan ke kapal. Kontena dipindahkan dari kapal ke
blok-blok simpanan menggunakan trak dan kemudian dipindahkan ke kapal lain.
Setiap trak boleh memindahkan satu kontena pada satu masa. Tujuan projek ini
adalah untuk menentukan blok paling tepat daripada blok-blok kosong untuk
meminimakan jarak perjalanan yang perlu dilalui oleh trak dalam memindahkan
kontena. Penyelesaian masalah ini dapat memberi manfaat dalam mengurangkan kos
pelabuhan, seperti meminimakan penggunaan bahan bakar trak, meminimakan
jangkamasa kapal berlabuh, dan seterusuya meningkatkan kualiti servis pelabuhan.
Dalam persaingan pada hari ini, kualiti akan meningkatkan dan mengekalkan
pelanggan. Terdapat 2 input data untuk masalah ini: 1) Kekosongan blok-blok
simpanan, 2) Bilangan kontena di steiap servis (pindah turun dan naik) dan lokasi kapal di ruang dermaga Metodologi yang digunakan dalam projek ini adalah “Mixed Integer Linear Programming” antuk model Matematik dan penyelesaian
menggunakan perisian GAMS. Jarak antara dermaga ke blok dibahagikan kepada 3 jarak. Formulasi “Momentum” digunakan untuk mendapatkan satu titik di dermaga,
mengambil kira bilangan kontena sebagai daya dan dermaga sebagai lokasi. Titik ini
dipindahkan ke blok simpanan dan blok-blok diberi keutamaan berdasarkan jarak
terdekat ke titik ini. Kemudian blok yang diperlukan akan dipilih dari blok-blok yang
paling hamper. Kajian ini dijalankan berdasarkan data daripada pelabuhan ke-17
vii
TABLE OF CONTENTS
CHAPTER TITLE PAGE
DECLARATION ii
DEDICATION iii
ACKNOWLEDGMENTS iv
ABSTRACT v
ABSTRAK vi
TABLE OF CONTENTS vii
LIST OF TABLES x
LIST OF FIGURES xi
LIST OF ABBREVIATIONS xii
LIST OF APPENDICES xiii
1 INTRODUCTION 1
1.1 Introduction 1
1.2 Problem Statement 5
1.3 Objectives of the Study 5
1.4 Research Questions 6
1.5 Significance of the Study 6
2 LITERATURE REVIEW 7
2.1 Introduction 7
2.2 Container Terminal Operations 8
2.3 Optimization 9
2.3.1 Optimisation on the Yard 10
2.4 The Ship Planning Process 11
2.4.1 Berth Allocation 11
viii
3 RESEARCH METHODOLOGY 14
3.1 Introduction 14
3.2 Problem Description 14
3.3 Research Design 18
3.3.1 Assumptions 20
3.4 Research Procedure 21
3.4.1 Sampling Design 21
3.4.2 Procedure 21
3.4.3 Minimization the Distance D 23
3.4.3.1 Berth Side Minimization 24
3.4.3.2 Minimization of the Distance in Yard
Side 26
3.4.4 Finding the Solution 28
3.5 Research Equipment 28
4 MODEL FORMULATION 29
4.1 Introduction 29
4.2 Model Explanation and Assumptions 29
4.3 Model Formulation (Mathematical Model) 31
4.3.1 Definition 31
4.3.2 Developed Mathematical Model 32
4.3.3 Model Explanation 33
4.3.3.1 Binary Decision Variable 33
4.3.3.2 Objective Function 33
4.3.3.3 Constraints 33
5 CASE STUDY, DATA GATHERING, RESULTS AND
ANALYSIS 36
5.1 Introduction 36
5.2 Case study Overview 36
5.3 Input Data for Proposed Model 37
5.3.1 The Constant Parameters in PTP 39
5.3.1.1 Capacity and the Number of Services
ix
5.3.2 The Data Used as the Variables of the Service
which was the Problem of this Project 40
5.4 Solving the Model based on the Data from the Case by
GAMS 40
5.5 Results and Analysis 42
5.5.1 Sensitivity Analysis 44
6 CONCLUSION AND FUTURE WORK 46
6.1 Introduction 46
6.2 Limitations of the Project 46
6.3 Future Study 47
6.4 Conclusion 47
REFERENCES 49
x
LIST OF TABLES
TABLE NO. TITLE PAGE
5.1 The data of service which should be solved in this project 39
5.2 The chosen blocks between available blocks 43
xi
LIST OF FIGURES
FIGURE NO. TITLE PAGE
1.1 High view of PTP 2
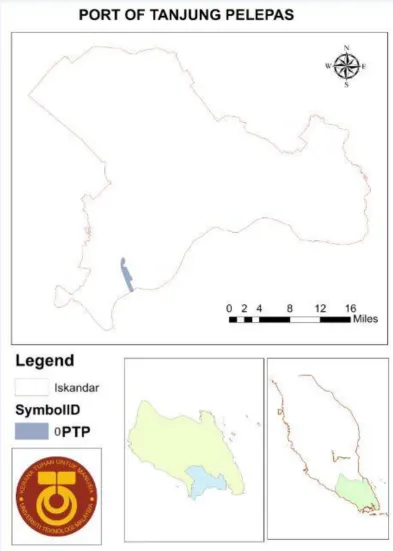
1.2 The map of PTP 3
3.1 Ship scheduling 16
3.2 An example for a specific service by vessels 17
3.3 Research design 19
3.4 The blocks and berths in the PTP 20
3.5 An example for discharging vessels in berth position 22
3.6 An example for loading vessel and its position in berth 22
3.7 The signs of two types of vessels 23
3.8 An example for the percentage of discharging vessels 25
3.9 Dividing the distance between the two discharging vessels 25
3.10 The optimum point between discharging vessel is marked 25
3.11 n berths 25
3.12 The location of berth and yard blocks in port 26
3.13 The location of (XL,YL) point by red color 27
3.14 The horizontal distance between red point and selected block 27
5.1 The position of the vessels when discharging and then loading 38
5.2 The Av(y,x) availability of each block (Av(y,x) = 1 39
5.3 The P(y,x) for eaxh block in yard side 42
xii
LIST OF ABBREVIATIONS
PTP - Port of Tanjung Pelepas
xiii
LIST OF APPENDICE
APPENDIX TITLE PAGE
1
CHAPTER 1
INTRODUCTION
1.1 Introduction
Transportation has been done by airplanes, vessels, trains, and trucks.
Transporting goods by vessels is an important issue as it effects the international
trade in terms of cost, time, and accessibility. Global trade is also affected by ports,
which are the service sectors for loading and discharging containers. Berthing
duration of a vessel depends on the number of containers to be loaded and discharged
from the vessel, the planning of the transferring form vessel to yard, and from yard to
vessel. When vessels have appropriate plans for this process, the stay time at ports
would be minimized so ports serve more services. In this case, the quality of services
also improves.
In this process an important issue of consideration is knowing how many
containers a terminal can handle. In this regard, Berth is come to know as a critical
issue, mainly because it is more expensive to build compared to any other facilities at docking sites.
One important issue is transferring containers between yard side and berth side. This process should be done by minimum use of energy, such as time and fuel.
Therefore, ports scheduling is a complex problem. Mathematical modeling has been
2 For the purpose of this research the port of Tanjung Pelepas (PTP) was observed. Then industrial engineering techniques for making critical decisions were used to help the manager of this service sector for the development of the port. PTP
is located in the south of Malaysia. This terminal is ranked as the 17th busiest ports in
the world.
This chapter presents the background of the study, problem statement, objectives of the study and its scope.
CASE STUDY: PORT OF TANJUNG PELEPAS
The Port of Tanjung Pelepas (PTP) in Malaysia was established for container vessels in the south-west part of the state of Johor on the eastern side of a river called
Pulai as it is shown in Figure 1.2 which is the map picture of PTP and its location in the Malaysia’s map.
The very first vessel came to this port on October 10th, 1999 to establish a
three-month trial operation. This port has been known as the fastest growing port
with 1 million twenty-foot equivalent units (TEU, a unit for cargo capacity). After a satisfactory trail operation, this port was launched by Tun Dr. Mahathir Mohamad on 13 March 2000, who was the Prime Minister of Malaysia at that time. Figure 1.1 is the high view of PTP and shows the berth sides with quay cranes and the blocks in
the yard side.
Figure 1.1 High view of PTP
3
4
PTP has been a fast developing port and as a result has turned into an
alternative choice to Singapore's terminal. Its sustained growth after 2000 was also
largely possible as Maersk Sea land, the world's largest container ship operator, took
a 30% equity stake in the port's holding company, Seaport Terminal in a deal
concluded on 17 August 2000, effectively shifting all of Maersk's operations to the
new port from the Singaporean port by the end of that year. Maersk was once the
largest operator in Singapore, and the shift represented a 10% drop in business there.
In 2002, Evergreen Marine Corporation, the world's second largest shipping
company after Maersk, also shifted its operations to PTP from Singapore. This event
raised alarm bells in the Singaporean port with widespread speculation in the
shipping community that Evergreen's endorsement of PTP demonstrated that
Maersk's move may not be an isolated one. Other lines have since also started direct
services at PTP.
Besides being connected directly to the main Malaysian expressways, the port
is also linked to rail access which extends into Southern Thailand with a 4 track rail
terminal. A 14 lanes gate terminal and 6 lanes FTZ (Free Trade Zone) ensure a
smooth turnaround time for import and export containers. The port development area
consists of 2,000 acres for the port terminal and 1,500 acres for the free trade zone.
Loading and discharging is done by 14 berths and 44 cranes. The berth is divided into two main parts: (1) Sea side, and (2) land side (Yard).
Due to the limitation of space at the sea side of the port, some vessels cannot
get service and are lost. This is because some other vessels are waiting to be served
and there is no more area for these vessels to stay and wait for service. These vessels are considered lost vessels and may do loading and discharging at other near ports,
5 1.2 Problem Statement
International sea transportation has grown dramatically over the past decade
and container terminals has become key factors in global shipping network. Initial
methods of port scheduling entails costly time and motion studies. Therefore, it is
important to optimally use available facilities at ports to cut huge costs of service
developments.
For the purpose of this research a real problem was identified at port of
Tanjung Pelepas in the southern part of Malaysia. The investment in yard planning
department in Tanjung Pelepas has determined that the main issue in this particular
port is to find a systematic way of decision making about the proper location of
blocks for each service. In fact, the problem was transferring containers from
discharging vessels to yard with minimum distance between berth to yard.
Generally, vessels bring a group of containers to be discharged at the port.
Then the containers are positioned on the spaces in the yard and then are collected
from those spaces and transferred to loading vessels to leave the port. Transferring
the containers from vessel to block and from block to vessel is done with trucks one
by one. In this process the minimizing the cost of fuel for trucks is one significant
issue. Another issue is minimizing the conjunctions of trucks in the port terminal.
The last issue is minimizing the total distance that trucks cross to transfer containers.
The word “service” in this research refers to any sets of cargo which would be
discharged and loaded by vessels. In order to place a cargo on blocks in the yard, this research aimed at determining a position with minimum distance between all vessels.
1.3 Objectives of the Study
6 To develop a mathematical model to minimize the distance between vessels
in berth side to chosen blocks in yard for each service.
1.4 Research Questions
In line with the objective of this research, the following research questions
are defined.
i. Which blocks in the yard side are the best positions for locating a cargo?
ii. How the total distance between vessels and blocks should be calculated to be the minimum distance?
iii. What is the effect of each vessel –from the two aspects of (1) positioning in
the berth, and (2) the number of containers each vessel brings- on the chosen blocks in the yard?
1.5 Significance of the Study
The importance of this research in port is to optimize resources not only to
decrease service time and fuel costs, but also to improve the quality of services. This
optimization improves the efficacy of management at container terminals. As a
result, the general speed of global trading would be improved with much less
investments. This optimization is done on this particular case, but can be extended to
REFERENCES
Boyes, J. R. C. (ed) (1997). Containerisation International Yearbook, Ranking of Containerports of the Word. National Magazin, London.
Bruzzone, A., and Signorile, R. (1998). Simulation and genetic algorithms for ship planning and shipyard layout. Simulation, 71(2):74-83.
Gambardella, L. M., Rizzoli, A. E., and Zaffalon, M. (1998). Simulation and planning of an intermodal container terminal. Simulation, 71(2): 107-116.
Guan, Y., and Cheung, R. K. (2004). The berth allocation problem: models and solution methods. OR Spectrum, 26: 75–92.
Guan, Y., Xiao, W-Q., Cheung, R. K., and Li, C-L. (2002). A multiprocessor task scheduling model for berth allocation: heuristic and worst case analysis.
Operations Research Letters, 30: 343–350.
Hoffarth, L., and Voß, S. (1994). Liegeplatzdisposition auf einem Containerterminal
–Ans¨ atze zur Entwicklung eines entscheidungsunterst¨ utzenden Systems.
In: Dyckhoff, H., Derigs, U., Salomon, M., Tijms, H. eds. Operations Research Proceedings 1993. 89–95. Springer, Berlin Heidelberg New York.
Hulten, L. A. R. (1997). Container logistics and its management. PhD thesis, Chalmers University of Technology: Department of Transportation and Logistics
Imai, A., Nagaiwa, K, and Tat C.W.(1997). Efficient planning of berth allocation for container terminals in Asia. Journal of Advanced Transportation, 31: 75–94.
Imai, A., Nishimura, E., and Papadimitriou, S. (2001). Thedynamic berth allocation problem for a container port. Transportation Research-B, 35(4): 401–417.
Imai, A., Nishimura E, and Papadimitriou, S. (2003). Berth allocation with service priority. Transportation Research-B, 37(5): 437–457.
Kim, K. H., and Moon, K. C. (2003). Berth scheduling by simulated annealing.
50 Lai, K. K., and Shih, K. (1992). A study of container berth allocation. Journal of
Advanced Transportation, 26: 45–60.
Legato, P., and Mazza, R. M. (2001). Berth planning and resources optimization at a container terminal via discrete event simulation. European Journal of Operational Research, 133: 537–547.
Li, C-L., Cai, X., and Lee, C-Y. (1998). Scheduling with multiple-job-on-one-processor pat- tern. IIE Transactions, 30: 433–445.
Lim, A. (1998). The berth planning problem. Operations Research Letters, 22:105– 110.
Nishimura, E., Imai, A., and Papadimitriou, S. (2001). Berth allocation planning in the public berth system by genetic algorithms. European Journal of Operational Research, 131: 282–292.
Moon, K. C. (2000). A mathematical model and a heuristic algorithm for berth planning. PhD thesis, Pusan National University,
http://logistics.ie.pusan.ac.kr/ bk21/pdf/kcMoon.pdf – last check of address:
July 30, 2003
Muller, G. (1995). Intermodal freight transportation, 3rd edn. Eno Foundation for Transportation, Westport, CN
Park, K. T., and Kim, K. H. (2002). Berth scheduling for container terminals by using a sub- gradient optimization technique. Journal of the Operational Research Society, 53: 1054–1062.
Park, Y-M., and Kim, K. H. (2003). A scheduling method for berth and quay cranes.
OR Spectrum, 25: 1–23.
Shen, W. S., and Khoong, C. M. (1995). A DSS for empty container distribution planning. Decision Support Systems, 15(1): 75-82.