[
Business Intelligence Statistical Bulletin
November 2015
2014 Mid-year population estimates:
Ward level population in Kent
Related information
This bulletin presents the 2014 Mid-year
population estimates at ward level for Kent as
published by the Office for National Statistics
(ONS) on 25 November 2015. Annual change
since Mid-year 2013 is also presented.
Ward boundary changes in Canterbury, Shepway, Swale
and Tonbridge & Malling came in to effect as of May 7
2015. Data for these new wards is not available at the
time of writing.
Summary of findings
In 2014 the average population size of a ward in
Kent was 5,340 people.
The ward with the largest population is St.Stephens
in Canterbury with 11,600 people. The ward with
the smallest population is Eynsford in Sevenoaks
with only 1,860 people.
In Kent, 225 wards (80%) have seen a growth in
population in the past 12 months.
Westgate ward in Canterbury has seen the highest
increase in both number and percentage with an
additional +670 people (+6.2%).
57 Kent wards (20%) have seen a loss in
population between Mid-2013 and Mid-2014.
Blean Forest ward in Canterbury experienced the
greatest loss in both number and percentage with a
loss of -400 people (-6%).
Crockenhill & Well Hill ward in Sevenoaks is the
only war to have experienced no change in
population between Mid-2013 and Mid-2014.
The
Population and Census
web page contains further
information which you may
find useful.
Population change presents
a time-series of population
estimates and an analysis of
population growth
Population forecasts
presents the latest thinking
about future population
levels
2011 Census provides
information of the
characteristics of the
population
NOTE
: within this bulletin
’Kent’ refers to the Kent
County Council (KCC) area
which excludes Medway
Strategic Business
Development &
Intelligence
Kent County Council
Sessions House
Maidstone
Kent
ME14 1XQ
Email:
[email protected]
Tel: 03000 417444
Introduction
Mid-Year Population Estimates, or MYPE are derived from a census
population count and each year are rolled forward (people aged by one year)
allowing for changes recorded for births, deaths and migration. Additional
allowances are made to model the transient population such as students and
personnel from the armed forces. This modelling process provides fairly
robust data for larger areas of geography but the margin for error is larger for
small areas, which is why these ward level MYPE are classed as
‘experimental statistics’.
The ward level MYPE data presented in this bulletin are based on population
data recorded through the 2011 Census. When a new census is taken all
historic estimates up to the year prior to that census are re-based to reflect
the population counts recorded via the latest census results. The ONS has
revised all historic ward level population estimates from mid-2002 through to
mid-2010 in-line with the findings of the 2011 Census. This time-series for
Kent wards is available in Excel format upon request.
This bulletin presents the total population at ward level. The 2014 Mid-year
population estimates by 5yr age group and sex at ward level are available
within the
ward profiles
on the KCC website
Note on the data
It is ONS policy to present all estimates rounded to the nearest hundred at
local authority level and to the nearest ten at ward level. Within this bulletin all
mid-year estimates have been individually rounded and therefore may not
sum. Percentages have been calculated using unrounded numbers.
The data in this bulletin will be updated in Autumn 2016 when the 2015
Mid-Year Population Estimates will be released.
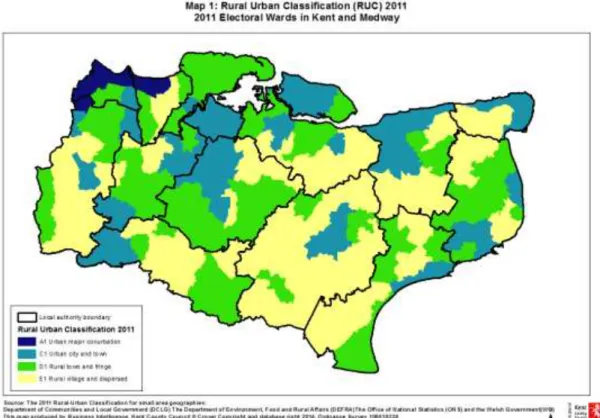
Rural and urban classification
The ‘2011 Rural Urban Classification for Small Area Geographies’ or RUC for
short was released in August 2013.
The RUC was developed for a consortium of government agencies for use
with the 2001 Census and revised following the 2011 Census for a similar
consortium including the Department of Communities and Local Government
(DCLG), the Department of Environment, Food and Rural Affairs (Defra), the
Office of National Statistics (ONS) and the Welsh Government (WG).
Urban totals are created from all wards classified as A1, B1, C1 and C2 and
rural totals are created by adding together data for wards classified as D1,D2,
(town and fringe) and E1 and E2 (rural village). Kent and Medway wards are
categorised as A1, C1, D1 and E1. These are illustrated in Map 1.
Within this bulletin and in the ward profiles we group the wards into urban and
rural areas and identify individual towns such as Maidstone, Tonbridge and
Canterbury plus smaller rural settlements such as Tenterden, Pembury and
Sandwich.
For further information on the Rural Urban Classification (RUC) 2011 please
visit the Office for National Statistics website.
www.statistics.gov.uk
Figure 1: 2011 rural-urban classification of 2011 electoral wards in England and Wales
A1 = Urban major conurbation
B1 = Urban minor conurbation
C1 = Urban city and town
C2 = Urban city and town in a sparse setting
D1 = Rural town and fringe
D2 = Rural town and fringe in a sparse setting
E1 = Rural village and dispersed
E2 = Rural village and dispersed in a sparse setting
Urban
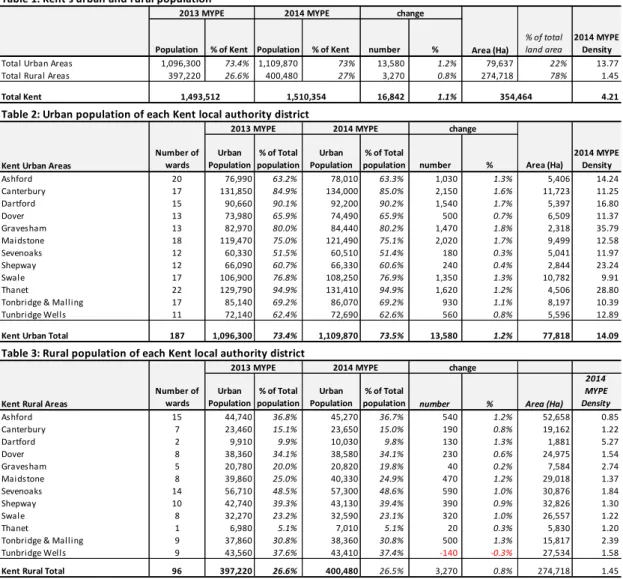
Rural and urban area population
The number of people living in urban areas within Kent in 2014 was just over
1.1 million. This is a rise of +13,580 people (+1.2%) since 2013. In 2014 the
population living in rural areas was 400,480 people. This is a rise of +3,270
people, (+0.8%) since 2013.
People living in urban areas makes up 73% of the Kent population but they
only occupy 22% of the total land area. The remaining 27% of the population
live in rural areas but occupy 78% of the land in Kent. See Tables 1, 2 and 3
for more detail
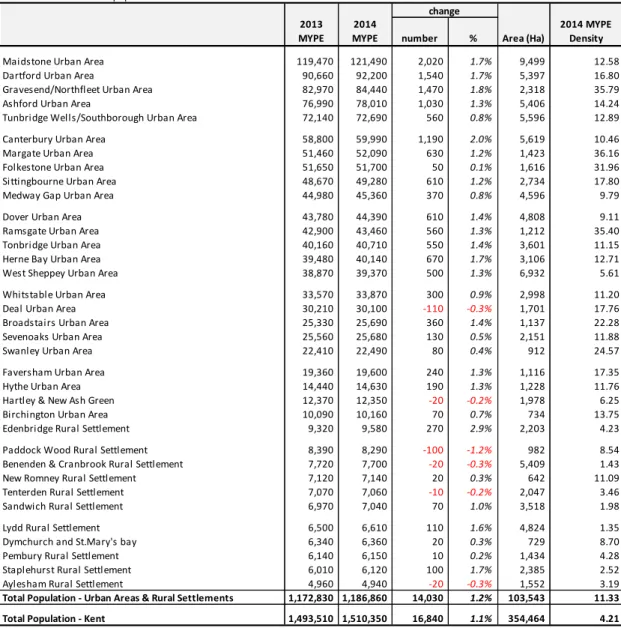
Urban area and rural settlement population
Data for individual wards is grouped into other useful geographies such as
urban and rural settlements. The population of these individual areas are
presented in the relevant local authority tables throughout this bulletin.
Table 1: Kent's urban and rural population
2013 MYPE 2014 MYPE change
Population % of Kent Population % of Kent number % Area (Ha)
% of total land area
2014 MYPE Density
Total Urban Areas 1,096,300 73.4% 1,109,870 73% 13,580 1.2% 79,637 22% 13.77 Total Rural Areas 397,220 26.6% 400,480 27% 3,270 0.8% 274,718 78% 1.45
Total Kent 1,493,512 1,510,354 16,842 1.1% 354,464 4.21
Table 2: Urban population of each Kent local authority district
2013 MYPE 2014 MYPE change Kent Urban Areas
Number of wards Urban Population % of Total population Urban Population % of Total
population number % Area (Ha)
2014 MYPE Density Ashford 20 76,990 63.2% 78,010 63.3% 1,030 1.3% 5,406 14.24 Canterbury 17 131,850 84.9% 134,000 85.0% 2,150 1.6% 11,723 11.25 Dartford 15 90,660 90.1% 92,200 90.2% 1,540 1.7% 5,397 16.80 Dover 13 73,980 65.9% 74,490 65.9% 500 0.7% 6,509 11.37 Gravesham 13 82,970 80.0% 84,440 80.2% 1,470 1.8% 2,318 35.79 Maidstone 18 119,470 75.0% 121,490 75.1% 2,020 1.7% 9,499 12.58 Sevenoaks 12 60,330 51.5% 60,510 51.4% 180 0.3% 5,041 11.97 Shepway 12 66,090 60.7% 66,330 60.6% 240 0.4% 2,844 23.24 Swale 17 106,900 76.8% 108,250 76.9% 1,350 1.3% 10,782 9.91 Thanet 22 129,790 94.9% 131,410 94.9% 1,620 1.2% 4,506 28.80 Tonbridge & Malling 17 85,140 69.2% 86,070 69.2% 930 1.1% 8,197 10.39 Tunbridge Wells 11 72,140 62.4% 72,690 62.6% 560 0.8% 5,596 12.89
Kent Urban Total 187 1,096,300 73.4% 1,109,870 73.5% 13,580 1.2% 77,818 14.09
Table 3: Rural population of each Kent local authority district
2013 MYPE 2014 MYPE change Kent Rural Areas
Number of wards Urban Population % of Total population Urban Population % of Total
population number % Area (Ha) 2014 MYPE Density Ashford 15 44,740 36.8% 45,270 36.7% 540 1.2% 52,658 0.85 Canterbury 7 23,460 15.1% 23,650 15.0% 190 0.8% 19,162 1.22 Dartford 2 9,910 9.9% 10,030 9.8% 130 1.3% 1,881 5.27 Dover 8 38,360 34.1% 38,580 34.1% 230 0.6% 24,975 1.54 Gravesham 5 20,780 20.0% 20,820 19.8% 40 0.2% 7,584 2.74 Maidstone 8 39,860 25.0% 40,330 24.9% 470 1.2% 29,018 1.37 Sevenoaks 14 56,710 48.5% 57,300 48.6% 590 1.0% 30,876 1.84 Shepway 10 42,740 39.3% 43,130 39.4% 390 0.9% 32,826 1.30 Swale 8 32,270 23.2% 32,590 23.1% 320 1.0% 26,557 1.22 Thanet 1 6,980 5.1% 7,010 5.1% 20 0.3% 5,830 1.20
Tonbridge & Malling 9 37,860 30.8% 38,360 30.8% 500 1.3% 15,817 2.39 Tunbridge Wells 9 43,560 37.6% 43,410 37.4% -140 -0.3% 27,534 1.58
However, Table 5 ranks the settlements from the most populated through to
the least, to give an indication of the settlement hierarchy in Kent.
Figures for Medway are presented separately on page 19
Map 2 illustrates the percentage population change of all wards in Kent and
Medway between Mid-2013 and Mid-2014. Areas that have grown the fastest
between 2013 and 2014 are illustrated in dark colours whilst those which have
experienced a decline in population over the past twelve months are
presented in light colours
.
Table 4: Urban Area and Rural Settlement Summary
Ranked in order of most populated as at 2013change 2013
MYPE
2014
MYPE number % Area (Ha)
2014 MYPE Density
Maidstone Urban Area 119,470 121,490 2,020 1.7% 9,499 12.58 Dartford Urban Area 90,660 92,200 1,540 1.7% 5,397 16.80 Gravesend/Northfleet Urban Area 82,970 84,440 1,470 1.8% 2,318 35.79 Ashford Urban Area 76,990 78,010 1,030 1.3% 5,406 14.24 Tunbridge Wells/Southborough Urban Area 72,140 72,690 560 0.8% 5,596 12.89 Canterbury Urban Area 58,800 59,990 1,190 2.0% 5,619 10.46 Margate Urban Area 51,460 52,090 630 1.2% 1,423 36.16 Folkestone Urban Area 51,650 51,700 50 0.1% 1,616 31.96 Sittingbourne Urban Area 48,670 49,280 610 1.2% 2,734 17.80 Medway Gap Urban Area 44,980 45,360 370 0.8% 4,596 9.79 Dover Urban Area 43,780 44,390 610 1.4% 4,808 9.11 Ramsgate Urban Area 42,900 43,460 560 1.3% 1,212 35.40 Tonbridge Urban Area 40,160 40,710 550 1.4% 3,601 11.15 Herne Bay Urban Area 39,480 40,140 670 1.7% 3,106 12.71 West Sheppey Urban Area 38,870 39,370 500 1.3% 6,932 5.61 Whitstable Urban Area 33,570 33,870 300 0.9% 2,998 11.20 Deal Urban Area 30,210 30,100 -110 -0.3% 1,701 17.76 Broadstairs Urban Area 25,330 25,690 360 1.4% 1,137 22.28 Sevenoaks Urban Area 25,560 25,680 130 0.5% 2,151 11.88 Swanley Urban Area 22,410 22,490 80 0.4% 912 24.57 Faversham Urban Area 19,360 19,600 240 1.3% 1,116 17.35 Hythe Urban Area 14,440 14,630 190 1.3% 1,228 11.76 Hartley & New Ash Green 12,370 12,350 -20 -0.2% 1,978 6.25 Birchington Urban Area 10,090 10,160 70 0.7% 734 13.75 Edenbridge Rural Settlement 9,320 9,580 270 2.9% 2,203 4.23 Paddock Wood Rural Settlement 8,390 8,290 -100 -1.2% 982 8.54 Benenden & Cranbrook Rural Settlement 7,720 7,700 -20 -0.3% 5,409 1.43 New Romney Rural Settlement 7,120 7,140 20 0.3% 642 11.09 Tenterden Rural Settlement 7,070 7,060 -10 -0.2% 2,047 3.46 Sandwich Rural Settlement 6,970 7,040 70 1.0% 3,518 1.98 Lydd Rural Settlement 6,500 6,610 110 1.6% 4,824 1.35 Dymchurch and St.Mary's bay 6,340 6,360 20 0.3% 729 8.70 Pembury Rural Settlement 6,140 6,150 10 0.2% 1,434 4.28 Staplehurst Rural Settlement 6,010 6,120 100 1.7% 2,385 2.52 Aylesham Rural Settlement 4,960 4,940 -20 -0.3% 1,552 3.19
Total Population - Urban Areas & Rural Settlements 1,172,830 1,186,860 14,030 1.2% 103,543 11.33 Total Population - Kent 1,493,510 1,510,350 16,840 1.1% 354,464 4.21 Source: 2014 MYPE for wa rds , (experi menta l s ta ti s ti cs rel ea s ed 25 November 2015):Offi ce for Na ti ona l Sta ti s ti cs (ONS), © Crown Copyri ght Pres ented by Stra tegi c Bus i nes s Devel opment & Intel l i gence, Kent County Counci l
Al l wa rd es ti ma tes ha ve been i ndi vi dua l l y rounded to the nea res t 10 for pres enta ti on s o ma y not s um when a dded. Al l di s tri ct es ti ma tes ha ve been i ndi vi dua l l y rounded to the nea res t 100 for pres enta ti on s o ma y not s um when a dded. The Rura l Urba n Cl a s s i fi ca ti on (RUC 2011): DCLG, DEFRA, ONS, a nd the Wel s h Government
Map 3 illustrates the population density of each Kent and Medway ward based
on the 2014 Mid-year population estimate. Areas that currently have the
highest population density are illustrated in dark colours whilst the less
2014 Mid-year Ward level population estimates
changeAshford Borough Council
MYPE2013 2014MYPE number % Area (Ha)
2014 MYPE Density Total 35 Wards 121,700 123,300 1,600 1.3% 58,062 2.10 Urban population 76,990 78,010 1,030 1.3% 5,406 14.24 Rural population 44,740 45,270 540 1.2% 52,658 0.85 change
Ashford Urban Area
2013 MYPE
2014
MYPE number % Area (Ha)
2014 MYPE Density Total 20 Wards 77,000 78,000 1,000 1.3% 5,406 14.24 C1 Aylesford Green 3,540 3,650 110 3.2% 77 45.96 C1 Beaver 5,760 5,900 130 2.3% 114 50.55 C1 Bockhanger 2,500 2,490 -10 -0.2% 246 10.15
C1 Boughton Aluph & Eastwell 3,320 3,320 0 0.0% 1,365 2.43
C1 Bybrook 2,600 2,690 80 3.2% 125 20.81
C1 Godinton 6,730 6,950 220 3.2% 270 24.91
C1 Great Chart with Singleton North 3,920 3,960 40 1.0% 1,252 3.13
C1 Highfield 2,510 2,550 40 1.7% 116 21.60
C1 Kennington 2,270 2,270 0 -0.1% 272 8.35
C1 Little Burton Farm 3,120 3,130 20 0.5% 69 45.17
C1 Norman 2,970 3,010 40 1.4% 162 18.34
C1 North Willesborough 5,040 5,080 40 0.8% 352 14.32
C1 Park Farm North 3,790 3,770 -20 -0.4% 145 26.12
C1 Park Farm South 3,280 3,270 -10 -0.2% 81 40.44
C1 Singleton South 3,240 3,280 40 1.2% 78 41.49 C1 South Willesborough 3,830 3,860 30 0.8% 109 35.10 C1 Stanhope 3,720 3,800 80 2.2% 53 70.15 C1 Stour 5,330 5,310 -20 -0.4% 205 26.00 C1 Victoria 5,910 6,020 120 1.9% 217 27.23 C1 Washford 3,630 3,720 90 2.4% 98 37.07 change
Tenterden Rural Settlement
2013 MYPE
2014
MYPE number % Area (Ha)
2014 MYPE Density Total 3 Wards 7,100 7,100 0 -0.2% 2,047 3.46 D1 St Michaels 2,380 2,370 0 -0.1% 768 3.09 D1 Tenterden North 2,250 2,230 -20 -0.9% 96 23.48 D1 Tenterden South 2,440 2,450 10 0.4% 1,183 2.07 change
Ashford Rural Area
2013 MYPE
2014
MYPE number % Area (Ha)
2014 MYPE Density Total 12 Wards 37,700 38,200 600 1.5% 50,611 0.74 E1 Biddenden 2,550 2,630 80 3.2% 2,912 0.88 D1 Charing 2,330 2,380 50 2.0% 2,111 1.11 E1 Downs North 2,460 2,500 30 1.4% 4,634 0.53 E1 Downs West 2,410 2,460 50 1.9% 3,623 0.67 E1 Isle of Oxney 2,610 2,650 40 1.6% 5,377 0.49
E1 Rolvenden & Tenterden West 2,410 2,430 20 0.8% 4,323 0.56
E1 Saxon Shore 5,180 5,220 50 0.9% 7,664 0.68 E1 Weald Central 4,900 4,940 40 0.9% 6,369 0.77 E1 Weald East 2,770 2,850 80 2.8% 1,973 1.41 E1 Weald North 2,400 2,420 20 0.8% 3,418 0.70 E1 Weald South 5,260 5,290 30 0.5% 5,796 0.91 D1 Wye 2,380 2,450 70 2.9% 2,411 0.99 C1 Urba n ci ty a nd town D1 Rura l town a nd fri nge E1 Rura l vi l l a ge a nd di s pers ed
Source: 2014 MYPE for wa rds , (experi menta l s ta ti s ti cs rel ea s ed 25 November 2015):Offi ce for Na ti ona l Sta ti s ti cs (ONS), © Crown Copyri ght Pres ented by Stra tegi c Bus i nes s Devel opment & Intel l i gence, Kent County Counci l
Dens i ty i s the number of pers ons per hecta re whi ch i s ca l cul a ted by di vi di ng the popul a ti on by the a rea .
Al l wa rd es ti ma tes ha ve been i ndi vi dua l l y rounded to the nea res t 10 for pres enta ti on s o ma y not s um when a dded. Al l di s tri ct es ti ma tes ha ve been i ndi vi dua l l y rounded to the nea res t 100 for pres enta ti on s o ma y not s um when a dded. The Rura l Urba n Cl a s s i fi ca ti on (RUC 2011): DCLG, DEFRA, ONS, a nd the Wel s h Government
2014 Mid-year Ward level population estimates
changeCanterbury City Council
2013 MYPE2014
MYPE number % Area (Ha)
2014 MYPE Density Total 24 Wards 155,300 157,600 2,300 1.5% 30,885 5.03 Urban population 131,850 134,000 2,150 0.02 11,723 11.25 Rural population 23,460 23,650 190 0.01 19,162 1.22 change
Canterbury Urban Area
2013 MYPE
2014
MYPE number % Area (Ha)
2014 MYPE Density Total 7 Wards 58,800 60,000 1,200 2.0% 5,619 10.46 C1 Barton 10,770 10,520 -250 -2.3% 876 12.29 C1 Blean Forest 6,720 6,310 -400 -6.0% 1,960 3.43 C1 Harbledown 2,670 2,750 80 2.9% 1,370 1.95 C1 Northgate 7,540 7,640 100 1.4% 192 39.27 C1 St Stephens 11,010 11,660 650 5.9% 238 46.25 C1 Westgate 10,810 11,470 670 6.2% 239 45.21 C1 Wincheap 9,290 9,630 340 3.6% 744 12.48 change
Herne Bay Urban Area
2013 MYPE
2014
MYPE number % Area (Ha)
2014 MYPE Density Total 5 Wards 39,500 40,100 700 1.7% 3,106 12.71
C1 Greenhill & Eddington 6,140 6,190 50 0.8% 743 8.27
C1 Herne & Broomfield 8,750 9,080 330 3.7% 1,097 7.98
C1 Heron 9,120 9,270 150 1.7% 144 63.31
C1 Reculver 8,980 9,040 60 0.7% 920 9.77
C1 West Bay 6,490 6,570 80 1.2% 202 32.11
change
Whitstable Urban Area
2013 MYPE
2014
MYPE number % Area (Ha)
2014 MYPE Density Total 5 Wards 33,600 33,900 300 0.9% 2,998 11.20
C1 Chestfield & Swalecliffe 8,540 8,610 70 0.8% 1,094 7.80
C1 Gorrell 6,400 6,490 90 1.4% 538 11.90
C1 Harbour 5,760 5,810 50 0.9% 121 47.58
C1 Seasalter 8,220 8,240 10 0.1% 1,113 7.39
C1 Tankerton 4,650 4,730 70 1.6% 132 35.25
change
Canterbury Rural Areas
2013 MYPE
2014
MYPE number % Area (Ha)
2014 MYPE Density Total 7 Wards 23,500 23,700 200 0.8% 19,162 1.22
E1 Barham Downs 2,800 2,830 30 1.1% 3,892 0.72
E1 Chartham & Stone Street 6,050 6,050 0 0.0% 5,741 1.05
D1 Little Stour 2,790 2,810 20 0.7% 3,007 0.93 E1 Marshside 3,390 3,400 10 0.3% 2,917 1.16 E1 North Nailbourne 2,770 2,780 10 0.4% 2,173 1.27 D1 Sturry North 2,790 2,810 20 0.7% 1,161 2.40 D1 Sturry South 2,870 2,970 100 3.5% 271 10.61 C1 Urba n ci ty a nd town
D1 Rura l town a nd fri nge
E1 Rura l vi l l a ge a nd di s pers ed
Source: 2014 MYPE for wa rds , (experi menta l s ta ti s ti cs rel ea s ed 25 November 2015):Offi ce for Na ti ona l Sta ti s ti cs (ONS), © Crown Copyri ght Pres ented by Stra tegi c Bus i nes s Devel opment & Intel l i gence, Kent County Counci l
Dens i ty i s the number of pers ons per hecta re whi ch i s ca l cul a ted by di vi di ng the popul a ti on by the a rea .
Al l wa rd es ti ma tes ha ve been i ndi vi dua l l y rounded to the nea res t 10 for pres enta ti on s o ma y not s um when a dded. Al l di s tri ct es ti ma tes ha ve been i ndi vi dua l l y rounded to the nea res t 100 for pres enta ti on s o ma y not s um when a dded. The Rura l Urba n Cl a s s i fi ca ti on (RUC 2011): DCLG, DEFRA, ONS, a nd the Wel s h Government
2014 Mid-year Ward level population estimates
changeDartford Borough Council
2013 MYPE2014
MYPE number % Area (Ha)
2014 MYPE Density Total 17 Wards ####### 102,200 1,700 1.7% 7,277 13.82 Urban population 90,660 92,200 1,540 0.02 5,397 16.80 Rural population 9,910 10,030 130 0.01 1,881 5.27 change
Dartford Urban Area
2013 MYPE
2014
MYPE number % Area (Ha)
2014 MYPE Density Total 15 Wards 90,700 92,200 1,500 1.7% 5,397 16.80 A1 Brent 6,680 6,720 40 0.6% 281 23.77 A1 Castle 2,890 2,940 40 1.5% 57 50.75 A1 Greenhithe 7,300 7,420 130 1.8% 435 16.77 A1 Heath 6,310 6,350 30 0.5% 260 24.28 A1 Joyce Green 5,110 5,240 130 2.5% 454 11.25 A1 Joydens Wood 7,290 7,270 -10 -0.2% 521 13.99 A1 Littlebrook 4,510 4,560 50 1.1% 224 20.14
C1 Longfield, New Barn & Southfleet 6,550 6,700 150 2.3% 1,271 5.15
A1 Newtown 7,480 7,640 160 2.2% 135 55.40 A1 Princes 6,350 6,410 60 1.0% 154 41.22 A1 Stone 6,720 7,010 300 4.5% 494 13.59 A1 Swanscombe 7,760 7,980 220 2.8% 429 18.10 A1 Town 4,610 4,820 200 4.4% 140 32.94 A1 West Hill 7,070 7,110 40 0.6% 135 52.36 A1 Wilmington 4,030 4,030 0 -0.0% 407 9.91 change
Dartford Rural Area
2013 MYPE
2014
MYPE number % Area (Ha)
2014 MYPE Density Total 2 Wards 9,900 10,000 100 1.3% 1,881 5.27
D1 Bean & Darenth 5,690 5,780 90 1.6% 1,127 5.05
D1 Sutton-at-Hone & Hawley 4,220 4,250 30 0.8% 754 5.59
A1 Urba n ma jor conurba ti on C1 Urba n ci ty a nd town D1 Rura l town a nd fri nge
Source: 2014 MYPE for wa rds , (experi menta l s ta ti s ti cs rel ea s ed 25 November 2015):Offi ce for Na ti ona l Sta ti s ti cs (ONS), © Crown Copyri ght Pres ented by Stra tegi c Bus i nes s Devel opment & Intel l i gence, Kent County Counci l
Dens i ty i s the number of pers ons per hecta re whi ch i s ca l cul a ted by di vi di ng the popul a ti on by the a rea . Al l wa rd es ti ma tes ha ve been i ndi vi dua l l y rounded to the nea res t 10 for pres enta ti on s o ma y not s um when a dded. Al l di s tri ct es ti ma tes ha ve been i ndi vi dua l l y rounded to the nea res t 100 for pres enta ti on s o ma y not s um when a dded. The Rura l Urba n Cl a s s i fi ca ti on (RUC 2011): DCLG, DEFRA, ONS, a nd the Wel s h Government
2014 Mid-year Ward level population estimates
changeDover District Council
2013 MYPE2014
MYPE number % Area (Ha)
2014 MYPE Density Total 21 Wards 112,300 113,100 700 0.6% 31,484 3.57 Urban population 73,980 74,490 500 0.01 6,509 11.37 Rural population 38,360 38,580 230 0.01 24,975 1.54 change
Deal Urban Area
2013 MYPE
2014
MYPE number % Area (Ha)
2014 MYPE Density Total 4 Wards 30,200 30,100 -100 -0.3% 1,701 17.76
C1 Middle Deal & Sholden 7,450 7,460 10 0.1% 956 7.79
C1 Mill Hill 7,910 7,820 -90 -1.1% 283 27.93
C1 North Deal 7,430 7,370 -50 -0.7% 132 56.25
C1 Walmer 7,430 7,450 30 0.3% 330 22.50
change
Dover Urban Area
2013 MYPE
2014
MYPE number % Area (Ha)
2014 MYPE Density Total 9 Wards 43,800 44,400 600 1.4% 4,808 9.11
C1 Buckland 7,640 7,740 100 1.3% 195 39.16
C1 Castle 2,320 2,380 60 2.8% 171 13.57
C1 Lydden & Temple Ewell 2,390 2,460 70 2.9% 1,148 2.08
C1 Maxton, Elms Vale & Priory 7,910 7,950 40 0.5% 342 23.13
C1 River 4,580 4,600 20 0.5% 1,555 2.94
C1 St Radigunds 5,680 5,750 70 1.2% 244 23.30
C1 Tower Hamlets 6,060 6,240 180 3.0% 88 68.89
C1 Town and Pier 2,100 2,130 30 1.2% 367 5.72
C1 Whitfield 5,100 5,130 40 0.7% 698 7.30
change
Aylesham Rural Settlement
2013 MYPE
2014
MYPE number % Area (Ha)
2014 MYPE Density Total 1 Ward 5,000 4,900 0 -0.3% 1,552 3.19
D1 Aylesham 4,960 4,940 -20 -0.3% 1,552 3.19
change
Sandwich Rural Settlement
2013 MYPE
2014
MYPE number % Area (Ha)
2014 MYPE Density Total 1 Ward 7,000 7,000 100 1.0% 3,518 1.98
D1 Sandwich 6,970 7,040 70 1.0% 3,518 1.98
change
Dover Rural Area
2013 MYPE
2014
MYPE number % Area (Ha)
2014 MYPE Density Total 6 Wards 26,400 26,600 200 0.6% 19,905 1.33
D1 Capel-le-Ferne 2,400 2,400 0 -0.0% 1,443 1.66
D1 Eastry 5,190 5,170 -20 -0.3% 4,637 1.12
D1 Eythorne & Shepherdswell 4,810 4,830 20 0.4% 3,460 1.39
E1 Little Stour & Ashstone 6,930 7,030 100 1.4% 6,572 1.05
D1 Ringwould 2,030 2,040 10 0.4% 638 3.19
E1 St Margaret's-at-Cliffe 5,080 5,140 70 1.3% 3,155 1.61
C1 Urba n ci ty a nd town D1 Rura l town a nd fri nge E1 Rura l vi l l a ge a nd di s pers ed
Source: 2014 MYPE for wa rds , (experi menta l s ta ti s ti cs rel ea s ed 25 November 2015):Offi ce for Na ti ona l Sta ti s ti cs (ONS), © Crown Copyri ght Pres ented by Stra tegi c Bus i nes s Devel opment & Intel l i gence, Kent County Counci l
Dens i ty i s the number of pers ons per hecta re whi ch i s ca l cul a ted by di vi di ng the popul a ti on by the a rea .
Al l wa rd es ti ma tes ha ve been i ndi vi dua l l y rounded to the nea res t 10 for pres enta ti on s o ma y not s um when a dded. Al l di s tri ct es ti ma tes ha ve been i ndi vi dua l l y rounded to the nea res t 100 for pres enta ti on s o ma y not s um when a dded. The Rura l Urba n Cl a s s i fi ca ti on (RUC 2011): DCLG, DEFRA, ONS, a nd the Wel s h Government
2014 Mid-year Ward level population estimates
changeGravesham Borough
Council
2013 MYPE 2014MYPE number % Area (Ha)
2014 MYPE Density Total 18 Wards 103,800 105,300 1,500 1.5% 9,902 10.48 Urban population 82,970 84,440 1,470 0.02 2,318 35.79 Rural population 20,780 20,820 40 0.00 7,584 2.74 change
Gravesend/Northfleet Urban Area 2013 MYPE
2014
MYPE number % Area (Ha)
2014 MYPE Density Total 13 Wards 83,000 84,400 1,500 1.8% 2,318 35.79 A1 Central 6,950 7,070 120 1.7% 132 52.64 A1 Chalk 2,140 2,180 40 1.8% 354 6.04 A1 Coldharbour 4,900 4,910 20 0.4% 83 58.98 A1 Northfleet North 8,020 8,310 300 3.7% 299 26.81 A1 Northfleet South 7,980 8,120 140 1.8% 234 34.08 A1 Painters Ash 5,740 5,780 30 0.5% 113 50.83 A1 Pelham 7,910 7,990 80 1.0% 120 65.93 A1 Riverside 8,900 9,100 190 2.2% 209 42.60 A1 Riverview 4,420 4,450 30 0.7% 148 29.87 A1 Singlewell 7,770 8,070 300 3.9% 131 59.30 A1 Westcourt 6,950 7,000 50 0.7% 204 34.07 A1 Whitehill 4,480 4,560 80 1.7% 72 62.25 A1 Woodlands 6,820 6,920 100 1.5% 219 31.12 change
Gravesham Rural Area
2013 MYPE
2014
MYPE number % Area (Ha)
2014 MYPE Density Total 5 Wards 20,800 20,800 0 0.2% 7,584 2.74 D1 Higham 4,050 4,070 20 0.5% 1,322 3.06 D1 Istead Rise 3,480 3,470 -10 -0.3% 740 4.70 D1 Meopham North 4,490 4,510 20 0.3% 1,092 4.11
D1 Meopham South & Vigo 4,510 4,510 -10 -0.2% 998 4.52
E1 Shorne, Cobham & Luddesdown 4,250 4,270 20 0.5% 3,432 1.24
A1 Urba n ma jor conurba ti on D1 Rura l town a nd fri nge E1 Rura l vi l l a ge a nd di s pers ed
Source: 2014 MYPE for wa rds , (experi menta l s ta ti s ti cs rel ea s ed 25 November 2015):Offi ce for Na ti ona l Sta ti s ti cs (ONS), © Crown Copyri ght Pres ented by Stra tegi c Bus i nes s Devel opment & Intel l i gence, Kent County Counci l
Dens i ty i s the number of pers ons per hecta re whi ch i s ca l cul a ted by di vi di ng the popul a ti on by the a rea . Al l wa rd es ti ma tes ha ve been i ndi vi dua l l y rounded to the nea res t 10 for pres enta ti on s o ma y not s um when a dded. Al l di s tri ct es ti ma tes ha ve been i ndi vi dua l l y rounded to the nea res t 100 for pres enta ti on s o ma y not s um when a dded. The Rura l Urba n Cl a s s i fi ca ti on (RUC 2011): DCLG, DEFRA, ONS, a nd the Wel s h Government
2014 Mid-year Ward level population estimates
changeMaidstone Borough Council
2013 MYPE
2014
MYPE number % Area (Ha)
2014 MYPE Density Total 26 Wards 159,300 161,800 2,500 1.6% 39,333 4.05 Urban population 119,470 121,490 2,020 0.02 9,499 12.58 Rural population 39,860 40,330 470 0.01 29,018 1.37 change
Maidstone Urban Area
2013 MYPE
2014
MYPE number % Area (Ha)
2014 MYPE Density Total 18 Wards 119,500 121,500 2,000 1.7% 9,499 12.58 C1 Allington 6,990 7,030 50 0.6% 271 25.79 C1 Barming 2,370 2,360 -10 -0.5% 574 4.13 C1 Bearsted 8,190 8,290 100 1.2% 280 29.24 C1 Boxley 8,570 8,540 -40 -0.4% 2,415 3.55
C1 Boughton Monchelsea & Chart Sutton 2,660 2,690 20 0.9% 1,858 1.43
C1 Bridge 5,980 6,120 140 2.4% 174 34.34
C1 Detling & Thurnham 3,060 3,070 10 0.4% 1,931 1.58
C1 Downswood & Otham 2,770 2,840 80 2.7% 375 7.38
C1 East 8,600 8,820 220 2.5% 167 51.49 C1 Fant 10,250 10,560 320 3.1% 244 42.00 C1 Heath 6,150 6,450 300 4.8% 186 33.08 C1 High Street 10,210 10,530 320 3.2% 192 53.16 C1 Loose 2,420 2,450 30 1.0% 268 9.04 C1 North 9,850 10,100 240 2.5% 238 41.40 C1 Park Wood 7,280 7,320 40 0.5% 234 31.11 C1 Shepway North 9,000 9,050 40 0.5% 385 23.38 C1 Shepway South 5,880 5,950 70 1.1% 115 51.14 C1 South 9,240 9,340 100 1.1% -408 -22.65 change
Staplehurst Rural Settlement
2013 MYPE
2014
MYPE number % Area (Ha)
2014 MYPE Density Total 1 Ward 6,000 6,100 100 1.7% 2,385 2.52
D1 Staplehurst 6,010 6,120 100 1.7% 2,385 2.52
change
Maidstone Rural Area
2013 MYPE
2014
MYPE number % Area (Ha)
2014 MYPE Density Total 7 Wards 33,800 34,200 400 1.1% 26,633 1.27
D1 Coxheath & Hunton 7,450 7,460 10 0.1% 2,785 2.68
D1 Harrietsham & Lenham 5,610 5,680 60 1.1% 3,375 1.66
D1 Headcorn 5,260 5,370 110 2.1% 5,302 0.99
D1 Leeds 2,440 2,420 -20 -0.9% 1,256 1.94
D1 Marden & Yalding 7,770 7,940 170 2.2% 6,147 1.26
E1 North Downs 2,410 2,400 0 -0.2% 6,515 0.37
E1 Sutton Valence & Langley 2,910 2,950 40 1.4% 1,253 2.32
C1 Urba n ci ty a nd town
D1 Rura l town a nd fri nge
E1 Rura l vi l l a ge a nd di s pers ed
Source: 2014 MYPE for wa rds , (experi menta l s ta ti s ti cs rel ea s ed 25 November 2015):Offi ce for Na ti ona l Sta ti s ti cs (ONS), © Crown Copyri ght Pres ented by Stra tegi c Bus i nes s Devel opment & Intel l i gence, Kent County Counci l
Dens i ty i s the number of pers ons per hecta re whi ch i s ca l cul a ted by di vi di ng the popul a ti on by the a rea .
Al l wa rd es ti ma tes ha ve been i ndi vi dua l l y rounded to the nea res t 10 for pres enta ti on s o ma y not s um when a dded. Al l di s tri ct es ti ma tes ha ve been i ndi vi dua l l y rounded to the nea res t 100 for pres enta ti on s o ma y not s um when a dded. The Rura l Urba n Cl a s s i fi ca ti on (RUC 2011): DCLG, DEFRA, ONS, a nd the Wel s h Government
2014 Mid-year Ward level population estimates
change
Sevenoaks District Council
2013 MYPE
2014
MYPE number % Area (Ha)
2014 MYPE Density Total 26 Wards 117,000 117,800 800 0.7% 37,034 3.16 Urban population 60,330 60,510 180 0.00 5,041 11.97 Rural population 56,710 57,300 590 0.01 30,876 1.84 change
Sevenoaks Urban Area
2013 MYPE
2014
MYPE number % Area (Ha)
2014 MYPE Density Total 5 Wards 25,600 25,700 100 0.5% 2,151 11.88 C1 Sevenoaks Eastern 4,210 4,230 20 0.4% 126 33.44 C1 Sevenoaks Kippington 4,940 4,960 20 0.5% 390 12.66 C1 Sevenoaks Northern 4,570 4,560 -20 -0.3% 336 13.61
C1 Sevenoaks Town & St John's 6,750 6,790 40 0.6% 623 10.83
C1 Dunton Green & Riverhead 5,080 5,150 60 1.2% 676 7.52
change
Swanley Urban Area
2013 MYPE
2014
MYPE number % Area (Ha)
2014 MYPE Density Total 5 Wards 22,400 22,500 100 0.4% 912 24.57
C1 Crockenhill & Well Hill 1,950 1,950 0 0.0% 1,003 1.95
A1 Swanley Christchurch & Swanley Village 5,760 5,760 0 -0.0% 416 13.84
A1 Swanley St Mary's 4,380 4,430 50 1.1% 111 39.48
A1 Swanley White Oak 6,210 6,330 110 1.8% 187 33.23
A1 Hextable 4,100 4,020 -80 -2.0% 198 20.70
change
Hartley & New Ash Green
2013 MYPE
2014
MYPE number % Area (Ha)
2014 MYPE Density Total 2 Wards 12,400 12,300 0 -0.2% 1,978 6.25
C1 Ash & New Ash Green 6,430 6,380 -50 -0.8% 663 9.70
C1 Hartley & Hodsoll Street 5,940 5,970 30 0.5% 1,315 4.51
change
Edenbridge Rural Settlement
2013 MYPE
2014
MYPE number % Area (Ha)
2014 MYPE Density Total 2 Wards 9,300 9,600 300 2.9% 2,203 4.23
D1 Edenbridge North & East 4,840 5,030 180 3.8% 965 5.02
D1 Edenbridge South & West 4,480 4,560 80 1.9% 1,238 3.61
change
Sevenoaks Rural Area
2013 MYPE
2014
MYPE number % Area (Ha)
2014 MYPE Density Total 12 Wards 47,400 47,700 300 0.7% 28,673 1.65
E1 Brasted, Chevening & Sundridge 6,630 6,730 100 1.6% 4,688 1.41
E1 Cowden & Hever 2,120 2,120 0 0.0% 2,742 0.77
D1 Eynsford 1,870 1,860 -10 -0.4% 1,454 1.29
D1 Farningham, Horton Kirby & South Darenth 4,940 4,990 50 1.1% 2,017 2.45
D1 Fawkham & West Kingsdown 5,980 6,070 100 1.6% 2,261 2.64
E1 Halstead, Knockholt & Badgers Mount 3,550 3,540 -20 -0.5% 1,602 2.22
D1 Kemsing 4,200 4,280 70 1.7% 894 4.70
E1 Leigh & Chiddingstone Causeway 2,270 2,230 -40 -1.6% 2,515 0.90
E1 Otford & Shoreham 4,560 4,620 60 1.2% 2,147 2.13
E1 Penshurst, Fordcombe & Chiddingstone 2,480 2,460 -20 -0.8% 3,186 0.78
E1 Seal & Weald 4,220 4,210 -10 -0.1% 2,880 1.47
D1 Westerham & Crockham Hill 4,580 4,600 30 0.6% 2,287 2.00
A1 Urba n ma jor conurba ti on C1 Urba n ci ty a nd town D1 Rura l town a nd fri nge E1 Rura l vi l l a ge a nd di s pers ed
Source: 2014 MYPE for wa rds , (experi menta l s ta ti s ti cs rel ea s ed 25 November 2015):Offi ce for Na ti ona l Sta ti s ti cs (ONS), © Crown Copyri ght Pres ented by Stra tegi c Bus i nes s Devel opment & Intel l i gence, Kent County Counci l
2014 Mid-year Ward level population estimates
change
Shepway District Council
MYPE20132014
MYPE number % Area (Ha)
2014 MYPE Density Total 22 Wards 108,800 109,500 600 0.6% 35,670 3.05 Urban population 66,090 66,330 240 0.00 2,844 23.24 Rural population 42,740 43,130 390 0.01 32,826 1.30 change
Folkestone Urban Area
2013 MYPE
2014
MYPE number % Area (Ha)
2014 MYPE Density Total 9 Wards 51,700 51,700 0 0.1% 1,616 31.96 C1 Folkestone Cheriton 7,850 7,770 -90 -1.1% 387 20.29 C1 Folkestone East 4,860 4,810 -50 -1.0% 291 16.71 C1 Folkestone Foord 5,860 5,880 20 0.3% 54 108.50 C1 Folkestone Harbour 5,720 5,810 100 1.7% 139 41.14
C1 Folkestone Harvey Central 6,860 7,090 230 3.4% 98 69.97
C1 Folkestone Harvey West 4,720 4,660 -60 -1.2% 112 42.16
C1 Folkestone Morehall 4,780 4,720 -60 -1.2% 116 41.22
C1 Folkestone Park 6,160 6,190 30 0.4% 212 29.07
C1 Folkestone Sandgate 4,840 4,770 -70 -1.4% 207 23.36
change
Hythe Urban Area
2013 MYPE
2014
MYPE number % Area (Ha)
2014 MYPE Density Total 3 Wards 14,400 14,600 200 1.3% 1,228 11.76 C1 Hythe Central 5,930 6,040 110 1.9% 181 32.74 C1 Hythe East 4,230 4,280 50 1.3% 441 9.59 C1 Hythe West 4,280 4,310 30 0.6% 606 7.06 change
Dymchurch and St.Mary's bay
2013 MYPE
2014
MYPE number % Area (Ha)
2014 MYPE Density Total 1 Ward 6,300 6,400 0 0.3% 729 8.70
D1 Dymchurch & St Mary's Bay 6,340 6,360 20 0.3% 729 8.70
change
Lydd Rural Settlement
2013 MYPE
2014
MYPE number % Area (Ha)
2014 MYPE Density Total 1 Ward 6,500 6,600 100 1.6% 4,824 1.35
D1 Lydd 6,500 6,610 110 1.6% 4,824 1.35
change
New Romney Rural Settlement
2013 MYPE
2014
MYPE number % Area (Ha)
2014 MYPE Density Total 2 Wards 7,100 7,100 0 0.3% 642 11.09
D1 New Romney Coast 3,470 3,490 30 0.8% 360 9.63
D1 New Romney Town 3,660 3,650 -10 -0.1% 282 12.96
change
Shepway Rural Area
2013 MYPE
2014
MYPE number % Area (Ha)
2014 MYPE Density Total 6 Wards 22,800 23,000 200 1.0% 26,631 0.86
E1 Elham & Stelling Minnis 2,090 2,090 0 -0.0% 3,424 0.61
D1 Lympne & Stanford 2,020 2,020 0 0.0% 1,541 1.31
D1 North Downs East 9,790 9,900 110 1.1% 2,554 3.83
D1 North Downs West 4,450 4,490 30 0.7% 4,080 1.09
E1 Romney Marsh 2,400 2,430 40 1.6% 12,091 0.20
E1 Tolsford 2,030 2,080 50 2.6% 2,941 0.69
C1 Urba n ci ty a nd town D1 Rura l town a nd fri nge E1 Rura l vi l l a ge a nd di s pers ed
Source: 2014 MYPE for wa rds , (experi menta l s ta ti s ti cs rel ea s ed 25 November 2015):Offi ce for Na ti ona l Sta ti s ti cs (ONS), © Crown Copyri ght Pres ented by Stra tegi c Bus i nes s Devel opment & Intel l i gence, Kent County Counci l
Dens i ty i s the number of pers ons per hecta re whi ch i s ca l cul a ted by di vi di ng the popul a ti on by the a rea .
Al l wa rd es ti ma tes ha ve been i ndi vi dua l l y rounded to the nea res t 10 for pres enta ti on s o ma y not s um when a dded. Al l di s tri ct es ti ma tes ha ve been i ndi vi dua l l y rounded to the nea res t 100 for pres enta ti on s o ma y not s um when a dded.
2014 Mid-year Ward level population estimates
changeSwale Borough Council
2013 MYPE
2014
MYPE number % Area (Ha)
2014 MYPE Density Total 25 Wards 139,200 140,800 1,700 1.2% 37,341 3.73 Urban population 106,900 108,250 1,350 0.01 10,782 9.91 Rural population 32,270 32,590 320 0.01 26,557 1.22 change
Faversham Urban Area
2013 MYPE
2014
MYPE number % Area (Ha)
2014 MYPE Density Total 4 Wards 19,400 19,600 200 1.3% 1,116 17.35 C1 Abbey 6,150 6,200 50 0.8% 258 23.83 C1 Davington Priory 2,610 2,740 130 5.1% 361 7.22 C1 St Ann's 5,230 5,260 30 0.7% 116 45.08 C1 Watling 5,380 5,400 30 0.5% 381 14.11 change
Sittingbourne Urban Area
2013 MYPE
2014
MYPE number % Area (Ha)
2014 MYPE Density Total 8 Wards 48,700 49,300 600 1.2% 2,734 17.80 C1 Chalkwell 5,650 5,670 20 0.3% 120 47.08 C1 Grove 7,680 7,760 70 1.0% 775 9.91 C1 Kemsley 7,810 7,890 80 1.0% 438 17.84 C1 Milton Regis 4,910 5,030 130 2.6% 168 29.20 C1 Murston 6,330 6,560 230 3.6% 406 15.59 C1 Roman 5,010 4,970 -50 -1.0% 111 45.16 C1 St Michaels 6,430 6,500 70 1.1% 192 33.47 C1 Woodstock 4,850 4,910 60 1.3% 524 9.26 change
West Sheppey Urban Area
2013 MYPE
2014
MYPE number % Area (Ha)
2014 MYPE Density Total 5 Wards 38,900 39,400 500 1.3% 6,932 5.61
C1 Minster Cliffs 7,580 7,700 120 1.6% 620 12.22
C1 Queenborough & Halfway 7,600 7,610 10 0.1% 1,081 7.03
C1 Sheerness East 6,160 6,290 130 2.0% 96 64.17
C1 Sheerness West 6,130 6,230 100 1.6% 385 15.93
C1 Sheppey Central 11,400 11,550 140 1.3% 4,750 2.40
change
Swale Rural Area
2013 MYPE
2014
MYPE number % Area (Ha)
2014 MYPE Density Total 8 Wards 32,300 32,600 300 1.0% 26,557 1.22
E1 Borden 2,460 2,510 50 2.0% 719 3.42
E1 Boughton & Courtenay 5,800 5,750 -50 -0.8% 6,393 0.91
E1 East Downs 2,680 2,660 -20 -0.7% 6,007 0.45
D1 Hartlip, Newington & Upchurch 5,730 5,790 60 1.0% 2,519 2.27
D1 Iwade & Lower Halstow 4,570 4,670 100 2.2% 1,831 2.49
D1 Leysdown & Warden 3,070 3,160 90 2.9% 2,155 1.43
D1 Teynham & Lynsted 5,340 5,410 70 1.3% 4,502 1.19
E1 West Downs 2,630 2,660 20 0.8% 2,431 1.08
The Isle of Sheppey change Includes West Sheppey Urban Area plus
Leysdown and Warden rural ward
2013 MYPE
2014
MYPE number % Area (Ha)
2014 MYPE Density Total 6 Wards 41,900 42,500 600 1.4% 9,087 4.62 C1 Urba n ci ty a nd town
D1 Rura l town a nd fri nge E1 Rura l vi l l a ge a nd di s pers ed
Source: 2014 MYPE for wa rds , (experi menta l s ta ti s ti cs rel ea s ed 25 November 2015):Offi ce for Na ti ona l Sta ti s ti cs (ONS), © Crown Copyri ght Pres ented by Stra tegi c Bus i nes s Devel opment & Intel l i gence, Kent County Counci l
Dens i ty i s the number of pers ons per hecta re whi ch i s ca l cul a ted by di vi di ng the popul a ti on by the a rea . Al l wa rd es ti ma tes ha ve been i ndi vi dua l l y rounded to the nea res t 10 for pres enta ti on s o ma y not s um when a dded. Al l di s tri ct es ti ma tes ha ve been i ndi vi dua l l y rounded to the nea res t 100 for pres enta ti on s o ma y not s um when a dded.
2014 Mid-year Ward level population estimates
change
Thanet District Council
2013 MYPE
2014
MYPE number % Area (Ha)
2014 MYPE Density Total 23 Wards 136,800 138,400 1,600 1.2% 10,330 13.24 Urban population 129,790 131,410 1,620 0.01 4,506 28.80 Rural population 6,980 7,010 20 0.00 5,830 1.20 change
Birchington Urban Area
2013 MYPE
2014
MYPE number % Area (Ha)
2014 MYPE Density Total 2 Wards 10,100 10,200 100 0.7% 734 13.75 C1 Birchington North 3,770 3,860 80 2.1% 173 21.82 C1 Birchington South 6,320 6,310 -10 -0.1% 561 11.26 change
Broadstairs Urban Area
2013 MYPE
2014
MYPE number % Area (Ha)
2014 MYPE Density Total 5 Wards 25,300 25,700 400 1.4% 1,137 22.28 C1 Beacon Road 4,770 4,880 110 2.2% 148 32.26 C1 Bradstowe 4,120 4,200 80 1.8% 119 34.64 C1 Kingsgate 2,130 2,220 80 3.9% 236 9.04 C1 St Peters 7,080 7,130 50 0.7% 426 16.62 C1 Viking 7,220 7,270 40 0.6% 208 34.73 change
Margate Urban Area
2013 MYPE
2014
MYPE number % Area (Ha)
2014 MYPE Density Total 8 Wards 51,500 52,100 600 1.2% 1,423 36.16 C1 Cliftonville East 6,220 6,270 50 0.8% 228 27.29 C1 Cliftonville West 9,530 9,960 440 4.6% 93 102.42 C1 Dane Valley 7,900 7,950 50 0.6% 161 49.09 C1 Garlinge 4,980 4,880 -110 -2.1% 248 20.08 C1 Margate Central 5,600 5,800 200 3.6% 88 63.58 C1 Salmestone 5,740 5,720 -20 -0.4% 284 20.20 C1 Westbrook 4,250 4,310 60 1.3% 104 40.88 C1 Westgate-on-Sea 7,240 7,210 -30 -0.4% 217 33.37 change
Ramsgate Urban Area
2013 MYPE
2014
MYPE number % Area (Ha)
2014 MYPE Density Total 7 Wards 42,900 43,500 600 1.3% 1,212 35.40
C1 Central Harbour 8,370 8,450 80 1.0% 142 58.94
C1 Cliffsend & Pegwell 4,740 4,800 60 1.3% 384 12.33
C1 Eastcliff 8,170 8,400 230 2.8% 97 84.26
C1 Nethercourt 4,750 4,830 90 1.9% 86 55.17
C1 Newington 5,210 5,270 60 1.1% 132 39.47
C1 Northwood 6,550 6,570 20 0.2% 264 24.83
C1 Sir Moses Montefiore 5,120 5,150 30 0.6% 107 47.81
change
Thanet Rural Area
2013 MYPE
2014
MYPE number % Area (Ha)
2014 MYPE Density Total 1 Ward 7,000 7,000 0 0.3% 5,830 1.20 E1 Thanet Villages 6,980 7,010 20 0.3% 5,830 1.20 C1 Urba n ci ty a nd town E1 Rura l vi l l a ge a nd di s pers ed
Source: 2014 MYPE for wa rds , (experi menta l s ta ti s ti cs rel ea s ed 25 November 2015):Offi ce for Na ti ona l Sta ti s ti cs (ONS), © Crown Copyri ght Pres ented by Stra tegi c Bus i nes s Devel opment & Intel l i gence, Kent County Counci l
Dens i ty i s the number of pers ons per hecta re whi ch i s ca l cul a ted by di vi di ng the popul a ti on by the a rea . Al l wa rd es ti ma tes ha ve been i ndi vi dua l l y rounded to the nea res t 10 for pres enta ti on s o ma y not s um when a dded. Al l di s tri ct es ti ma tes ha ve been i ndi vi dua l l y rounded to the nea res t 100 for pres enta ti on s o ma y not s um when a dded. The Rura l Urba n Cl a s s i fi ca ti on (RUC 2011): DCLG, DEFRA, ONS, a nd the Wel s h Government
2014 Mid-year Ward level population estimates
change
Tonbridge & Malling Borough
Council
2013 MYPE
2014
MYPE number % Area (Ha)
2014 MYPE Density Total 26 Wards 123,000 124,400 1,400 1.2% 24,014 5.12 Urban population 85,140 86,070 930 0.01 8,197 10.39 Rural population 37,860 38,360 500 0.01 15,817 2.39 change
Medway Gap Urban Area
2013 MYPE
2014
MYPE number % Area (Ha)
2014 MYPE Density Total 9 Wards 45,000 45,400 400 0.8% 4,596 9.79
C1 Aylesford 4,850 4,840 -10 -0.1% 1,031 4.70
C1 Blue Bell Hill & Walderslade 3,990 4,030 40 1.0% 516 7.73
C1 Ditton 5,020 4,950 -70 -1.4% 426 11.79 C1 East Malling 5,170 5,220 50 0.9% 734 7.04 C1 Larkfield North 5,100 5,180 70 1.4% 269 18.97 C1 Larkfield South 4,050 4,140 90 2.2% 85 47.62 C1 Snodland East 4,420 4,410 -10 -0.1% 209 21.14 C1 Snodland West 6,280 6,410 140 2.2% 671 9.35
C1 West Malling & Leybourne 6,110 6,170 70 1.1% 655 9.33
change
Tonbridge Urban Area
2013 MYPE
2014
MYPE number % Area (Ha)
2014 MYPE Density Total 8 Wards 40,200 40,700 600 1.4% 3,601 11.15 C1 Cage Green 4,340 4,400 60 1.4% 209 20.78 C1 Castle 5,480 5,530 50 0.9% 290 18.90 C1 Higham 5,980 6,030 60 1.0% 447 13.37 C1 Hildenborough 4,950 5,010 60 1.2% 1,700 2.91 C1 Judd 4,790 4,840 40 0.9% 389 12.32 C1 Medway 5,410 5,500 100 1.8% 335 16.14 C1 Trench 4,120 4,170 50 1.1% 85 48.48 C1 Vauxhall 5,080 5,230 150 2.9% 146 34.82 change
Tonbridge & Malling Rural Area
2013 MYPE
2014
MYPE number % Area (Ha)
2014 MYPE Density Total 9 Wards 37,900 38,400 500 1.3% 15,817 2.39
D1 Borough Green & Long Mill 6,960 7,050 90 1.3% 2,784 2.50
D1 Burham, Eccles & Wouldham 4,430 4,480 50 1.1% 1,499 2.96
E1 Downs 3,560 3,580 20 0.5% 3,554 1.00
D1 East Peckham & Golden Green 3,890 3,880 -10 -0.3% 1,919 2.03
D1 Hadlow, Mereworth & West Peckham 4,520 4,530 10 0.2% 2,889 1.57
E1 Ightham 2,030 2,040 10 0.5% 924 2.20
D1 Kings Hill 8,460 8,790 330 3.9% 332 25.47
D1 Wateringbury 2,120 2,120 0 0.1% 540 3.93
D1 Wrotham 1,880 1,890 0 0.2% 1,376 1.37
C1 Urba n ci ty a nd town D1 Rura l town a nd fri nge E1 Rura l vi l l a ge a nd di s pers ed
Source: 2014 MYPE for wa rds , (experi menta l s ta ti s ti cs rel ea s ed 25 November 2015):Offi ce for Na ti ona l Sta ti s ti cs (ONS), © Crown Copyri ght Pres ented by Stra tegi c Bus i nes s Devel opment & Intel l i gence, Kent County Counci l
Dens i ty i s the number of pers ons per hecta re whi ch i s ca l cul a ted by di vi di ng the popul a ti on by the a rea . Al l wa rd es ti ma tes ha ve been i ndi vi dua l l y rounded to the nea res t 10 for pres enta ti on s o ma y not s um when a dded. Al l di s tri ct es ti ma tes ha ve been i ndi vi dua l l y rounded to the nea res t 100 for pres enta ti on s o ma y not s um when a dded. The Rura l Urba n Cl a s s i fi ca ti on (RUC 2011): DCLG, DEFRA, ONS, a nd the Wel s h Government
2014 Mid-year Ward level population estimates
changeTunbridge Wells Borough
Council
2013 MYPE
2014
MYPE number % Area (Ha)
2014 MYPE Density Total 20 Wards 115,700 116,100 400 0.4% 33,133 3.49 Urban population 72,140 72,690 560 0.01 5,596 12.89 Rural population 43,560 43,410 -140 0.00 27,534 1.58 change
Tunbridge Wells/Southborough Urban Area 2013 MYPE
2014
MYPE number % Area (Ha)
2014 MYPE Density Total 11 Wards 72,100 72,700 600 0.8% 5,596 12.89
C1 Broadwater 4,460 4,530 70 1.5% 294 15.16
C1 Culverden 8,360 8,520 150 1.8% 184 45.46
C1 Pantiles & St Mark's 6,890 6,960 70 0.9% 228 30.22
C1 Park 7,440 7,550 100 1.4% 790 9.42
C1 Rusthall 5,190 5,200 10 0.2% 172 30.20
C1 St James' 6,550 6,800 240 3.7% 81 80.88
C1 St John's 7,690 7,630 -70 -0.9% 255 30.17
C1 Sherwood 7,160 7,060 -100 -1.4% 419 17.10
C1 Southborough & High Brooms 7,860 7,850 -10 -0.2% 242 32.50
C1 Southborough North 4,320 4,330 10 0.2% 490 8.82
C1 Speldhurst & Bidborough 6,190 6,270 80 1.3% 2,441 2.54
change
Benenden & Cranbrook Rural Settlement 2013 MYPE
2014
MYPE number % Area (Ha)
2014 MYPE Density Total 1 Ward 7,700 7,700 0 -0.3% 5,409 1.43
D1 Benenden & Cranbrook 7,720 7,700 -20 -0.3% 5,409 1.43
change
Paddock Wood Rural Settlement
2013 MYPE
2014
MYPE number % Area (Ha)
2014 MYPE Density Total 2 Wards 8,400 8,300 -100 -1.2% 982 8.54
D1 Paddock Wood East 4,270 4,230 -40 -0.9% 690 6.19
D1 Paddock Wood West 4,120 4,060 -60 -1.5% 292 14.11
change
Pembury Rural Settlement
2013 MYPE
2014
MYPE number % Area (Ha)
2014 MYPE Density Total 1 Ward 6,100 6,100 0 0.2% 1,434 4.28
D1 Pembury 6,140 6,150 10 0.2% 1,434 4.28
change
Tunbridge Wells Rural Area
2013 MYPE
2014
MYPE number % Area (Ha)
2014 MYPE Density Total 5 Wards 21,300 21,300 0 -0.2% 19,709 1.08
E1 Brenchley & Horsmonden 5,440 5,400 -50 -0.8% 4,197 1.30
E1 Capel 2,450 2,420 -30 -1.4% 2,115 1.16
E1 Frittenden & Sissinghurst 2,120 2,120 0 0.0% 2,917 0.73
E1 Goudhurst & Lamberhurst 4,980 4,990 10 0.2% 6,058 0.82
D1 Hawkhurst & Sandhurst 6,330 6,360 40 0.6% 4,422 1.43
C1 Urba n ci ty a nd town D1 Rura l town a nd fri nge E1 Rura l vi l l a ge a nd di s pers ed
Source: 2014 MYPE for wa rds , (experi menta l s ta ti s ti cs rel ea s ed 25 November 2015):Offi ce for Na ti ona l Sta ti s ti cs (ONS), © Crown Copyri ght Pres ented by Stra tegi c Bus i nes s Devel opment & Intel l i gence, Kent County Counci l
Dens i ty i s the number of pers ons per hecta re whi ch i s ca l cul a ted by di vi di ng the popul a ti on by the a rea .
Al l wa rd es ti ma tes ha ve been i ndi vi dua l l y rounded to the nea res t 10 for pres enta ti on s o ma y not s um when a dded. Al l di s tri ct es ti ma tes ha ve been i ndi vi dua l l y rounded to the nea res t 100 for pres enta ti on s o ma y not s um when a dded. The Rura l Urba n Cl a s s i fi ca ti on (RUC 2011): DCLG, DEFRA, ONS, a nd the Wel s h Government
2014 Mid-year Ward level population estimates
change
Medway Unitary Authority
2013 MYPE
2014
MYPE number % Area (Ha)
2014 MYPE Density Total 22 Wards 271,100 274,000 2,900 1.1% 19,203 14.12 Urban population 237,370 239,930 2,560 0.01 6,679 35.54 Rural population 33,740 34,090 350 0.01 12,525 2.69 change Chatham 2013 MYPE 2014
MYPE number % Area (Ha)
2014 MYPE Density Total 7 Wards 85,300 86,600 1,300 1.5% 2,310 36.91
C1 Chatham Central 17,330 17,710 370 2.2% 213 81.38
C1 Luton & Wayfield 15,100 15,410 310 2.0% 274 55.12
C1 River 10,670 10,910 240 2.2% 489 21.82
Inner Chatham sub-total 43,100 44,000 900 2.1% 976 44.17
C1 Lordswood & Capstone 9,170 9,300 130 1.4% 560 16.37
C1 Princes Park 10,580 10,560 -20 -0.2% 200 52.92
C1 Rochester South & Horsted 12,790 13,000 210 1.6% 381 33.56
C1 Walderslade 9,620 9,680 60 0.6% 193 49.83
Outer Chatham sub-total 42,200 42,500 400 0.9% 1,334 31.60
*River ward straddles Rochester and Chatham but is included entirely within Chatham
change Gillingham
2013 MYPE
2014
MYPE number % Area (Ha)
2014 MYPE Density Total 3 Wards 45,200 45,700 500 1.0% 732 61.80 C1 Gillingham North 18,660 19,070 410 2.2% 288 64.78 C1 Gillingham South 17,150 17,200 50 0.3% 194 88.40 C1 Watling 9,430 9,430 0 -0.0% 250 37.70 change Rochester 2013 MYPE 2014
MYPE number % Area (Ha)
2014 MYPE Density Total 2 Wards 21,700 22,000 200 1.1% 742 29.29 C1 Rochester East 10,500 10,630 130 1.2% 139 75.53 C1 Rochester West 11,240 11,350 110 1.0% 603 18.64 change Strood 2013 MYPE 2014
MYPE number % Area (Ha)
2014 MYPE Density Total 2 Wards 29,500 29,800 300 1.0% 682 43.33 C1 Strood North 13,900 13,950 50 0.4% 294 47.27 C1 Strood South 15,650 15,890 240 1.5% 388 40.34 change Rainham 2013 MYPE 2014
MYPE number % Area (Ha)
2014 MYPE Density Total 5 Wards 55,600 55,900 300 0.5% 2,213 25.12
C1 Hempstead & Wigmore 8,070 8,060 -10 -0.1% 411 19.63
C1 Rainham Central 12,260 12,360 100 0.8% 332 36.92
C1 Rainham North 8,760 8,800 40 0.4% 610 14.36
C1 Rainham South 13,270 13,300 30 0.3% 563 23.56
C1 Twydall 13,230 13,350 110 0.8% 297 44.56
change
Medway Unitary Authority Rural Area
2013 MYPE
2014
MYPE number % Area (Ha)
2014 MYPE Density Total 3 Wards 33,700 34,100 300 1.0% 12,525 2.69
D1 Cuxton & Halling 5,550 5,580 40 0.7% 1,514 3.66
D1 Peninsula 14,140 14,280 140 1.0% 7,486 1.89
D1 Strood Rural 14,050 14,220 170 1.2% 3,525 3.99
C1 Urba n ci ty a nd town D1 Rura l town a nd fri nge E1 Rura l vi l l a ge a nd di s pers ed
Source: 2014 MYPE for wa rds , (experi menta l s ta ti s ti cs rel ea s ed 25 November 2015):Offi ce for Na ti ona l Sta ti s ti cs (ONS), © Crown Copyri ght Pres ented by Stra tegi c Bus i nes s Devel opment & Intel l i gence, Kent County Counci l
Dens i ty i s the number of pers ons per hecta re whi ch i s ca l cul a ted by di vi di ng the popul a ti on by the a rea .