Open Access
Analytic Perspective
A demonstration of modeling count data with an application to
physical activity
Donald J Slymen*
1, Guadalupe X Ayala
1, Elva M Arredondo
2and
John P Elder
2Address: 1Graduate School of Public Health, San Diego State University, 5500 Campanile Dr., San Diego, CA 92182, USA and 2San Diego State University, Center for Behavioral and Community Health Studies, 9245 Sky Park Ct., Suite 221, San Diego, CA 92123, USA
Email: Donald J Slymen* - [email protected]; Guadalupe X Ayala - [email protected]; Elva M Arredondo - [email protected]; John P Elder - [email protected] * Corresponding author
Abstract
Counting outcomes such as days of physical activity or servings of fruits and vegetables often have distributions that are highly skewed toward the right with a preponderance of zeros, posing analytical challenges. This paper demonstrates how such outcomes may be analyzed with several modifications to Poisson regression.
Five regression models 1) Poisson, 2) overdispersed Poisson, 3) negative binomial, 4) zero-inflated Poisson (ZIP), and 5) zero-inflated negative binomial (ZINB) are fitted to data assessing predictors of vigorous physical activity (VPA) among Latina women. The models are described, and analytical and graphical approaches are discussed to aid in model selection.
Poisson regression provided a poor fit where 82% of the subjects reported no days of VPA. The fit improved considerably with the negative binomial and ZIP models. There was little difference in fit between the ZIP and ZINB models. Overall, the ZIP model fit best. No days of VPA were associated with poorer self-reported health and less assimilation to Anglo culture, and marginally associated with increasing BMI. The intensity portion of the model suggested that increasing days of VPA were associated with more education, and marginally associated with increasing age. These underutilized models provide useful approaches for handling counting outcomes.
Introduction
Counting outcomes are often characterized by a large pro-portion of values at zero with the remaining values highly skewed toward the right. This type of distribution may occur in physical activity measures in which number of days of physical activity may be of interest, nutritional measures assessing, for example, the number of servings of fruits and vegetables, or health services describing the number of doctor or hospital visits. Since counting
out-comes do not meet the usual normality assumption required of many standard statistical tests, analysts have relied on a transformation to induce normality, which often does not work, or categorization of the outcome which may result in loss of information. An alternative is to assume a Poisson distribution which is better suited to counting processes. Software for Poisson regression is readily available and this technique is becoming more widely used in many fields of research. However, a
neces-Published: 21 March 2006
Epidemiologic Perspectives & Innovations2006, 3:3 doi:10.1186/1742-5573-3-3
Received: 14 June 2005 Accepted: 21 March 2006 This article is available from: http://www.epi-perspectives.com/content/3/1/3
© 2006Slymen et al; licensee BioMed Central Ltd.
This is an Open Access article distributed under the terms of the Creative Commons Attribution License (http://creativecommons.org/licenses/by/2.0), which permits unrestricted use, distribution, and reproduction in any medium, provided the original work is properly cited.
sary condition of the Poisson distribution is that the expected value is equal to the variance. Many counting outcomes exhibit more variability than the nominal vari-ance under the Poisson model, a condition called over-dispersion. The consequences can be severe if over-disper-sion is not addressed. Confidence intervals for regresover-disper-sion estimates may be too narrow and tests of association may yield p-values that are too small. Modifications to the Poisson model have been proposed both to account for over-dispersion and to understand better the underlying process which leads to such a highly skewed distribution. These techniques have been used in the social science lit-erature [1,2] and, to some extent, in health services research [e.g. [3]]. However, few examples are available in public health and clinical research. Some recent examples include a study to examine early child growth and devel-opment [4], the use of male condoms in a behavioral intervention study [5], an epidemiologic study of risk fac-tors for severe hypoglycemia where the outcome was number of episodes over a 9-year period [6], modeling the relationship between number of dental caries and socioe-conomic status [7], and a series of articles on motor vehi-cle crashes [8-10]. A closely related problem is continuous outcomes with a high proportion (or clumping) of zeros [11,12]. Chang and Pocock [13] describe two approaches for analyzing such data based on 1) categorizing the out-come and fitting a proportional odds model or 2) mode-ling the probability of a zero response using logistic regression and then least squares linear regression for the non-zero part. Modifications to the Poisson distribution have also been proposed in other applications, for exam-ple, estimating confidence intervals for incidence rates where the case count may be inflated due to false positives [14]. In the current paper, the outcome is a counting proc-ess where linear regrproc-ession would not be appropriate and where the conceptual framework concerning the prepon-derance of zeros is explored. We will provide examples of modifications to the Poisson and apply them to a study assessing predictors of vigorous physical activity (VPA) at baseline among Latina women participating in a rand-omized nutrition intervention trial.
Analysis
Physical activity example
The data presented in this example were gathered as part of a baseline measurement from a randomized commu-nity trial. The NIH-funded trial, Secretos de la Buena Vida, examines the effectiveness of two innovative communica-tion approaches to improving the nutricommunica-tional health of adult Latinas/Hispanics by contrasting these participants to those in a "usual care" control group. Adult women were recruited via random digit dialing from the Central and Southern regions of San Diego County based on a list of phone numbers purchased according to region using zip codes and with a Hispanic surname on the account. To
be eligible for the study, the household must have included a woman whose dominant language was Span-ish and was between 18 and 65 (inclusive) years of age.
The data were collected during face-to-face home-based interviews with 357 female participants. Women who agreed to participate were measured at baseline and then randomly assigned to one of three conditions: promotora plus tailored print material delivered via mail condition
(promotora); mailed tailored print only (tailored); and a
control condition (control; off the shelf Latino targeted materials, also delivered via mail). Women in the
promo-tora condition received weekly home visits or telephone
calls from promotoras (lay health advisors in the Latino community) over a 12-week period plus 12 weekly tai-lored newsletters with activity inserts mailed to the partic-ipant's home. The tailored condition received tailored newsletters and activity inserts created especially for the woman using information provided by the participant at baseline. The control group was mailed "off the shelf" materials covering the same content areas as those in the
promotora and tailored conditions.
The primary outcome variables for this study were percent calories from fat and number of grams of fiber. The Nutri-tion Data System (NDS) 24-hour dietary recall interview, developed by the Nutrition Coordinating Center (NCC) of the University of Minnesota, was used at each measure-ment to assess dietary consumption patterns. This longi-tudinal research study included 4 repeated assessments over an 18-month period. Details of the study design and procedure may be found elsewhere [15].
As part of the baseline questionnaire several questions were asked concerning physical activity and regular exer-cise. In particular, the following information and ques-tion were presented:
"Vigorous physical activities usually make you breathe hard or feel tired most of the time. Examples of vigorous activities include: jogging, fast dancing, soccer, fast swim-ming, fast biking, and Stairmaster. How many days in a typical week do you do vigorous physical activities for 20 minutes or more?"
A literature search [16-26] was carried out to determine appropriate predictors of physical activity for this demon-stration. The selected variables are shown in Table 1. Per-taining to body mass index, weight was measured three times to the nearest pound using a Health-o-Meter stand-ard scale and height was measured three times to the near-est 1/4 inch, using a standard portable stadiometer with shoes removed. Mean weight and height scores were com-puted based on the three measurements. BMI was calcu-lated using the Quetelet index (kg/m2), which is
considered both a convenient and reliable indicator of overweight and obesity [27].
Acculturation was measured using a score derived from the 30-item Acculturation Rating Scale for Mexican-Amer-icans-II (ARSMA-II) [28]. This scale measures frequency of using the English and Spanish languages, frequency of accessing English and Spanish media (TV, movies, music, books, newspapers), frequency of interacting with Mexi-cans and Anglos now and as a child, and ethnic identity of self and parents. Separate scores are obtained representing 1) Mexican orientation or the frequency with which she
speaks Spanish, watched Spanish-language television, and identifies as a Mexican and 2) Anglo orientation or the fre-quency with which she spoke English, watched English-language television and identified as an American or Mex-ican-American. The acculturation score is obtained as the difference between the two scores (Anglo minus Mexican orientation). Thus, a negative score represents a Mexican orientation and a positive score an Anglo orientation.
Although the literature also identified income as a predic-tor of physical activity, we found that it was very highly associated with education in our sample and income level
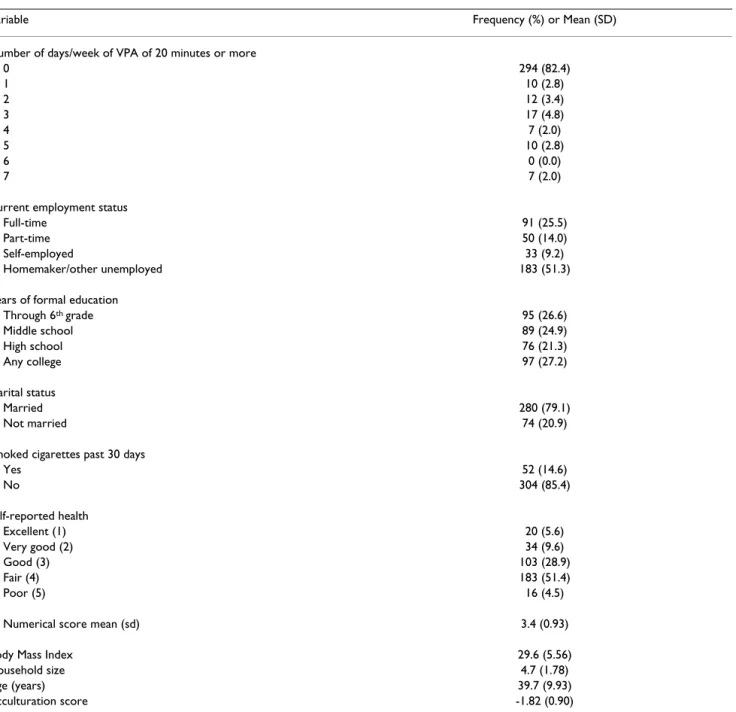
Table 1: Descriptive Statistics for Number of days of VPA and Predictor Variables
Variable Frequency (%) or Mean (SD) Number of days/week of VPA of 20 minutes or more
0 294 (82.4) 1 10 (2.8) 2 12 (3.4) 3 17 (4.8) 4 7 (2.0) 5 10 (2.8) 6 0 (0.0) 7 7 (2.0)
Current employment status
Full-time 91 (25.5)
Part-time 50 (14.0)
Self-employed 33 (9.2)
Homemaker/other unemployed 183 (51.3) Years of formal education
Through 6th grade 95 (26.6) Middle school 89 (24.9) High school 76 (21.3) Any college 97 (27.2) Marital status Married 280 (79.1) Not married 74 (20.9)
Smoked cigarettes past 30 days
Yes 52 (14.6) No 304 (85.4) Self-reported health Excellent (1) 20 (5.6) Very good (2) 34 (9.6) Good (3) 103 (28.9) Fair (4) 183 (51.4) Poor (5) 16 (4.5)
Numerical score mean (sd) 3.4 (0.93) Body Mass Index 29.6 (5.56) Household size 4.7 (1.78)
Age (years) 39.7 (9.93)
was missing on 19 subjects. Therefore, we decided to exclude income and use education status.
Statistical models
Let yi represent the count for the ith subject. Let x
i be a
vec-tor of covariates and β a vector of regression coefficients to be estimated. The Poisson regression model may be repre-sented as:
where µi = exp(xi' β). The expected value of yi given xi is µi. The variance of yi is also µi.
Although Poisson regression is often used for counting outcomes, the observed counts often exhibit more varia-bility than what is predicted by the Poisson, a condition called over-dispersion. This leads to underestimation of the standard errors of the regression estimates, confidence intervals that are too narrow, and p-values that are too small. In some cases, the underestimation can be very severe. The extra variation can be measured by a disper-sion or scale parameter. The parameter may be estimated by dividing a goodness-of-fit statistic by the residual degrees of freedom [29]. The parameter estimate is rou-tinely included in the output of computer software for Poisson regression [e.g. [30], p. 360]. If the estimate is greater than 1, there is evidence of over-dispersion. The estimate may then be used as a scaling factor, multiplying the estimated covariance matrix of β by this quantity. This serves to "inflate" the standard errors with confidence intervals wider and p-values larger than what is obtained under the Poisson without adjustment for over-disper-sion.
Another approach to managing over-dispersion within the framework of Poisson regression is to use a general-ized estimating equation (GEE) approach [[30], pp 542– 7]. Over-dispersion may be thought of as misspecification of the covariance structure, one that is not appropriate for Poisson regression. Rather than use the model-based cov-ariance estimate, GEE uses a robust estimate that is based on a subject-to-subject measure for estimating variances. Stokes et al provide an example of its use.
Gardner et al. [29] suggest that using an inflation tech-nique to handle over-dispersion may be adequate if the intent of the analysis is to test hypotheses about the regression coefficients. If one of the objectives is to esti-mate probabilities for individual counts, then alternative models should be explored.
It may be worthwhile to consider the mechanism by which the over-dispersion occurs and use a more flexible regression model. Even after taking into account the
cov-ariate information, there may be unexplained variability among subjects, possibly a result of unobserved predic-tors. The mean µi may be replaced by
µi* = exp(xi' β+ εi) where εi represents random error. Now, subjects with the same observed xi do not share the same
µi due to the unobserved heterogeneity. This modification
to the Poisson regression yields a more flexible regression model, the negative binomial:
where θ represents the degree of over-dispersion. The mean is µi, the same as the Poisson, but the variance is
µi(1 + θµi) thus allowing the variance to exceed µi . As θ approaches 0, the negative binomial approaches the Pois-son. If both models are fitted, a likelihood ratio test may be used to compare them. Alternatively, score tests have been developed which require only fitting the Poisson regression model [31,32].
Another approach is to consider the excess of zeros by hypothesizing that there are two groups contributing to the amount. Within the context of vigorous physical activ-ity, there is a subpopulation of subjects who never engage in any vigorous physical activity and are not contemplat-ing any change in behavior. The second group reports no vigorous physical activity but are more amenable and have the potential to increase their physical activity; they simply have not yet reached a reporting threshold beyond zero. Thus, they are part of a Poisson process which includes a portion of zeros but models an increasing involvement in vigorous physical activity. The first group is not part of this process.
Lambert [33] proposed a zero-inflated Poisson (ZIP) model:
where pi is the probability of being an extra zero. In the ZIP model pi is determined, typically, by either a logistic or a probit model, g(zi'γ). And µi is again modeled as exp(xi'β). The x's and z's may represent the same set of covariates or be different sets. Substituting the negative binomial for the Poisson yields the zero-inflated negative binomial (ZINB) model.
This study examines and compares the Poisson, over-dis-persed Poisson, negative binomial, ZIP and ZINB regres-sion models. Pr(yi|xi)=exp(−µ µi) iyi/yi! Pr( | ) ( / ) ( / ) / / y y y i i i i i i i x = + + + Γ Γ 1 1 1 1 1 1 θ θ θµ µ θ µ θ yi Pr( | ) ( )exp( ) ( )exp( ) / ! y p p for y p y i i i i i i i i iyi i x = + − − = − − 1 0 1 µ µ µ for yi ≥1
Model comparisons
As mentioned earlier, a likelihood ratio test may be con-structed to compare the Poisson to the negative binomial since the Poisson is nested within the negative binomial. This is a test of θ= 0 and follows a chi-square distribution with 1 degree of freedom. Similarly, the ZIP model is nested within the ZINB. Comparisons of the Poisson with the ZIP and the negative binomial with the ZINB involve nonnested comparisons. A common approach to model selection in such instances is to use the Akaike Informa-tion Criterion (AIC) where the model chosen minimizes the criterion [34]. The AIC is available in many computer packages. In addition we plot the observed minus pre-dicted probabilities from each model to obtain graphical illustrations of fit. The predicted probabilities are con-structed using the approach in Long [[1], p. 228] and are adjusted for all covariates.
All models are fitted using SAS version 8.1 [35]. The Pois-son, over-dispersed PoisPois-son, and negative binomial are fitted using the GENMOD procedure. The ZIP and ZINB models are fitted with the NLMIXED procedure. However, packages such as STATA [36] and LIMDEP [37] also have specific programs for fitting such models.
Results
Table 1 displays the frequency distribution for number of days of VPA. Of the 357 women, 294 (82.4%) report no days of VPA. For days 1 to 3 the percentages range from 2.8% to 4.8%, dropping off to 0% to 2.8% for days 4 to 7. Although it may be convenient to simply lump days 1 to 7 together and dichotomize the outcome as 'none versus
any VPA, there is useful information in retaining the intensity portion of the response. Clearly, a transforma-tion to induce normality with such positively skewed data is not feasible.
The selected predictor variables are also shown in Table 1. For current employment status, over 50% are classified as "homemaker/other unemployed". However, all but 13 of the 183 responses represent "homemaker". The remain-der consists of "student" (2), "retired" (1) and "unable to work" (10), all reflecting non-employment categories. Years of formal education are evenly distributed across the four categories. The sample is predominantly married (79.1%), does not engage in smoking on a regular basis (85.4%) and has fair to good self-reported health (80.3%). For purposes of analysis, self-reported health is treated as a continuous variable. The mean age is nearly 40 years old. The mean body mass index (29.6 kg/m2)
suggests the sample is borderline obese (BMI ≥ 30.0 kg/ m2). The mean acculturation score of -1.82 indicates the
sample tends to be oriented toward the Mexican culture.
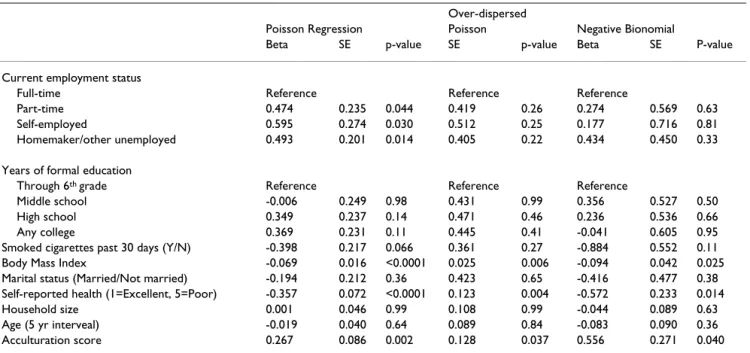
Poisson regression was fitted to the data using the GEN-MOD procedure of SAS. The ratio of the deviance to its degrees of freedom (df) is 1.99 and the ratio of the Pear-son chi-square to df is 3.27, both indicating over-disper-sion. The negative binomial regression model was fitted and yielded a log-likelihood of -282.8. The likelihood ratio test comparing the negative binomial to the Poisson, which tests H0: θ= 0, yields a statistic of 277.4. The esti-mate of θis 6.94 (SE = 1.33). The negative binomial is favored over the Poisson. Table 2 displays the regression
Table 2: Poisson, Over-dispersed Poisson using GEE, and Negative Binomial Models for Number of Days of VPA
Over-dispersed
Poisson Regression Poisson Negative Bionomial
Beta SE p-value SE p-value Beta SE P-value Current employment status
Full-time Reference Reference Reference
Part-time 0.474 0.235 0.044 0.419 0.26 0.274 0.569 0.63 Self-employed 0.595 0.274 0.030 0.512 0.25 0.177 0.716 0.81 Homemaker/other unemployed 0.493 0.201 0.014 0.405 0.22 0.434 0.450 0.33 Years of formal education
Through 6th grade Reference Reference Reference
Middle school -0.006 0.249 0.98 0.431 0.99 0.356 0.527 0.50 High school 0.349 0.237 0.14 0.471 0.46 0.236 0.536 0.66 Any college 0.369 0.231 0.11 0.445 0.41 -0.041 0.605 0.95 Smoked cigarettes past 30 days (Y/N) -0.398 0.217 0.066 0.361 0.27 -0.884 0.552 0.11 Body Mass Index -0.069 0.016 <0.0001 0.025 0.006 -0.094 0.042 0.025 Marital status (Married/Not married) -0.194 0.212 0.36 0.423 0.65 -0.416 0.477 0.38 Self-reported health (1=Excellent, 5=Poor) -0.357 0.072 <0.0001 0.123 0.004 -0.572 0.233 0.014 Household size 0.001 0.046 0.99 0.108 0.99 -0.044 0.089 0.63 Age (5 yr interveal) -0.019 0.040 0.64 0.089 0.84 -0.083 0.090 0.36 Acculturation score 0.267 0.086 0.002 0.128 0.037 0.556 0.271 0.040
and standard error estimates and p-values for the Poisson, over-dispersed corrected Poisson using GEE and the nega-tive binomial regression. The over-dispersion adjustment affects only the standard errors, not the regression esti-mates. Note that the Poisson standard errors tend to be nearly half the size of the GEE-corrected standard errors leading to considerably (and incorrect) smaller p-values. The negative binomial compared to the Poisson affects both the regression and standard error estimates. Although the GEE-corrected results and negative binomial produce somewhat different regression estimates, both identify BMI, self-reported health and acculturation score as associated with VPA (p < 0.05).
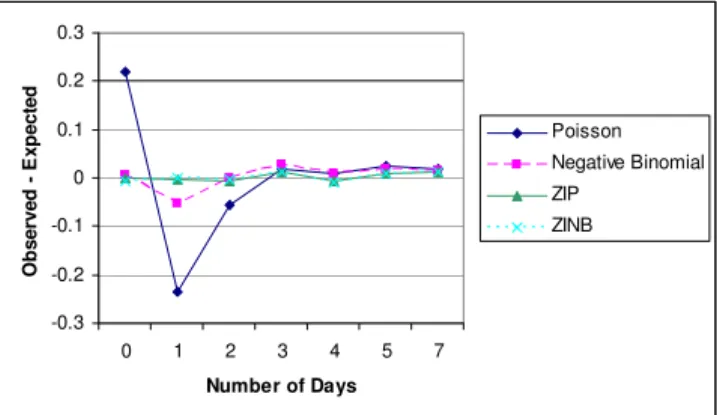
Next, the ZIP and ZINB models were fitted using the NLMIXED procedure of SAS. There is virtually no differ-ence in their log-likelihoods (Table 3) indicating that the ZINB model did not improve the fit over the ZIP model. The over-dispersion parameter estimate is 0.0062 (SE = 0.106). As expected based on these results, the parameter estimates and standard errors of the estimates are nearly identical. The AIC's in Table 3 indicate a strong preference of the ZIP over the Poisson model and the ZINB over the negative binomial model. Overall, the AIC criterion favors the ZIP model. Finally, Figure 1 plots the observed pro-portion minus the mean probability at each count for each of the four models. It is clear that the Poisson pro-vides the worst fit. At 0 days the observed proportion is 0.2 higher than the expected; at 1 day, the reverse occurs. This is not surprising since the Poisson is unable to account for the large proportion of zeros. While the nega-tive binomial is a substantial improvement over the Pois-son, at 1 day there is some overestimation of the proportion. The ZIP and ZINB models are virtually indis-tinguishable on the plot and both fit the data quite well. Based on the formal tests and the figure, the ZIP model would appear to be the best fit. It provides the same fit as the ZINB, but is a somewhat simpler model and has a slightly smaller AIC.
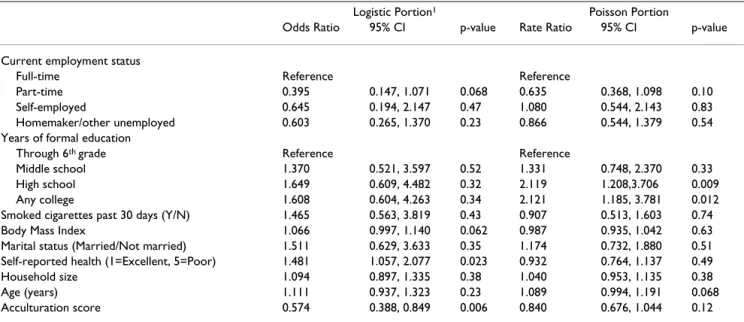
Table 4 displays the results for the ZIP model. The odds ratios and rate ratios are reported rather than the regres-sion estimates consistent with how information from logistic regression and Poisson regression are typically
reported. The logistic portion is based on the probability of zero days of vigorous physical activity. Poorer self-reported health is related (p = 0.023) to no vigorous phys-ical activity. The odds of no VPA are estimated to increase by nearly 50% (OR = 1.48, 95% CI: 1.06, 2.08) for each increasing step towards poorer self-reported health. A decreasing acculturation score is related (p = 0.006) to no VPA. This means that no vigorous physical activity is asso-ciated with less assimilation to the Anglo culture (OR = 0.57, 95% CI: 0.39, 0.85). We also find that an increase in body mass index is marginally associated (p = 0.062) with no vigorous physical activity with a 7% increase in odds (OR = 1.07, 95% CI: 0.99, 1.14) for every one kg/m2
increase in BMI.
For the Poisson portion, education is related to VPA. The rate of activity is two-fold higher (RR = 2.12) when com-paring either a high school education (95% CI: 1.21, 3.71) or any college (95% CI: 1.19, 3.78) to 6th grade or
less. In addition, age is marginally related (p = 0.068) to increasing VPA; every 5-year increase in age increases the rate by 9% (RR = 1.09, 95% CI: 0.99, 1.19).
Conclusion
Although Poisson regression is cited as a recommended approach for analyzing count data, it often does not fit the data very well. The extra variability may be handled using modifications to the Poisson such as those described in this paper. These models may be especially useful in many epidemiological applications involving physical activity, nutrition and health services outcomes. Although analysts might consider categorizing such a skewed outcome, there are advantages to maintaining a continuous response. Software is readily available to fit these models in such packages as SAS, STATA and LIMDEP. The purpose of this article was to bring their utility to the attention of a wider audience in epidemiology.
Observed minus expected probabilities for four models Figure 1
Observed minus expected probabilities for four models. -0.3 -0.2 -0.1 0 0.1 0.2 0.3 0 1 2 3 4 5 7 Number of Days O b ser ve d E xp ect ed Poisson Negative Binomial ZIP ZINB Table 3: Model Fit Characteristics: Log-likelihood and Akaike's
Information Criterion
Model Log-likelihood AIC Poisson - 421.5 871.1 Negative binomial - 282.8 595.6 Zero-inflated Poisson - 253.3 562.5 Zero-inflated negative binomial - 253.5 565.0
In this example using VPA, the observed frequency of zeros was larger than expected under the Poisson regres-sion. Our choices included inflating the standard error using a technique such as GEE, or modeling the data spe-cifically based on an underlying framework provided by the negative binomial, ZIP or ZINB models. We found that the ZIP model yielded the best fit and may provide an interesting process in which to consider the reasons behind the preponderance of zeros.
In this study, we found that 82.4% of the subjects reported no days of physical activity. These findings are consistent with previous literature [38-40]. Evenson et al. [38] con-ducted face-to-face Spanish interviews with a convenience sample of 671 Latina immigrants and found that only 16.8% met VPA recommendations (≥ 20 minutes' dura-tion for at least three days per week). We found that no VPA was associated with poorer levels of self-reported health and a decreasing acculturation score indicating less assimilation to the Anglo culture. It was marginally asso-ciated with increasing BMI. Increasing intensity of VPA was related to higher levels of education and marginally related to increasing age. Comparisons with existing find-ings are difficult to make given differences in physical activity outcomes. Nevertheless, some comparisons can be made.
Our findings regarding acculturation are consistent with other research indicating less physical activity with less acculturation. For example, in the NHANES study, Crespo et al [23] found that Mexican-Americans who preferred the Spanish language were less likely to report any leisure-time physical activity. Similarly, Cantero et al [41]
indi-cated that more acculturated Latinas were more likely to exercise regularly. Results on the association between edu-cation and physical activity, and weight status and physi-cal activity are also supported by previous research findings [17,22]. Qualitative data indicate that Latinas who exercised reported better health status, a result that is in agreement with the association observed in our study [19]. Eyler et al [39] compared correlates of physical activ-ity among women aged 20–50 years from diverse racial/ ethnic groups and found Latinas who rated their health as excellent were more likely to engage in vigorous physical activity (3–7 days/week for 20 minutes at a time) com-pared to those who rated their health as fair/poor. The findings on age in the current study seem to conflict with the existing literature. Most reports suggest that younger Latinas are more likely to engage in physical activity [e.g. [39]]. Overall, these data support the need for ongoing efforts to target physical activity interventions to less acculturated Latinas to prevent continued weight gain and improve well-being.
We must be cautious about accepting the ZIP model strictly on the basis of model fitting alone and, therefore, accepting as proof the idea of two subpopulations at zero [1,4]. Nevertheless, it would seem reasonable that a por-tion of women are not able to engage in VPA either due to a health condition or other obstacles not captured by cov-ariates that make it impossible to participate in such activ-ities. Whereas, there are other women reporting no VPA who could engage in such activities but choose not to, or engage in VPA but to such a limited extent that zero days are reported and represent one extreme of VPA intensity.
Table 4: Zero-inflated Poisson Model for Number of Days of VPA
Logistic Portion1 Poisson Portion
Odds Ratio 95% CI p-value Rate Ratio 95% CI p-value Current employment status
Full-time Reference Reference
Part-time 0.395 0.147, 1.071 0.068 0.635 0.368, 1.098 0.10 Self-employed 0.645 0.194, 2.147 0.47 1.080 0.544, 2.143 0.83 Homemaker/other unemployed 0.603 0.265, 1.370 0.23 0.866 0.544, 1.379 0.54 Years of formal education
Through 6th grade Reference Reference
Middle school 1.370 0.521, 3.597 0.52 1.331 0.748, 2.370 0.33 High school 1.649 0.609, 4.482 0.32 2.119 1.208,3.706 0.009 Any college 1.608 0.604, 4.263 0.34 2.121 1.185, 3.781 0.012 Smoked cigarettes past 30 days (Y/N) 1.465 0.563, 3.819 0.43 0.907 0.513, 1.603 0.74 Body Mass Index 1.066 0.997, 1.140 0.062 0.987 0.935, 1.042 0.63 Marital status (Married/Not married) 1.511 0.629, 3.633 0.35 1.174 0.732, 1.880 0.51 Self-reported health (1=Excellent, 5=Poor) 1.481 1.057, 2.077 0.023 0.932 0.764, 1.137 0.49 Household size 1.094 0.897, 1.335 0.38 1.040 0.953, 1.135 0.38 Age (years) 1.111 0.937, 1.323 0.23 1.089 0.994, 1.191 0.068 Acculturation score 0.574 0.388, 0.849 0.006 0.840 0.676, 1.044 0.12
It is on this basis that the ZIP model may be accepted and could help to describe different profiles of women.
Although the negative binomial did not provide as good a fit as the ZIP model, it was a substantial improvement over the Poisson and might be acceptable if the two-part mechanism seems inappropriate. The negative binomial identified decreasing BMI, better levels of self-reported health and an increasing acculturation score as predictive of increasing VPA. These are the same predictors identified as part of the logistic portion of the ZIP model.
Our choice of the ZIP over the ZINB model was based on parsimony since they provided a similar fit. The ZIP model does not include the random error term that allows the conditional variance of yi to exceed the conditional mean. But the interpretations of the model regression parameters are the same for both models.
In this example of VPA, the same set of covariates were used for both the logistic part and the intensity part of the ZIP and ZINB models. This is not necessary and one may be interested in constructing a parsimonious model for each part. However, it may be more informative and make interpretation more manageable if the same set of varia-bles is included in each part.
Programs to extend Poisson and negative binomial regres-sion to clustered or longitudinal data are widely available and include the SAS GENMOD procedure using GEE and the NLMIXED procedure for mixed effects regression models. Recent work has focused on extending the ZIP. For example, Yau and Lee [42] discuss a random effects ZIP model to examine an intervention to prevent injuries in a cleaning services department of a public hospital in Australia. The outcome variable was injury count col-lected in pre- and post-intervention periods on the same subjects. Hur, Hedeker, Henderson et al [43] describe a ZIP model with random effects to analyze the number of postoperative complications within 30 days in patients who received a partial colectomy operation. The patients (n = 3501) came from 123 Veterans Affairs Medical Cent-ers. Thus, subjects are clustered within hospitals and this clustering must be accounted for in the analysis. Further development of software for ZIP models is underway.
Competing interests
The author(s) declare that they have no competing inter-ests.
Authors' contributions
DJS conceived and designed the study, carried out the sta-tistical analyses and drafted most of the manuscript. GXA participated in study design, developed the physical activ-ity example, and contributed to interpreting the results.
EMA participated in study design, contributed to develop-ing the physical activity example and interpretdevelop-ing the results. JPE participated in study design and helped draft the manuscript. All authors read and approved the final manuscript.
Acknowledgements
This research was supported by the National Cancer Institute, National Institutes of Health (grant RO1 CA 81877).
References
1. Long JS: Regression Models for Categorical and Limited Dependent Variables. Thousand Oaks, CA: Sage Publications; 1997.
2. Cameron AC, Trivedi PK: Regression Analysis of Count Data. Cambridge, UK: Cambridge University Press; 1998.
3. Kremers HM, Reinalda MS, Crowson CS, Zinsmeister AR, Hunder GG, Gabriel SE: Use of physician services in a population-based cohort of patients with polymyalgia rheumatica over the course of their disease. Arthritis & Rheumatism 2005, 53:395-403. 4. Cheung YB: Zero-inflated models for regression analysis of count data: a study of growth and development. Statistics in Medicine 2002, 21:1461-69.
5. Wong EL, Roddy RE, Tucker H, Tamoufe U, Ryan K, Ngampoua F: Use of male condoms during and after randomized, control-led trial participation in Cameroon. Sexually Transmitted Dis-eases 2005, 32:300-307.
6. Bulsara MK, Holman CDJ, Davis EA, Jones TW: Evaluating risk fac-tors associated with severe hypoglycaemia in epidemiology studies- what method should we use? Diabetic Medicine 2004, 21:914-919.
7. Lewsey JD, Thomson WM: The utility of the zero-inflated Pois-son and zero-inflated negative binomial models: a case study of cross-sectional and longitudinal DMF data examining the effect of socio-economic status. Community Dentistry and Oral Epi-demiology 2004, 32:183-9.
8. Lee AH, Stevenson MR, Wang K, Yau KKW: Modeling young driver motor vehicle crashes: data with extra zeros. Accident Analysis and Prevention 2002, 34:515-21.
9. Qin X, Ivan JN, Ravishanker N: Selecting exposure measures in crash rate prediction for two-lane highway segments. Acci-dent Analysis & Prevention 2004, 36:183-91.
10. Lord D, Washington SP, Ivan JN: Poisson, Poisson-gamma and zero-inflated regression models of motor vehicle crashes: balancing statistical fit and theory. Accident Analysis & Prevention
2005, 37:35-46.
11. Lachenbruch PA: Analysis of data with clumping at zero. Biom-etrische Zeitschrift 1976, 18:351-6.
12. Lachenbruch PA: Utility of logistic regression in epidemiologic studies of the elderly. In The Epidemiologic Study of the Elderly
Edited by: Wallace RB, Woolson RF. Oxford: Oxford University Press; 1992:371-81.
13. Chang BH, Pocock S: Analyzing data with clumping at zero: an example demonstration. Journal of Clinical Epidemiology 2000, 53:1036-43.
14. Kegler SR: Reporting incidence from a surveillance system with an operational case definition of unknown predictive value positive. Epidemiologic Perspectives & Innovation 2005, 2:7. 15. Elder JP, Ayala GX, Campbell NR, Slymen DJ, Lopez-Madurga ET,
Engelberg M: Interpersonal and print nutrition communica-tion for a Spanish-dominant Latino populacommunica-tion: Secretos de la Buena Vista. Health Psychology 2005, 24:49-57.
16. Mayer EJ, Alderman BW, Regensteiner JG, Marshall JA, Haskell WL, Baxter J, Hamman RF: Physical-activity-assessment measures compared in a biethnic rural population: the San Luis Valley Diabetes Study. Am J Clin Nutr 1991, 53(4):812-20.
17. Brownson RC, Eyler AA, King AC, Brown DR, Shyu Y-L, Sallis JF: Pat-terns and correlates of physical activity among US women 40 years and older. Am J Public Health 2000, 90(2):264-70. 18. Avila P, Hovell MF: Physical activity training for weight loss in
Latinas: a controlled trial. Int J Obesity & Related Metabolic Disor-ders 1994, 18(7):476-82.
Publish with BioMed Central and every scientist can read your work free of charge "BioMed Central will be the most significant development for disseminating the results of biomedical researc h in our lifetime."
Sir Paul Nurse, Cancer Research UK
Your research papers will be:
available free of charge to the entire biomedical community peer reviewed and published immediately upon acceptance cited in PubMed and archived on PubMed Central yours — you keep the copyright
Submit your manuscript here:
http://www.biomedcentral.com/info/publishing_adv.asp
BioMedcentral 19. Berg JA, Cromwell SL, Arnett M: Physical activity: perspectives
of Mexican American and Anglo American midlife women.
Health Care for Women Int 2002, 23(8):894-904.
20. Castro CM, Sallis JF, Hickmann SA, Lee RE, Chen AH: A prospective study of psychosocial correlates of physical activity for ethnic minority women. Psychology and Health 1999, 14:277-293. 21. Bull FC, Eyler AA, King AC, Brownson RC: Stage of readiness to
exercise in ethnically diverse women: a U.S. survey. Med & Sci in Sports & Exercise 2001, 33(7):1147-56.
22. Crespo CJ, Smit E, Andersen RE, Carter-Pokras O, Ainsworth BE: Race/ethnicity, social class and their relation to physical inac-tivity during leisure time: results from the Third National Health and Nutrition Examination Survey, 1988–1994. Am J Prev Med 2000, 18(1):46-53.
23. Crespo CJ, Smit E, Carter-Pokras O, Andersen R: Acculturation and leisure-time physical inactivity in Mexican American adults: results from NHANES III, 1988–1994. Am J Public Health
2001, 91(8):1254-7.
24. Evenson KR, Sarmiento OL, Macon ML, Tawney KW, Ammerman AS: Environmental, policy, and cultural factors related to physi-cal activity among Latina immigrants. Women & Health 2002, 36(2):43-57.
25. Fulton-Kehoe D, Hamman RF, Baxter J, Marshall J: A case-control study of physical activity and non-insulin dependent diabetes mellitus (NIDDM): the San Luis Valley Diabetes Study. Annals of Epidemiology 2001, 11(5):320-7.
26. Ransdell LB, Wells CL: Physical activity in urban white, African-American, and Mexican-American women. Med & Sci in Sports & Exercise 1998, 30(11):1608-15.
27. Garrow JS, Webster J: Quetelet's index (w/h2) as a measure of
fatness. International Journal of Obesity 1985, 9:147-53.
28. Cuellar I, Arnold B, Maldonado R: Acculturation rating scale for Mexican Americans- II: a revision of the original ARSMA scale. Hispanic Journal of Behavioral Sciences 1995, 17:275-304. 29. Gardner W, Mulvey EP, Shaw EC: Regression analyses of counts
and rates: Poisson, overdispersed Poisson, and negative binomial models. Psychological Bulletin 1995, 118:392-404. 30. Stokes ME, Davis CS, Koch GG: Categorical Data Analysis Using the SAS
System 2nd edition. Cary, NC: SAS Institute, Inc; 2000.
31. van den Brock J: A score test for zero inflation in a Poisson dis-tribution. Biometrics 1995, 51:738-43.
32. Ridout M, Hinde J, Demetrio CGB: A score test for testing a zero-inflated Poisson regression model against zero-inflated negative binomial alternatives. Biometrics 2001, 57:219-223. 33. Lambert D: Zero-inflated Poisson regression, with an
applica-tion to defects in manufacturing. Technometrics 1992, 34:1-14. 34. Akaike H: A new look at the statistical model identification.
IEEE Transactions on Automatic Control 1974, 19:716-723.
35. SAS Institute Inc.: SAS/STAT User's Guide, Version 8 Cary, NC: SAS Institute Inc; 1999.
36. StataCorp: Stata Statistical Software, Release 8.0 College Station, Texas: StataCorp; 2003.
37. Econometric Software, Inc: LIMDEP version 8.0 Plainview, N.Y.: Econo-metric Software, Inc; 2002.
38. Evenson KR, Sarmiento OL, Tawney KW, Macon ML, Ammerman AS: Personal, social, and environmental correlates of physical activity in North Carolina Latina immigrants. American Journal of Preventive Medicine 2003, 25(3S):77-85.
39. Eyler AA, Matson-Koffman D, Young DR, Wilcox S, Wilbur J, Thomp-son JL, SanderThomp-son B, EvenThomp-son KR: Quantitative study of corre-lates of physical activity in women from diverse racial/ethnic groups: The Women's Cardiovascular Health Network Project – summary and conclusions. American Journal of Preven-tive Medicine 2003, 25(3Si):93-103.
40. Hovell M, Sallis J, Hofstetter R, Barrington E, Hackley M, Elder J, Cas-tro F, Kilbourne K: Identification of correlates of physical activ-ity among Latino adults. Journal of Community Health 1991, 16(1):23-36.
41. Cantero PJ, Richardson JL, Baezconde-Garbanati L, Marks G: The association between acculturation and health practices among middle-aged and elderly Latinas. Ethnicity and Disease
1999, 9(2):166-80.
42. Yau KKW, Lee AH: Zero-inflated Poisson regression with ran-dom effects to evaluate an occupational injury prevention programme. Statistics in Medicine 2001, 20:2907-20.
43. Hur K, Hedeker D, Henderson W, Khuri S, Daley J: Modeling clus-tered count data with excess zeros in health care outcomes research. Health Services and Outcomes Research Methodology 2002, 3:5-20.