econ
stor
www.econstor.eu
Der Open-Access-Publikationsserver der ZBW – Leibniz-Informationszentrum Wirtschaft The Open Access Publication Server of the ZBW – Leibniz Information Centre for EconomicsNutzungsbedingungen:
Die ZBW räumt Ihnen als Nutzerin/Nutzer das unentgeltliche, räumlich unbeschränkte und zeitlich auf die Dauer des Schutzrechts beschränkte einfache Recht ein, das ausgewählte Werk im Rahmen der unter
→ http://www.econstor.eu/dspace/Nutzungsbedingungen nachzulesenden vollständigen Nutzungsbedingungen zu vervielfältigen, mit denen die Nutzerin/der Nutzer sich durch die erste Nutzung einverstanden erklärt.
Terms of use:
The ZBW grants you, the user, the non-exclusive right to use the selected work free of charge, territorially unrestricted and within the time limit of the term of the property rights according to the terms specified at
→ http://www.econstor.eu/dspace/Nutzungsbedingungen By the first use of the selected work the user agrees and declares to comply with these terms of use.
zbw
Leibniz-Informationszentrum Wirtschaft Leibniz Information Centre for Economics Herwartz, Helmut; Xu, FangWorking Paper
A new approach to bootstrap inference
in functional coefficient models
Economics working paper / Christian-Albrechts-Universität Kiel, Department of Economics, No. 2007,15
Provided in cooperation with:
Christian-Albrechts-Universität Kiel (CAU)
Suggested citation: Herwartz, Helmut; Xu, Fang (2007) : A new approach to bootstrap inference in functional coefficient models, Economics working paper / Christian-Albrechts-Universität Kiel, Department of Economics, No. 2007,15, http://hdl.handle.net/10419/22031
A new approach to bootstrap inference in
functional coefficient models
by Helmut Herwartz and Fang Xu
Economics Working Paper
No 2007-15
A new approach to bootstrap inference in functional
coefficient models
Helmut Herwartz
∗and Fang Xu
†June 2007
Abstract: We introduce a new, factor based bootstrap approach which is robust under heteroskedastic error terms for inference in functional coefficient models. Mod-eling the functional coefficient parametrically, the bootstrap approximation of an F
statistic is shown to hold asymptotically. In simulation studies with both parametric and nonparametric functional coefficients, factor based bootstrap inference outper-forms the wild bootstrap and pairs bootstrap approach according to its size features. Applying the functional coefficient model to a cross sectional investment regression on savings, the saving retention coefficient is found to depend on third variables as the population growth rate and the openness ratio.
Keywords: Bootstrap, heteroskedasticity, functional coefficient models, Feldstein-Horioka puzzle
JEL Classification: C12, C14
∗Institute for Statistics and Econometrics, Christian-Albrechts-University of Kiel, Olshausenstr.
40-60, D–24118 Kiel, Germany,[email protected].
†Corresponding author. Institute for Statistics and Econometrics, Christian-Albrechts-University
of Kiel, Olshausenstr. 40-60, D–24118 Kiel, Germany,[email protected]. We thank Michael H. Neumann and Simone Alfarano for helpful comments.
1
Introduction
A useful extension of the classical linear regression model are functional (varying) co-efficient models where model parameters may change with the value of other variables (factors). Functional specifications can be traced back to generalized linear models (Nelder and Wedderburn 1972). To formalize the functional coefficient, parametric representations such as finite order polynomials or Fourier expansions, or otherwise nonparametric approaches can be employed (Cleveland, Grosse and Shyu 1992, Hastie and Tibshirani 1993, Chen and Tsay 1993). A natural specification issue in these mod-els is to infer whether the functional coefficient model holds with a specified paramet-ric form. Modeling the functional coefficient parametparamet-rically, the parametparamet-ric form is compared with another parametric alternative. Modeling the functional coefficient nonparametrically, the alternative is the semiparametric regression. In this area of hypothesis testing, F−type tests are widely applied since the model of interest can easily be evaluated under both the null and the alternative hypothesis.
Thereto, bootstrap based inference is broadly used if the asymptotic distribution of a test statistic is difficult or impossible to derive analytically. This may arise as a consequence of nuisance parameters affecting a test statistic, for instance, due to neglected heteroskedasticity. For the case of (asymptotically) pivotal test statistics, moreover, particular bootstrap schemes might outperform the first order asymptotic approximations by faster convergence to the nominal significance levels (Beran 1988, Hall and Titterington 1989). For a goodness-of-fit test statistic based on compar-ing the residual sum of squares from parametric and semiparametric functional re-gressions, Cai, Fan and Yao (2000), henceforth (CF&Y), advocate a residual based bootstrap approach. However, owing to possibly heterogenous error terms, residual based bootstrap inference could lack robustness. To deal with heteroskedasticity, pairs bootstrap (Freedman 1981) and wild bootstrap (Wu 1986, Liu 1988) can be applied. H¨ardle and Mammen (1993) consider the case of a test statistic that is based on the integrated squared difference between a parametric and a nonparametric estimate. They show that under the null hypothesis the pairs bootstrap based approximation does not consistently estimate the distribution of the test statistic while the wild bootstrap approximation does.
The particular interest of this paper is to test the hypothesis that the functional coefficient is constant, i.e. factor independent. We propose a new, factor based boot-strap approach to obtain critical values for contrasting the model estimates obtained under the null and the alternative hypothesis. Similar to pairs bootstrap, the new scheme does not require to estimate model residuals that are subsequently used for resampling. Instead, the underlying factors, governing parameter variation only un-der the alternative hypothesis, are drawn with replacement. The approach is shown to cope with heteroskedasticity since the relationship between the error term
vari-ance and the corresponding regressors is retained. Furthermore, in the framework of semiparametric regressions the factor based bootstrap might be more advantageous than wild, pairs or residual based bootstrap inference. This might be due to the fact that the former is likely better immunized against adverse effects of under- or oversmoothing in nonparametric regression than the latter approaches.
The properties of the residual based (RB), wild (WB), pairs (PB) and factor based bootstrap (FB) inference in functional coefficient models with finite samples are compared by means of a simulation study. Our Monte Carlo exercises cover both parametric and semiparametric alternative hypotheses. Moreover, presuming a parametric pattern for the functional coefficient, the asymptotic behavior of the test statistic and the corresponding factor based bootstrap approximation are investigated. At last, we apply functional coefficient models to a between regression of domestic investment on domestic saving. The enormous interest on the saving-investment (SI) relation in macroeconomic literature is trigged by the so called ‘Feldstein Horioka puzzle’ (Feldstein and Horioka 1980). What this relation measures is still a disputed topic. Via functional coefficient models potential determinants of the SI relation can be detected.
The remainder of the paper is organized as follows: In the next section we in-troduce the functional coefficient model and the considered test statistic. The four alternative bootstrap approaches (RB, WB, PB and FB) are discussed in Section 3. Asymptotic results for the FB approximation are also given in this Section. We compare these approaches by means of Monte-Carlo simulations in Section 4. In Sec-tion 5 the saving-investment relaSec-tion is investigated via funcSec-tional coefficient models. Section 6 summarizes briefly our main findings and concludes. Details proofs for the asymptotic validity of the FB approximations are given in the Appendix, which also provides a list of cross section members considered in the empirical example.
2
The functional coefficient model
2.1
Representation and assumptions for the parametric case
A functional coefficient regression can be given as
yi = K
X
j=1
βj(ui)xij +ei, i= 1, ..., N, (1)
where K and N denote the number of regressors and available observations, respec-tively, with K assumed to be fixed. In model (1) yi depends in a possibly nonlinear
fashion on explanatory variables xi1 to xiK, including a constant. The error terms e1, ..., eN are independent with mean zero and variance σ2i. Single coefficients βj are
functions of a random variableui, called the factor henceforth. Let the functional
co-efficient have the formβj(ui) =β1j+β2jfj(ui),wherefj(ui) is assumed to be known.
Then, given the parametric representation, (1) can be estimated by applying OLS to the regression yi = K X j=1 (β1jxij+β2jxijfj(ui)) +ei.
Thus, model (1) can be written as
yi = z0i1β1+z0i2β2+ei, (2)
= z0
iβ+ei, (3)
where z0
i1 = (xi1, ..., xiK), zi02 = (f1(ui)xi1, ..., fK(ui)xiK), β1 = (β11, ..., β1K)0, β2 = (β21, ..., β2K)0,z0i = (z0i1,z0i2) andβ= (β01,β02)0 is a 2K dimensional parameter vector. The corresponding matrix forms are
y = Z1β1+Z2β2+e, (4)
= Zβ+e, (5)
where y = (y1, ..., yN)0, Z01 = (z11, ...,zN1), Z02 = (z12, ...,zN2), Z0 = (z1, ...,zN)
and e = (e1, ..., eN)0. We make the following assumptions concerning the functional
coefficient model:
(A1) Factor variables u1, u2, ..., uN are independent, with common distribution µ;
zi2 =g(ui) withg being a real continuous function from R toRK ;
(A2) E(||ui||4)<∞with || · || denoting the Euclidean norm;
||g(u)||4 is continuous and||g(u)||4 =O(||u||4) as N → ∞;
(A3) The matrix Z1 is fixed;
(A4) E(ziei) = 0; E(e2
iziz0i) = Vi, a nonnegative definite matrix, with lim N→∞ µ 1 N N P i=1 Vi ¶ = V, a nonnegative definite matrix and plim
µ 1 N N P i=1 e2 iziz0i ¶ =V;
E(ziz0i) = Σi, a positive definite matrix, with lim N→∞( 1 N N P i=1 Σi) = Σ, a positive
definite matrix and plim µ 1 N N P i=1 ziz0i ¶ = Σ; (A5) lim N→∞ 1 Nσ2i =σ2 and plim ¡1 Ne0e ¢ =σ2.
For the later purposes of resampling within the functional coefficient model As-sumption (A1) ensures that drawing from {ui}Ni=1 with replacement generates boot-strap samples of factors sharing their distribution with the factor sample. Further-more, through the continuous mapping g the distribution of zi2 can be defined. As-sumption (A2) consists of 4th moment related conditions that ensure E(||zi||2)<∞
and E(||zi||2e2i)<∞. A comparable construction can be seen in Freedman (1981).
To determine the asymptotic properties of the OLS estimator, ˆ
β=β+ (Z0Z)−1Z0e,
we consider the limiting distribution of
√ N(ˆβ−β) = µ Z0Z N ¶−1µ Z0e √ N ¶ .
It follows by Assumption (A4) that √1
NZ
0e d
→N(0, V), and, as N → ∞,
√
N(ˆβ−β)→d N(0,Σ−1VΣ−1). If the error terms in (1) are homoskedastic, E(e2
i|zi) = E(ei2) = σ2, then V = σ2Σ,
and thus,
√
N(ˆβ−β)→d N(0, σ2Σ−1).
An important specification issue in the framework of functional coefficient models is to distinguish scenarios of constant and functional parameters. For testing a stan-dard regression model against the functional alternative we formalize the following pair of hypotheses:
H0 : β2 = 0 vs. H1 : β2 6= 0. (6)
The considered goodness-of-fit test statistic compares the fitting accuracy of the em-pirical model under both hypotheses,
TN = (RSS0−RSS1)/RSS1. (7) The underlying quantities in (7), RSSi, i = 0,1, are obtained from restricted (H0)
and unrestricted (H1) OLS regressions, i.e. RSS0 = N X i=1 ³ yi−z0i1βˆ (0) 1 ´2 , (8) RSS1 = N X i=1 ³ yi−z0i1βˆ (1) 1 −z0i2βˆ (1) 2 ´2 . (9)
Note that in case of homoskedastic error terms,NTN is asymptotically distributed as χ2(K) under the null hypothesis.
2.2
Semiparametric case
In case of an unknown or unspecified functional form βj(ui), the model in (1) is a
semiparametric regression,
yi = z0i1β(u) +ei,β(u) = (β1(u), ..., βK(u))0. (10)
A semiparametric estimator similar to the Nadaraya-Watson estimator (Nadaraya 1964, Watson 1964) can be applied to estimate β(u) . Consider model (10) in matrix form
y = Z1β(u) +e.
The semiparametric estimator is obtained as ˆ
β(u) = (Z0
1W Z1)−1Z10W y. (11) In (11)uis a local point,W = diag{Kh(u1−u), . . . , Kh(uN−u)},Kh(·) =K(·/h)/h,
with K(·) being a kernel function and h is the bandwidth parameter.
As for the parametric case, testing the flexible semiparametric model in (10) against a constant coefficient regression is of immediate interest. CF&Y propose to distinguish the functional from a constant coefficient model by means of resam-pling theTN statistic in (7) adapted to the semiparametric framework. Their proposal
amounts to contrasting the hypotheses
H0 :β=β1 vs. H1 :β6=β1. (12)
In analogy to (9), a semiparametric estimator of RSS1 is RSS1 =
N
X
i=1
(yi−z0i1βˆ(ui))2. (13)
It is worthwhile mentioning that in the case of unknown form offj(ui) Fourier
se-ries or other parametric approximation might be used instead. As such, the goodness-of-fit tests could have higher power against specific alternatives. However, contrasting two parametric forms might be inferior to testing a parametric form underH0 against a semiparametric alternative owing to potential inconsistency (Horowitz and H¨ardle 1994).
3
Bootstrap procedures
In this section we introduce the factor based bootstrap (FB) to test the pair of hy-potheses in (6) by means of TN in (7). For a comprehensible comparison between
the new procedure and other common bootstrap techniques we also reconsider briefly residual based (RB), wild (WB) and pairs bootstrap (PB) inference. Contrasting parametric models we briefly sketch these resampling schemes in turn.
3.1
Residual based, pairs and wild bootstrap
3.1.1 Residual based bootstrap
The idea of random resampling with replacement, the so called “bootstrap”, was orig-inally proposed by Efron (1979) who has also suggested a residual based resampling scheme for regression models. To determine critical values for the TN statistic, RB
consists of the following steps:
1) Bootstrap residuals{e∗
i}Ni=1 are drawn with replacement from centered residuals
{eˆi− N
P
i=1 ˆ
ei/N}Ni=1 with ˆei obtained under H1,
ˆ ei =yi−z0i1βˆ (1) 1 −z0i2βˆ (1) 2 . 2) A bootstrap sample {y∗ i}Ni=1 consistent with H0 is y∗i =z0i1βˆ (0) 1 +e∗i.
3) Given the sample {y∗
i,zi1, ui}iN=1, RSS∗0 and RSS∗1 are calculated analogously to (8) and (9) to determine the bootstrap test statistic T∗
N.
4) Steps 1) to 3) are performed R times with R chosen sufficiently large. If TN
exceeds the (1−α)-quantile of {TN∗(r)}R
r=1 H0 is rejected with significance level
α.
3.1.2 Wild bootstrap
Implemented via sampling with replacement RB builds upon an iid assumption to hold for error terms ei. Consequently, RB fails to mimic distributional features of
nonspherical disturbances. For the case of heteroskedasticity, WB is widely used. This bootstrap approach goes back to a proposal of Wu (1986) and has been established by Liu (1988) to evaluate the asymptotic distribution of studentized statistics in static linear regression models under heteroskedasticity of unknown form. The first step of WB generates the bootstrap residuals {e∗
i}Ni=1 from unrestricted model estimates as
e∗ i = ˆeivi, ˆei =yi−z0i1βˆ (1) 1 −z0i2βˆ (1) 2 ,
where the random variable vi is independent of the data, E(vi) = 0 and E(v2i) = 1.
There are numerous variants to specify the distribution ofvi that basically differ with
regard to the finite order moments of ˆei mimicked by the WB (Liu 1988, Mammen
1993). We choose one of the simplest, the so–called Rademacher distribution as recommended by Davidson and Flachaire (2001),
vi =
(
−1 with probability 0.5 1 with probability 0.5.
Note that owing to E[v4
i] = 1 also fourth order features of ˆei are retained by this
particular implementation of WB. Once {e∗
i}Ni=1 is obtained, the remaining steps are the same as those for RB.
3.1.3 Pairs bootstrap
Pairs bootstrap as an alternative avenue to address heteroskedastic error distributions has been originally advocated by Freedman (1981). Opposite to RB and WB, PB processes tuples of observed dependent and explanatory variables:
1) Bootstrap samples{y∗
i,z∗i1, u∗i}Ni=1are drawn with replacement from{yi−z0i1βˆ (1) 1 − z0 i2βˆ (1) 2 +z0i1βˆ (0) 1 ,zi1, ui}Ni=1.
2) A bootstrap variant of TN is then obtained from restricted and unrestricted
estimation using the bootstrap sample. Given the sample {y∗
i,z∗i1, u∗i}Ni=1 , RSS∗0 and RSS∗1 are calculated analogously to (8) and (9) to determine the bootstrap test statistic T∗
N.
3) Once T∗
N is obtained the iteration and test decision are as described in step 4)
of RB.
Under the PB approach bootstrap variants of the dependent variable y∗
i are
gener-ated from the estimgener-ated dependent variable under the null hypothesis (z0
i1βˆ (0) 1 ) plus the estimated error terms under the alternative (yi −z0i1βˆ
(1)
1 − z0i2βˆ (1)
2 ). As such, the distribution of the bootstrap test statistic T∗
N can approximate the distribution
of TN under the null hypothesis even if the alternative model holds. For the F-test
statistic, Mammen (1993) shows that its distribution under the null hypothesis co-incides asymptotically with the corresponding WB and PB counterparts under some regularity conditions.
3.2
Factor based bootstrap
FB proceeds from the perspective that underH0 the factor variable does not exert any impact on the parameter of interest. FB does not process first step residual estimates as it is the case for RB, WB and PB. The following steps are involved:
1) Bootstrap factor variables {u∗
i}Ni=1 are drawn with replacement from{ui}Ni=1.
2) Based on the sample {yi,zi1, ui∗}Ni=1, RSS∗0 and RSS∗1 are calculated analogously to (8) and (9) and the bootstrap statisticT∗
N is obtained. Note that in this case,
RSS∗
3) Once T∗
N is obtained the iteration and test decision are as described in step 4)
of RB.
Opposite to PB, the FB scheme leaves the dependent and explanatory variables un-changed, i.e. the variables in yi andzi1 are fixed throughout. As a further distinction in comparison with PB we note that while PB samplesz∗
i2 = (f1(u∗i)x∗i1, ..., fK(u∗i)x∗iK)0
retain the ‘numerical support’ of zi2 = (f1(ui)xi1, ..., fK(ui)xiK)0, FB samples z∗i2 = (f1(u∗i)xi1, ..., fK(u∗i)xiK)0 differ numerically from the population quantities.
The following propositions assert that the asymptotic properties of conditional FB based OLS estimates approximate their unconditional, population counterparts under the null hypothesis β2 = 0. Moreover, the FB variantT∗
N is stated to obey the same
asymptotic features as TN under H0. Formal proofs for propositions 1 to 2 are given
in Appendix 1.
Proposition 1 Assume model (5) with conditions (A1)-(A4). Under the null
hy-pothesis β2 = 0 and along almost all sample sequences, given zi2 for 1 ≤ i ≤ N, as
N → ∞,
a) Z∗0Z∗/N →p Σ;
b) √N(ˆβ∗−βˆ)→d N(0,Σ−1VΣ−1).
Proof: See Appendix 1.
Proposition 2 Assume model (5) with conditions (A1)-(A5). Under the null
hy-pothesis β2 = 0 and along almost all sample sequences, given zi2 for 1 ≤ i ≤ N, as
N → ∞,
sup
0<c<∞|P(T ∗
N ≤c) − P (TN ≤c)| −→p 0.
Proof: See Appendix 1.
Precisely stated, it is the conditional distribution ofTN given {yi,zi}Ni=1 to which the bootstrap distribution of T∗
N converges. As a consequence of Proposition 2,NTN∗
converges to a χ2(K) distribution under homoskedastic error terms. Moreover, it is worth mentioning that assumption (A1) on the independence of factor observa-tions u1, u2, ..., uN might be relaxed since the factor has no impact on the dependent
variable at all under the null hypothesis. Thus, the asymptotic features of the test statistic under the null hypothesis should not be influenced when allowing some form of dependent, e.g. serially correlated, factor observations. For convenience of proving the asymptotic properties of the test statistic under H0, however, we rely on (A1) stating independence of {ui}Ni=1.
Throughout, this section has been focussed on contrasting two parametric hypoth-esis by means of the TN statistic. The implementation of resampling schemes in
case of the nonparametric functional form βj(ui) in (1) is straightforward. Then, as
advocated by CF&Y, ˆei is obtained as ˆei = yi −z0i1βˆ(ui) in step 1) of RB.
Corre-spondingly, WB variants will draw e∗
i = ˆeivi. PB and FB samples are drawn from
{yi−z0i1βˆ(ui) +z0i1βˆ (0)
1 ,zi1, ui}Ni=1 and {yi,zi1, u∗i}Ni=1, respectively. Finally, RSS∗1 is calculated analogously to (13) instead of (9) for all four bootstrap approaches.
4
Monte-Carlo analysis
This section provides a comparison of the four bootstrap methods by means of Monte Carlo (MC) experiments. We investigate the empirical features of the alternative designs for resamplingTN, testing the parametric null hypothesis against a parametric
or a semiparametric alternative. Throughout, MC exercises cover 2000 replications with the number of bootstrap draws chosen as R= 299.
4.1
The simulation design
Specifying regression (1) we consider the following data generating model
yi =β(ui)xi+ei, β(ui) = 0.13 + sin(ui), i= 1, ..., N, (14)
where ui is sampled from the Gaussian distribution. The regressor variables {xi}Ni=1 are drawn once from the Gaussian distribution and then fixed over all MC replications. To evaluate size and power features of competing inferential approaches {yi}Ni=1 are generated according to a sequence of alternative models indexed by η,
yi = Ã 1 N N X i=1 β(ui) +η " β(ui)− 1 N N X i=1 β(ui) #! xi+ei,
whereη= 0.05qwithq = 0,1,2, ...,20 . The constant coefficient model is obtained for
q = 0 whereas the strongest parameter variation is realized in case q = 20 obtaining a model
yi = (0.13 + sin(ui))xi+ei.
The error terms {ei}Ni=1 in (14) are simulated as a normally distributed variable with mean zero and variance σ2
i, where both homogeneous (σi2 = 1) and
hetero-geneous (σ2
i = 0.8|xi|) variances are considered. MC sample sizes cover the cases N = 50,100,200 and N = 400.
For parametric modeling, we employ the regression
such that the constant coefficient model can be formulated as H0 : β2 = 0. For semiparametric modeling, we apply the kernel estimator (11) to the regression
yi =β1(ui) +β2(ui)xi+ei.
The considered null hypothesis is that bothβ1(ui) andβ2(ui) are constant. Regarding
the kernel function, we use the Gaussian kernel, K(·/h) = (2π)−1/2exp(−0.5(·/h)2), where h = 1.06ˆsuN−1/5 and ˆsu is the standard error estimate available from the
factor observations. For a detailed discussion of the nonparametric toolkit the reader is referred to H¨ardle, M¨uller, Sperlich and Werwatz (2004).
4.2
Size features
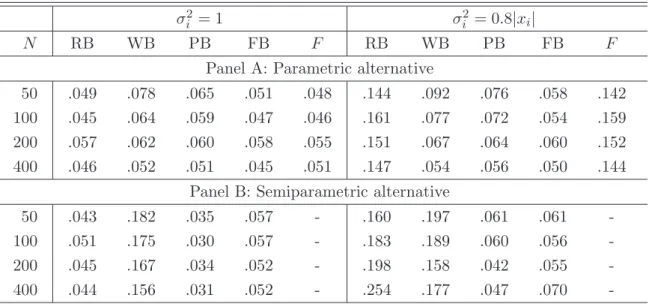
Table 1 shows the empirical size of the goodness-of-fit-tests at the 5% nominal level. Results from parametric and semiparametric modeling are shown in Panel A and Panel B, respectively. For parametric modeling, in addition to bootstrap inference (RB, WB, PB and FB) a common F-statistic, (N −K)TN H∼0 F(1, N −K), is also
employed to test the constant coefficient model.
First consider the results for parametric modeling (Panel A). Tests via RB and the conventional F-test over-reject the null hypothesis when error terms are het-eroskedastic, since both tests build upon an iid assumption. Under homoskedastic model disturbances, the empirical size is between 0.045 and 0.057 (RB) and between 0.046 and 0.051 (F-test). In contrast, relaxing the assumption of iid error terms to independent but heteroskedastic error terms does only slightly increase the rejection probability of the WB, PB and FB tests. These tests provide similar empirical sizes comparing both cases of residual variances. The empirical size obtained via FB is almost uniformly closer to 0.05 in comparison with WB and PB. While WB and PB inference yields empirical size estimates being close to 0.05 forN = 400, it over-rejects
H0 in smaller samples (N = 50,100,200) with 5% significance.
Now turn to the results for semiparametric modeling (Panel B). Under heteroskedas-tic error terms only PB and FB based inference show valid empirical significance lev-els. While the size estimates from PB and FB are mostly close to 0.05, corresponding quantities from RB and WB are between 0.160 and 0.254 and 0.158 and 0.197, respec-tively. The slight increase of FB based rejection frequencies under H0 to 0.07 is an artefact of the set of simulated samples. Under homoskedastic error terms PB based inference constantly underrejects the null hypothesis with empirical sizes between 0.03 and 0.035. At the same time WB based inference strongly overrejects under H0 with empirical sizes between 0.156 and 0.182. In contrast, RB and FB based inference provide empirical sizes being close to 0.05.
4.3
Power features
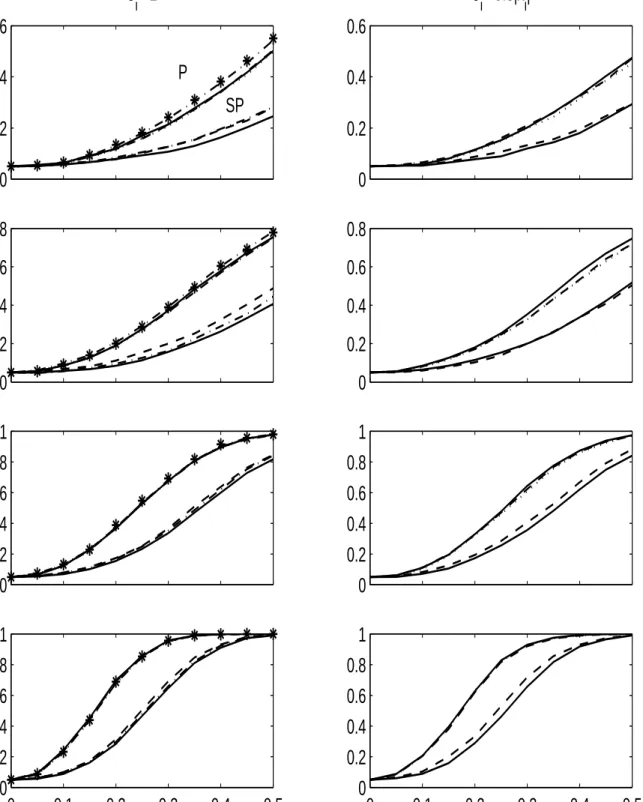
Size adjusted power estimates are displayed in Figure 1. Each graph in Figure 1 shows simulations results from the sample with same length and error distributions. Power curves for parametric modeling are always located above corresponding curves obtained from semiparametric modeling. The nominal significance level of alternative test procedures is adjusted such that their empirical size is 5%. Since size adjustment is not sensible in case of heavy distortions underH0 we do not discuss power features for RB based inference under heteroskedasticity and WB resampling in the semipara-metric modeling framework. All displayed size adjusted power curves increase inηand approach unity asη →1. For parametric modeling, goodness-of-fit tests via RB, WB, PB and FB and F−tests provide very similar power estimates in case the underlying error terms are homoskedastic. As can be seen from the upper cluster in the lower left panel of Figure 1, power estimates for N = 400 cannot be distinguished from each other. When model disturbances are heteroskedastic tests via FB are slightly more powerful than tests relying on WB or PB in small samples (upper clusters in the right hand side panel of Figure 1). For semiparametric modeling RB and PB perform slightly better than FB under homoskedastic errors (the lower clusters in the graphs of the left panel). Accordingly, under heteroskedastic errors tests via PB are slightly more powerful than tests via FB, as can be seen from the lower clusters in the right hand side panels of Figure 1.
5
An empirical example
In this section, we provide an application of the functional coefficient model to the saving-investment relation. By means of a between regression for OECD countries Feldstein and Horioka (1980), henceforth F&H , document a strong correlation linking domestic investment and saving, which is argued to signal a low capital mobility. To find other factors than capital mobility governing the SI relation, F&H employed augmented between regressions,
I∗
i =α+ (β1+β2w¯i)Si∗+ei, i= 1, ..., N. (15)
Variables in (15) are defined as I∗
i = 1/T T P t=1 I∗ it, Si∗ = 1/T T P t=1 S∗ it, where Iit∗ = Iit/Yit andS∗
it=Sit/Yit, andIit,SitandYitdenote gross domestic investment, gross domestic
saving and the gross domestic product (GDP) in time t and country i, respectively. The time average wi = 1/T
P
twit is a measure of some factor characterizing thei-th
member of the cross section. As particular factor variableswitentering (15), F&H use
the rate of population growth, the degree of openness, measured as the sum of exports and imports in relation to GDP, and log GDP. To diagnose factor dependence, F&H refer to the significance of coefficient estimates ˆβ2. However, they could not find that
any of the considered factors significantly influences the link between domestic saving and investment.
A potential drawback of the specification (15) may lie in the presumed linear factor dependence. For this reason, we apply the following functional coefficient model to the SI relation,
e
I∗
i =β(wei)Sei∗+ei. (16)
The measure for domestic investment and saving is mean adjusted in (16) so that only the slope coefficient is factor dependent, i.e. Ie∗
i = Ii∗ −1/N P iIi∗ and Sfi∗ = S∗ i −1/N P
iSi∗. Thus, regression (16) is a semiparametric counterpart to regression
(15). To provide comparable results over alternative measures wit the factor variable
in (16) is standardized, i.e. wei = (wi−1/N
P
iwi)/σ(wi), with σ(wi) being the cross
sectional standard deviation ofwi. Moreover, it is tempting to allow both the constant
and slope coefficient in the between regression to be factor dependent. Therefore, we also consider the functional coefficient model,
I∗
i =β1(wei) +β2(wei)Si∗+ei, (17)
where I∗
i, Si∗ and wei are defined as before. We estimate models (16) and (17) via
kernel smoothing and obtain the correspondingTN statistics. The null hypotheses for
(16) and (17) are H0 : β(wei) = β0 and H0 : β1(wei) = β1, β2(wei) = β2, respectively, with β0, β1 and β2 being constant parameters.
To investigate the factor dependent SI relation, we use three non overlapping cross sections with annual data from 1971 to 2002 drawn from the World Development Indicators CD-Rom 2004 published by the World Bank. These cross sections are 97 countries from all over the world (W97), major OECD members (O26) and mostly less developed economies (L71) obtained as W97 minus O26. A list of investigated economies is given in Appendix 2. Applying a t-test for β2 = 0 in regression (15), only the population growth rate has a significant impact on the SI relation in L71 with ˆβ2 ≈-0.045. Thus, similar to the results in F&H, applying common t−statistics the evidence in favor of factor dependence is weak.
The Tn statistics jointly with p-values obtained from R = 499 RB, WB, PB and
FB samples are provided in Table 2. Results from models (16) and (17) are shown in Panel A and B, respectively. First of all, RB and WB based p-values are almost always much smaller than the FB counterparts. These results are consistent with the findings in the MC analyses obtained when simulating under heteroskedastic error terms. Since WB turned out to be vastly oversized in semiparametric modeling, we only discuss the results from RB, PB and FB henceforth.
As can be seen in Panel A of Table 2, the SI relation is found to be significantly affected by the population growth and openness ratio. Both factors have p-values
in L71 and W97 smaller than 10%. When Model (17) is used (Panel B), they also have significant impacts on the constant and slope coefficient jointly at the 5% level in L71 and W97. Although log GDP is found to have an insignificant impact on the SI relation (Panel A), it affects both the constant and slope coefficient in Model (17) jointly with 10% significance via RB based inference (Panel B). This may reflect partially the influence of GDP growth on the investment rate directly. In addition, it can be seen that all p-values via RB, PB and FB in O26 exceed 10% for both models (16) and (17). On the one hand, this might be due to the reduced power of the test given only 26 observations. On the other hand, it can be caused by the smaller variation of the data in OECD countries, i.e. the relative homogeneity of OECD countries according to the population growth rate and the openness of goods markets.
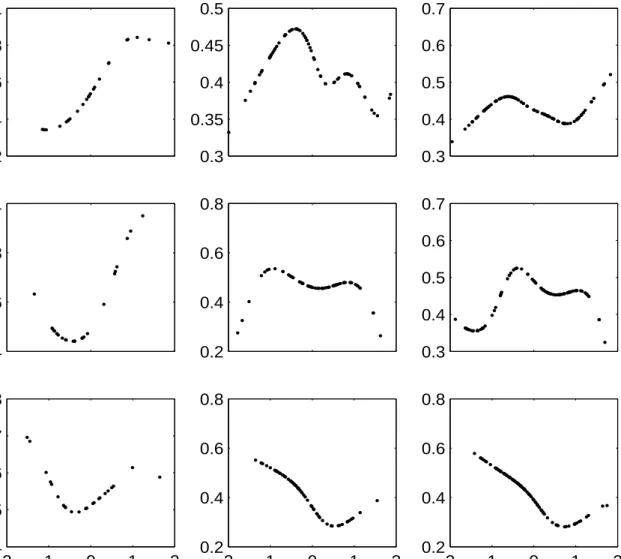
To illustrate the variation of the SI relation, we display the functional estimates of SI relation over the support of −2 ≤wei ≤ 2 for the considered factors. Since the
variations of ˆβ2(wei) from Model (17) are very similar to those of ˆβ(wei) from Model
(16), we show only the latter in Figure 2. Furthermore, since the SI relation is found unaffected by any considered factors in O26 and also not affected by log GDP for all samples according RB, PB and FB based tests (Panel A of Table 2), plots in the first row and first column of Figure 2 are not discussed further. Focusing on the local estimates of SI relation conditional on the population growth rate in L71 and W97 (the last two plots in the second row of Figure 2), a clear trending pattern of the estimated SI relation is not observed. However, conditioning the SI relation on the openness ratio obtains a decreasing functional pattern for L71 and W97 (the last two plots in the bottom row of Figure 2). This supports the view that economies with more integrated goods markets tend to have lower SI relations.
6
Conclusions
A new factor based bootstrap approach is introduced to test parameter invariance against a functional alternative. Modeling the functional coefficient parametrically, the bootstrap approximation of the distribution of the goodness-of-fit test statistic is shown to be valid asymptotically under the null hypothesis. The new bootstrap scheme is shown to be robust against heteroskedastic error distributions. Furthermore, for small samples factor based inference outperforms the wild bootstrap and the pairs bootstrap counterpart that are also known to cope with heteroskedasticity. When the functional coefficient is modeled nonparametrically, only tests via FB provide correct empirical size estimates. At last, applying functional coefficient models to the investment regression on savings, a variation of the saving retention coefficient given the value of the population growth rate and the openness ratio is confirmed and
illustrated.
Since classical linear regression models can be treated as particular functional coefficient models containing constant functions, the application of the factor based bootstrap inference might be extended to these models. We regard this as a possible issue for the future research.
Appendix
Appendix 1
In Appendix 1, asymptotic properties of the FB approximation of the OLS estimator and TN under the constant coefficient model are shown. Most arguments are based
on results in Section 8 of Bickel and Freedman (1981), henceforth B&F.
Before we begin to investigate the asymptotic properties of the FB approximations, it is useful to introduce the following Lemma. Let B denote a finite-dimensional Euclidean space with the Euclidean norm || · || with Γp = Γp(B) being the set of
probabilities γ on the Borel σ-field of B, such that R ||x||pγ(dx)<∞. Let d
p be the
Mallows metric (Mallows 1972). If s and m are distributions, then dp(s, m) is the
infimum of E(||S−M||p)1/p over all pairs of random vectors S and M, where S has
law s and M has law m. Let µg−1 and µ
Ng−1 be distributions on RK and belong to
Γ4. A typical point in RK is zi2. Following (A1), z12,z22, ...,zN2 are independent with common distribution µg−1.
Lemma 1 If d4(µNg−1, µg−1)→0, then
a) the µNg−1 -law of zi2ei(µN, ui) converges to the µg−1-law of zi2ei(µ, ui) in d2,
b) the µNg−1-law of ei(µN, ui) converges to the µg−1-law of ei(µ, ui) in d2,
c) the µNg−1-law of ei(µN, ui)2 converges to the µg−1-law of ei(µ, ui)2 in d1.
PROOF. a) Firstly, considering zi2ei =zi2(yi−z0iβ), the µNg−1 -law of zi2ei(µN, ui)
converges weakly to theµg−1-law ofz
i2ei(µ, ui) as long aszi2(yi−z0iβ) is a continuous
function of zi2. Secondly,
||zi2ei(µN, ui)||2 = ||zi2||2ei(µN, ui)2
= ||zi2||2yi2− ||zi2||22yiz0iβ+||zi2||2β0zizi0β. (18)
By integrating (18) with respect to µNg−1 and applying Lemma 8.3c of B&F, it can
be shown that Z
||zi2ei(µN, ui)||2µNg−1(dzi2)→ Z
Thus, a) is proved according to Lemma 8.3a of B&F.
b) The statement follows the same argument as the previous one.
c) According to the statement b) that the µNg−1-law of ei(µN, ui) converges to the µg−1-law ofe
i(µ, ui) ind2, c) is proved by using Lemma 8.5 of B&F with the relevant
φ(ei) =e2i.
Now turn to FB. Given the sample {ui}Ni=1, the bootstrap factors u∗1, u∗2, ..., u∗N
are independent, with common distribution µN. In the original data, the estimated
residual for model (3) is
ˆ
ei =yi−z0iβˆ. (19)
In the bootstrap data, the residual is given as
e∗
i =yi−z∗i0βˆ, (20)
wherez∗
i0 = (xi1, ..., xiK, f1(u∗i)xi1, ..., fK(u∗i)xiK) as long as the null hypothesisβ2 = 0 is true, i.e. ui has no influence on βj. The corresponding residual estimate is then
ˆ
e∗
i =yi−z∗i0βˆ∗. (21)
In the following, the conditional law of √N( ˆβ∗−βˆ) is shown to converge weakly to the unconditional law of √N(ˆβ−β). The proof is similar to the one for the pairwise bootstrap provided in Freedman (1981).
Lemma 2 d4(µN, µ)→0 as N → ∞.
PROOF. According to (A2), µN and µ∈Γ4, and then apply Lemma 8.4 of B&F.
Lemma 3 If d4(µN, µ)→0 then d4(µNg−1, µg−1)→0.
PROOF. Firstly, µNg−1 → µg−1 weakly because µN → µ weakly and g is
contin-uous given (A1). Secondly, according to Lemma 8.3c of B&F, R ||g(u)||4µ
N(du) →
R
||g(u)||4µ(du) follows from (A2). This convergence is equivalent toR ||x||4µ
Ng−1(dx)→
R
||x||4µg−1(dx). Therefore, d
4(µNg−1, µg−1)→0 according to Lemma 8.3a of B&F.
Proof of Proposition 1. For the bootstrap quantity
√ N( ˆβ∗−βˆ) = µ Z∗0Z∗ N ¶−1µ Z∗0e∗ √ N ¶ = Ã Z10Z1/N Z10Z∗2/N Z∗ 20Z1/N Z∗20Z∗2/N !−1Ã Z10e∗/ √ N Z∗ 20e∗/ √ N ! , (22)
the corresponding population quantity is √ N(ˆβ−β) = µ Z0Z N ¶−1µ Z0e √ N ¶ = Ã Z10Z1/N Z10Z2/N Z20Z1/N Z20Z2/N !−1Ã Z10e/ √ N Z20e/ √ N ! . (23)
The Mallows metric of order 1 between the second diagonal element in the first part of the quantities in (22) and (23) is,
d1 µ 1 NZ ∗ 20Z∗2, 1 NZ 0 2Z2 ¶ = d1 Ã 1 N N X i=1 z∗i2z∗i20, 1 N N X i=1 zi2z0i2 ! .
According to Lemma 8.6 of B&F,
d1 Ã 1 N N X i=1 zi2z0i2, 1 N N X i=1 z∗i2z∗i20 ! ≤d1(zi2z0i2,z∗i2z∗i20). (24) The right hand side of (24) goes to 0 as N → ∞. This follows from Lemma 3 introduced before and Lemma 8.5 of B&F with the relevant function φ(zi2) = zi2z0i2. Furthermore, the squared Mallows metric of order 2 between the upper diagonal element in the first part of the quantities in (22) and (23),
½ d2 µ 1 NZ1 0Z∗ 2, 1 NZ1 0Z 2 ¶¾2 ≤ 1 N2 trace(Z1 0Z 1){d2(zi2,z∗i2)}2, (25) according to Lemma 8.9 of B&F, Lemma 3 and Assumption (A3). The right hand side of (25) goes to 0 as N → ∞ since 1
Ntrace(Z1
0Z
1) is finite and d2(zi2,z∗i2) → 0 given Lemma 3. Combining the argument that the Mallows metrics between 1
NZ ∗ 20Z∗2 and 1 NZ 0
2Z2 and between N1Z10Z∗2 and N1Z1
0Z
2 converge to zero, the conditional law of 1
NZ
∗0Z∗ converges weakly to the unconditional law of 1
NZ
0Z. Since the latter
converges in probability to Σ given Assumption (A4), part a) of Proposition 1 is proved.
Analogously, the squared Mallows metric of order 2 between the first element in the second part of the quantities in (22) and (23),
½ d2 µ 1 √ NZ1 0e∗,√1 NZ1 0e ¶¾2 ≤ 1 N trace(Z1 0Z 1){d2(ei, e∗i)}2, (26)
according to Lemma 8.9 of B&F and Lemma 1b. The right hand side of (26) goes to 0 as N → ∞ since 1
Ntrace(Z1
0Z
1) is finite and d2(ei, e∗i)→0 given Lemma 1b.
At last, the Mallows metric of order 2 between the second element in the second part of the quantities in (22) and (23) is,
½ d2 µ 1 √ NZ ∗ 20e∗, 1 √ NZ 0 2e ¶¾2 = ( d2 à 1 √ N N X i=1 z∗ i2e∗i, 1 √ N N X i=1 zi2ei !)2 .
According to Lemma 8.7 of B&F, ( d2 Ã 1 √ N N X i=1 z∗ i2e∗i, 1 √ N N X i=1 zi2ei !)2 ≤ {d2(z∗i2e∗i,zi2ei)}2. (27)
The right hand side of (27) goes to 0 as N → ∞. This follows from Lemma 1a. Thus, the conditional law of √1
NZ
∗0e∗ converges weakly to the unconditional law of
1 √ NZ 0esince √1 NZ1 0eand √1 NZ 0
2econverge weakly to √1NZ10e∗ and √1NZ∗20e∗ accord-ingly. Owing to joint asymptotic normality of √1
NZ1 0e and √1 NZ2 0e the asymptotic distribution of √1 NZ ∗0e∗ isN(0, V).
Combining the argument that 1
NZ
∗0Z∗ converges in probability to Σ and the
con-ditional law of √1
NZ
∗0e∗ converges weakly to N(0, V), part b) of Proposition 1 is
proved.
Proof of Proposition 2. The null hypothesis of a constant coefficient model (H0 :β2 = 0) can be formulated as
H0 :Rβ= 0,
whereR = (0K×K, IK) with0K×K andIK denoting aK×K matrix of zeros and theK
dimensional identity matrix. As such, the test statistic TN in (7) can be equivalently
formulated as NTN = (R ˆ β)0(R(Z0Z)−1R0)−1(Rβˆ) e σ2 =B 0B, (28) where B = (R(Z0Z)−1R0)−1/2Rβˆ/eσ and eσ2 = 1 N N P i=1 ˆ e2
i with ˆei being the OLS residual
in (19). The corresponding bootstrap statistic for (28) is then,
NTN∗ = (Rβˆ ∗)0(R(Z∗0Z∗)−1R0)−1(Rβˆ∗) e σ∗2 =B ∗0B∗, (29) where B∗ = (R(Z∗0Z∗)−1R0)−1/2Rβˆ∗/σe∗ and σe∗2 = 1 N N P i=1 ˆ e∗2
i with ˆe∗i being the OLS
residual in (21). According to previous arguments for Proposition 1,
R(Z∗0Z∗/N)−1R0)−1/2√NRβˆ∗ →d R(Z0Z/N)−1R0)−1/2√NRβˆ.
Since plim(eσ2) = σ2, B∗ →d B if plim(eσ∗2) = σ2. The latter is shown through the following Lemma. Thus, NT∗
N d
→NTN and Proposition 2 is proved.
Lemma 4 Assume model (5) with conditions (A1)-(A5). Under the null hypothesis
β2 = 0 and along almost all sample sequences, given zi2 for 1≤i ≤N, as N → ∞,
e
PROOF. Firstly eσ∗2 is a consistent estimator for σ∗2 since, according Proposition 1, plim eσ∗2 = plim µ 1 Neˆ ∗0 ˆ e∗ ¶ =σ∗2.
Then by Lemma 8.6 of B&F,
d1 Ã 1 N N X i=1 e∗ i2, 1 N N X i=1 ei2 ! ≤d1(e∗i2, ei2). (30)
The right hand side of (30) goes to zero as N → ∞according to Lemma 2, 3, and 1c. Thus, eσ∗2 →p σ∗2 and the latter converges in conditional probability to σ2 given (30) and Assumption (A5).
Appendix 2: List of countries
• W97: Algeria; Argentina; Australia; Austria; Bangladesh; Barbados; Belgium; Benin; Botswana; Brazil; Burkina Faso; Burundi; Cameroon; Canada; Cen-tral African Republic; Chile; China; Colombia; Congo Dem. Rep.; Congo Rep.; Costa Rica; Ivory Coast; Denmark; Dominican Republic; Ecuador; Egypt Arab Rep.; El Salvador; Fiji; Finland; France; Gabon; Gambia; Germany; Ghana; Greece; Guatemala; Guyana; Haiti; Honduras; Hong Kong, China; Hungary; Iceland; India; Indonesia; Ireland; Israel; Italy; Jamaica; Japan; Kenya; Korea, Rep.; Kuwait; Luxembourg; Madagascar; Malawi; Malaysia; Mali; Malta; Mauritania; Mexico; Morocco; Myanmar; Nepal; Netherlands; New Zealand; Niger; Nigeria; Norway; Pakistan; Paraguay; Peru; Philippines; Portu-gal; Rwanda; Saudi Arabia; SenePortu-gal; Singapore; South Africa; Spain; Sri Lanka; Suriname; Swaziland; Sweden; Switzerland; Syrian Arab Republic; Thailand; Togo; Trinidad and Tobago; Tunisia; Turkey; Uganda; United Kingdom; United States; Uruguay; Bolivarian Republic of Venezuela; Zambia; Zimbabwe.
• O26: all OECD countries except Czech Republic, Poland, Slovak Republic and Luxembourg.
• L71: W97 minus O26.
References
Beran, R. (1988). Prepivoting test statistics: A bootstrap view of asymptotic refine-ments, Journal of the American Statistical Association 83: 687–697.
Bickel, P. J. and Freedman, D. A. (1981). Some asymptotic theory for the bootstrap,
Cai, Z., Fan, J. and Yao, Q. (2000). Functional-coefficient regression models for nonlinear time series, Journal of the American Statistical Association 95: 941– 956.
Chen, R. and Tsay, R. (1993). Functional-coeffcient autoregressive models, Journal
of the American Statistical Association 88: 298–308.
Cleveland, W. S., Grosse, E. and Shyu, W. M. (1992). Local regression models, in J. Chambers and T. Hastie (eds),Statistical Models in S, Wadsworth and Brooks, Pacific Grove, California, pp. 309–376.
Davidson, R. and Flachaire, E. (2001). The wild bootstrap, tamed at last, Working
Papers 1000, Queen’s University, Department of Economics.
Efron, B. (1979). Bootstrap methods: Another look at the jackknife, The Annals of
Statistics 7: 1–26.
Feldstein, M. and Horioka, C. (1980). Domestic saving and international capital flows,
Economic Journal 90: 314–329.
Freedman, D. A. (1981). Bootstrapping regression models, The Annals of Statistics 9: 1218–1228.
Hall, P. and Titterington, D. M. (1989). The effect of simulation order on level accuracy and power of Monte-Carlo tests,Journal of the Royal Statistical Society,
Series B, 51: 459–467.
H¨ardle, W. and Mammen, E. (1993). Comparing nonparametric versus parametric regressino fits, The Annals of Statistics 21: 1926–1947.
H¨ardle, W., M¨uller, M., Sperlich, S. and Werwatz, A. (2004). Nonparametric and
semiparametric models, Springer, Berlin.
Hastie, T. and Tibshirani, R. (1993). Varing-coefficient models, Journal of the Royal
Statistical Society, Series B, 55: 757–796.
Horowitz, J. L. and H¨ardle, W. (1994). Testing a parametric model against a semi-parametric alternative, Econometric Theory10: 821–848.
Liu, R. (1988). Bootstrap procedures under some non i.i.d. models, The Annals of
Statistics 16: 1696–1708.
Mallows, C. L. (1972). A note on asymptotic joint normality, The Annals of
Mathe-matical Statistics 43: 508–515.
Mammen, E. (1993). Bootstrap and wild bootsrap for high dimensional linear models,
Nadaraya, E. A. (1964). On estimating regression, Theory of Probability and its
Applications 10: 186–190.
Nelder, J. A. and Wedderburn, R. W. M. (1972). Generalized linear models, Journal
of the Royal Statistical Society, Series A, 135: 370–384.
Watson, G. (1964). Smooth regression analysis, Sankhy¯a, Series A, 26: 359–372. Wu, C. (1986). Jackknife, bootstrap, and other resampling methods in regression
Table 1: Empirical sizes of the test
σi2= 1 σ2i = 0.8|xi|
N RB WB PB FB F RB WB PB FB F
Panel A: Parametric alternative
50 .049 .078 .065 .051 .048 .144 .092 .076 .058 .142 100 .045 .064 .059 .047 .046 .161 .077 .072 .054 .159 200 .057 .062 .060 .058 .055 .151 .067 .064 .060 .152 400 .046 .052 .051 .045 .051 .147 .054 .056 .050 .144
Panel B: Semiparametric alternative
50 .043 .182 .035 .057 - .160 .197 .061 .061 -100 .051 .175 .030 .057 - .183 .189 .060 .056 -200 .045 .167 .034 .052 - .198 .158 .042 .055 -400 .044 .156 .031 .052 - .254 .177 .047 .070
-This table reports empirical sizes for theTN statistic employed to the null hypothesis of a constant
coefficient model against a parametric (panel A) and semiparametric (panel B) alternative. MC exercises include RB, WB, PB and FB resampling and, in the parametric case, also the common
F−statistic. The nominal significance level is 5%.
Table 2: Tests for the factor independent SI relation
TN Statistic RB WB PB FB
factor O26 L71 W97 O26 L71 W97 O26 L71 W97 O26 L71 W97 O26 L71 W97 Panel A: Model without constant
LGDP .193 .047 .031 .194 .549 .639 .072 .888 .774 .188 .862 .832 .353 .741 .820 POP .187 .227 .143 .150 .004 .010 .070 .000 .002 .257 .066 .096 .333 .032 .040 OPN .057 .129 .190 .731 .062 .000 .824 .084 .020 .874 .263 .074 .804 .172 .018
Panel B: Model with constant
LGDP .340 .203 .168 .343 .090 .078 .092 .196 .112 .255 .347 .339 .355 .188 .168 POP .218 .311 .200 .505 .012 .014 .323 .022 .034 .509 .108 .146 .577 .048 .034 OPN .159 .345 .305 .752 .000 .000 .475 .002 .000 .577 .032 .030 .810 .010 .006
This table reports the goodness-of-fit test statistics and the correspondingp-value via RB, WB, PB and FB. Three factors are considered: the logrithm of GDP (LGDP), the rate of population growth (POP) and the openness ratio (OPN).
0
0.2
0.4
0.6
N=50σ
i2=1
0
0.2
0.4
0.6
σ
i2=0.8|x
i|
0
0.2
0.4
0.6
0.8
N=1000
0.2
0.4
0.6
0.8
0
0.2
0.4
0.6
0.8
1
N=2000
0.2
0.4
0.6
0.8
1
0
0.1
0.2
0.3
0.4
0.5
0
0.2
0.4
0.6
0.8
1
N=4000
0.1
0.2
0.3
0.4
0.5
0
0.2
0.4
0.6
0.8
1
P
SP
Figure 1: Size adjusted power estimates givenη= 0,0.05, ..,0.5 for theTN statistic via parametric
(P) and semiparametric modeling (SP). Power curves for the latter cluster below corresponding figures obtained for the former all over. The solid lines are power estimates from tests via FB, the dashed lines are from tests via PB, the dashed and dotted lines are from tests via RB, the dotted lines are from tests via WB and the stars correspond to commonF-tests.
0.2 0.4 0.6 0.8 1 O26 LGDP 0.4 0.6 0.8 1 POP −2 −1 0 1 2 0.4 0.5 0.6 0.7 0.8 OPN 0.3 0.35 0.4 0.45 0.5 L71 0.2 0.4 0.6 0.8 −2 −1 0 1 2 0.2 0.4 0.6 0.8 0.3 0.4 0.5 0.6 0.7 W97 0.3 0.4 0.5 0.6 0.7 −2 −1 0 1 2 0.2 0.4 0.6 0.8
Figure 2: Functional estimates of the SI relation conditional on the logarithm of GDP (LGDP), the rate of population growth (POP) and the openness ratio (OPN).