See discussions, stats, and author profiles for this publication at: https://www.researchgate.net/publication/280157018
Zinc Finger Protein Binding to DNA: An Energy
Perspective Using Molecular Dynamics
Simulation and Free Energy Calculations on
Mutants of both Zinc Finger Domains and their
Specific...
Article in Journal of biomolecular Structure & Dynamics · August 2015
DOI: 10.1080/07391102.2015.1068224 READS 51 2 authors, including: Mazen Y. Hamed Birzeit University 33PUBLICATIONS 280CITATIONS SEE PROFILE
All in-text references underlined in blue are linked to publications on ResearchGate, letting you access and read them immediately.
Available from: Mazen Y. Hamed Retrieved on: 11 August 2016
This article was downloaded by: [Mazen Hamed] On: 22 July 2015, At: 06:03
Publisher: Taylor & Francis
Informa Ltd Registered in England and Wales Registered Number: 1072954 Registered office: 5 Howick Place, London, SW1P 1WG
Click for updates
Journal of Biomolecular Structure and Dynamics
Publication details, including instructions for authors and subscription information: http://www.tandfonline.com/loi/tbsd20
Zinc Finger Protein Binding to DNA: An Energy
Perspective Using Molecular Dynamics Simulation
and Free Energy Calculations on Mutants of both Zinc
Finger Domains and their Specific DNA bases.
Mazen Y. Hameda & Gaurav Aryab a
Chemistry Department, Birzeit University, PoBox 14 Birzeit, Palestine b
Department of Nanoengineering, University of California, Sandiego, 9500 Gilman Dr., MC-0448, La Jolla, CA 92093-0448. USA
Accepted author version posted online: 21 Jul 2015.
To cite this article: Mazen Y. Hamed & Gaurav Arya (2015): Zinc Finger Protein Binding to DNA: An Energy Perspective Using Molecular Dynamics Simulation and Free Energy Calculations on Mutants of both Zinc Finger Domains and their Specific DNA bases., Journal of Biomolecular Structure and Dynamics, DOI: 10.1080/07391102.2015.1068224
To link to this article: http://dx.doi.org/10.1080/07391102.2015.1068224
Disclaimer: This is a version of an unedited manuscript that has been accepted for publication. As a service
to authors and researchers we are providing this version of the accepted manuscript (AM). Copyediting, typesetting, and review of the resulting proof will be undertaken on this manuscript before final publication of the Version of Record (VoR). During production and pre-press, errors may be discovered which could affect the content, and all legal disclaimers that apply to the journal relate to this version also.
PLEASE SCROLL DOWN FOR ARTICLE
Taylor & Francis makes every effort to ensure the accuracy of all the information (the “Content”) contained in the publications on our platform. However, Taylor & Francis, our agents, and our licensors make no
representations or warranties whatsoever as to the accuracy, completeness, or suitability for any purpose of the Content. Any opinions and views expressed in this publication are the opinions and views of the authors, and are not the views of or endorsed by Taylor & Francis. The accuracy of the Content should not be relied upon and should be independently verified with primary sources of information. Taylor and Francis shall not be liable for any losses, actions, claims, proceedings, demands, costs, expenses, damages, and other liabilities whatsoever or howsoever caused arising directly or indirectly in connection with, in relation to or arising out of the use of the Content.
This article may be used for research, teaching, and private study purposes. Any substantial or systematic reproduction, redistribution, reselling, loan, sub-licensing, systematic supply, or distribution in any
form to anyone is expressly forbidden. Terms & Conditions of access and use can be found at http:// www.tandfonline.com/page/terms-and-conditions
1 Publisher: Taylor & Francis
Journal: Journal of Biomolecular Structure and Dynamics
DOI: http://dx.doi.org/10.1080/07391102.2015.1068224
Zinc Finger Protein Binding to DNA: An Energy Perspective Using Molecular Dynamics
Simulation and Free Energy Calculations on Mutants of both Zinc Finger Domains and their
Specific DNA bases.
Mazen Y. Hamed1
Chemistry Department, Birzeit University, PoBox 14 Birzeit, Palestine
Gaurav Arya
Department of Nanoengineering, University of California, Sandiego, 9500 Gilman Dr.,
MC-0448,
La Jolla, CA 92093-0448. USA
1
Mazen Y. Hamed : corresponding author, Birzeit University, Address for correspondence: Chemistry Department, Birzeit University, PoBox 14, Birzeit, Palestine.
Electronic mail: [email protected]
2 Abstract
Energy calculations based on MM/GBSA were employed to study various zinc finger protein motifs binding to DNA. Mutants of both the DNA bound to their specific amino acids were studied. Calculated energies gave evidence for a relationship between binding energy and affinity of zinc finger motifs to their sites on DNA. ΔG values were -15.82(12), -3.66(12) and ¬12.14(11.6) Kcal/mol for finger one, finger two and finger three respectively. The mutations in the DNA bases reduced the value of the
negative energies of binding (maximum value for ΔΔG = 42Kcal/mol for F1 when GCG mutated to GGG, and ΔΔG = 22 Kcal/mol for F2, the loss in total energy of binding originated in the loss in electrostatic energies upon mutation(r= 0.98). The mutations in key amino acids in the zinc finger motif in positions -1, 2, 3 and 6 showed reduced binding energies to DNA with correlation coefficients between total free energy and electrostatic was 0.99 and with Van der Waal was 0.93. Results agree with experimentally found selectivity which showed that Arginine in position -1 is specific to G, while Aspartic acid (D) in position 2 plays a complicated role in binding. There is a correlation between the MD calculated free energies of binding and those obtained experimentally for prepared zinc finger motifs bound to triplet bases in other reports (D J Segal, Dreier, Beerli, & Barbas, 1999) , our results may help in the design of zinc finger motifs based on the established recognition codes based on energies and contributing energies to the total energy.
3 Introduction
Cys2 His2 Zinc finger proteins (ZF) are known to bind specifically to DNA sequences in
transcription factor IIIA (Pabo, Peisach, & Grant, 2001; Eustermann et al., 2011; Carlson et al.,
2010; Temiz & Camacho, 2009), they consist of two, three, or more fingers in the DNA binding
protein. Each single finger domain consists of 30 amino acid residues with a ββα fold, the finger is stabilized by the structural zinc ion bound to two Histidine and two Cysteine residues in
tetrahedral environment(Dreier, Segal, & Barbas, 2000; C O Pabo & Sauer, 1984). Naturally
occurring ZF proteins in biological systems have been extensively studied and many x-ray
crystal structures have been determined (Dreier et al., 2000; David J Segal, Crotty, Bhakta,
Barbas, & Horton, 2006) . Progress in understanding protein-DNA recognition has made it
possible to design many site specific regulatory ZF proteins that can alter gene expression in a
specific way. Emergence of such systems has a wide range of important biomedical applications
(Dreier et al., 2000; Ligands et al., 2004; Nakata et al., 2012; C O Pabo & Sauer, 1984; Carl O
Pabo et al., 2001; Pavletich & Pabo, 1991; David J Segal et al., 2006). Also many other multi
finger proteins were successfully engineered to bind specific DNA targets and this has a potential
use in medicine (Dreier et al., 2000; Nakata et al., 2012; Carl O Pabo et al., 2001; D J Segal et
al., 1999). Zinc finger proteins have potential as DNA binding domains of novel transcription
factors (Carlson et al., 2010; Eustermann et al., 2011; A. N. Temiz & Camacho, 2009) which
help in the treatment of diseases by employing gene therapy, the advantage of ZF proteins being
their capability to bind larger binding sites(Nakata et al., 2012; Wolfe, Grant, Elrod-Erickson, &
Pabo, 2001; Wolfe, Ramm, & Pabo, 2000) .
The issue of specificity of ZF proteins is still not fully understood, specifically the
accuracy of the predicted modularity of ZF binding to DNA sequences , which means the ability
4 to build segments from amino acids to form fingers and join the fingers together to fulfill certain
function as engineered. The dissociation constants of many ZF-DNA sequences prepared by site
directed mutagenesis were experimentally determined using gel shift mobility experiments
(Dreier, Beerli, Segal, Flippin, & Barbas, 2001; Elrod-Erickson, Benson, & Pabo, 1998; Kang &
Kim, 2000; Ligands et al., 2004; Carl O Pabo et al., 2001) with an error of ± 50% (Blancafort, Segal, & Barbas, 2004; Brayer, Kulshreshtha, & Segal, 2008; Cheng, Boyer, & Juliano, 1997;
Dreier et al., 2000; Jamieson, Miller, & Pabo, 2003; Q. Liu, Xia, Zhong, & Case, 2002; Carl O
Pabo et al., 2001; D J Segal et al., 1999; Uil, 2003; Wu, Yang, & Barbas, 1995). On the basis of
these binding studies, amino acid residue-base specificities were assigned(Ligands et al., 2004;
Carl O Pabo et al., 2001; D J Segal et al., 1999) supported by the known crystal structures.
However, discrepancy between the predicted specificity and the experimentally found ones in
determined x-ray structures still exists (David J Segal et al., 2006).
Statistically based specificities using the known ZF protein-DNA crystal structures derived by
preparing databases and empirical rules there from were reported and compared with
experimentally derived specificity with reasonable correlation(Desjarlais & Berg, 1992; Fu et al.,
2009; Gromiha, Siebers, Selvaraj, Kono, & Sarai, 2005; J. Liu & Stormo, 2008; Paillard &
Lavery, 2004; Rohs, West, Liu, & Honig, 2009) . Strategies for selection of specific ZF binding
have also been developed(Greisman, 1997) .
Molecular dynamics has been employed as a powerful tool in solving complicated
biological problems in protein folding, drug design, protein-protein interaction and DNA studies
(Chang, McLaughlin, Baron, Wang, & McCammon, 2008; Fogolari, Brigo, & Molinari, 2003;
Hou, Chen, McLaughlin, Lu, & Wang, 2006; Kollman et al., 2000; Naïm et al., 2007; Qiu,
Shenkin, Hollinger, & Still, 1997; Rizzo, Aynechi, Case, & Kuntz, 2006; J. Wang, Morin, Wang,
5 & Kollman, 2001; W. Wang et al., 2001) . Free energy calculations have been used as a powerful
tool to study protein-ligand (Kollman et al., 2000) and protein-protein interactions (Chang et al.,
2008; Hou et al., 2006). The MM-GBSA (Molecular Mechanics Surfaces area-generalized Born
model) was introduced and used successfully in evaluating binding energies of proteins and their
complexes with reasonable correlation to experimental values and giving a sound explanation of
the contributing energies (Naïm et al., 2007; Rizzo et al., 2006; J. Wang et al., 2001; W. Wang et
al., 2001). This method relies on the contributions of Van der Waals (VdW) and electrostatic
energies as well as on nonpolar and relative solute entropy(Fogolari et al., 2003; Qiu et al.,
1997). In this work, the VdW and electrostatic interactions between protein and ligand in the
protein-DNA complex are calculated using molecular mechanics. The nonpolar contribution to
solvation free energy is estimated employing the solvent accessible surface, and the electrostatic
contribution to solvation is calculated by a continuum model (by solving the Generalized Born
equation (Qiu et al., 1997). Entropy is usually calculated using normal mode calculation(Fogolari
et al., 2003; Morozov, Havranek, Baker, & Siggia, 2005) . Snapshots are extracted from
molecular dynamics trajectories and every snapshot is analyzed by MM/GBSA.
Here we employ MM/GBSA in calculating the free energy of binding for different
sequences of zinc finger proteins to various targets of base combinations of DNA. Then the
contributing energies to the total free energy of binding are analyzed to explore the capability of
this method in estimating the specificity of ZF fingers binding to DNA bases. The outcome of
this work can be used as a measurement of the predictive power of MD and MM-GBSA in
designing Zinc fingers which bind specifically to certain base combinations of target DNA.
Attempts were made to identify the important features responsible for DNA binding
using x-ray structures and bioinformatics in order to establish a recognition code and to predict
6 specific binding. The extent to which these empirical rules can predict the capability of certain
sequence to bind specifically to a designated DNA target so it can be used in zinc finger protein
design was investigated. The indirect readout in the recognition process cannot be ignored and
has been given attention (Rohs et al., 2009). In fact researchers, using selection strategies, have
been able to develop new sequence specific DNA binding proteins which are capable of targeting
unique sequences in the human genome with high affinity and modularity(Dreier et al., 2000; C
O Pabo & Nekludova, 2000; C O Pabo & Sauer, 1984; Carl O Pabo et al., 2001; D J Segal et al.,
1999) . However, until now, no simple recognition code could be established because of the
problems of cross strand, inter-helical contacts and the flexibility of orientation of the
recognition helix (Dreier et al., 2000; C O Pabo & Nekludova, 2000; Wolfe et al., 2001, 2000),
along with the possibility of finger rotation(David J Segal et al., 2006) .
In this work the emphasis is on molecular aspects of recognition of amino acid
residues on zinc fingers to DNA bases, the approach depends on mutating either the amino acid
residues and keeping the DNA bases unchanged or mutating the DNA bases and keeping the
amino acid sequence in the wild type unchanged. In another experiment both the zinc finger key
residues and the DNA bases were mutated in a way to optimize the binding specificity to imitate
the experimentally obtained data by random selection and mutagenesis (D J Segal et al., 1999).
The outcome of our calculations indicated a strong dependence on electrostatic energy in
the binding process of zinc fingers to DNA and a high sensitivity of the calculated energy values
to mutations, giving an indication of the predictive power of MD and MM-GBSA in this case. It
also proved to have sufficient resolution, in this case, to predict residue dependent changes in
free energy that correlate with the experimental results of Segal and Pabo (Miller & Pabo, 2001;
Carl O Pabo et al., 2001; D J Segal et al., 1999). Based on these results we assign a functional
7 dependence to each residue, which will help in the future design of zinc fingers capable of
specific binding to DNA based on free energy of binding.
Methods :
Molecular dynamic simulations were performed using the Amber9.0 package (D. A. Case et al.,
2006; D.A. Pearlman et al., 1995). Amber9 was used for MD simulations to optimize the zinc
finger DNA complexes. A Zinc finger/DNA complex was downloaded from the PDB data bank
(PDB code 1aay) with a resolution of 1.60Å. The PDB file was inspected, water and salt were
removed and mutations were achieved using either pymol (DeLano, 2002) for the protein or
using the UCSF Chimera package from the Resource for Biocomputing, Visualization, and
Informatics at the University of California, San Francisco (supported by NIH P41 RR-01081)
(Pettersen EF et al., 2004) for mutations in the DNA bases. Then Xleap (D. A. Case et al., 2006)
was used to neutralize the system by adding sodium ions. The complex was solvated in
aTIP3PBOX cubic water box with dimensions of 12.0 Å distance from solute. The structure was
checked for errors and then converted to topology and coordinate files. Sander was used from the
Amber9.0 package to minimize the structure. MD simulations were carried out under the NVT
ensemble with heating, equilibration and production for 2 nanoseconds of simulation time. The
output file was converted to PDB format using ambpdb from Amber and water was stripped out
and the ions were removed, then the files were re-converted to topology and coordinate files in
xleap and were used along with the Sander mdcrd output file in MM/GBSA to produce 100 to
150 trajectory files which were used to calculate the binding free energy, Normal mode
calculation was used to calculate the entropy contribution.
Parameters used for MD calculations:
8 A series of minimizations ( maxcyc1000 ncycl 500 then 2500 ncycl 500 cycles of steepest
descent at a time until RMSD is stable at a value less than 2 Å fluctuating around 1.4 Å) were
performed to relax the system prior to MD simulations a 20000 step in total Particle Mesh Ewald
calculation was used for calculating the long range electrostatic interactions. Shake was used to
restrain bonds involving hydrogen atoms. The Time step for the MD simulations was 1.5 fs to 2
fs depending on the sensitivity of the system. Equilibration of the system employing MD
followed these steps: first gradual heating from 0 to 300K in 50 ps (Langevin dynamics used for
temperature control) followed by 50ps of density equilibration with weak restraints followed by
500ps of constant pressure equilibration at 300K. The production simulation was carried out
under the same conditions as the final phase of equilibration for a total of 2ns with recording
every 8 ps to obtain snapshots. Before using MM-GBSA the system equilibration was verified by
considering temperature, density, total energy and root mean squared deviation of coordinates
(RMSD). An RMSD value relative to the crystal structure of 1.5Å was deemed acceptable. The
resulting trajectories were analyzed using the MM-GBSA modules in AMBER9.0.
Calculation of the Free Energy of Zinc finger interaction with DNA bases:
The Generalized Born model solvent area method in MM_GBSA in AMBER9.0 was employed
for the calculations:
∆G binding(Solvated) =∆G binding(vac)+∆GSolvation(complex)-(∆Gsolvation(Lig)+∆Gsolvation(receptor) ) ∆G solvation=G electrostatic(ε=80) –G electrostatic(ε=1) +∆G hydrophobic ,
The free energy of binding contains three major contributions: Van der Waals, electrostatic and
solvation energies. The solvation energy contribution was calculated using both the polar
9 contribution to solvation (GB) and the nonpolar contribution to solvation which was calculated
based on accessible surface area (SA)(Qiu et al., 1997) .
Normal mode calculation was used to calculate entropy contributions, T∆S, from the same snapshots as were used for calculating ∆G binding. Then the absolute free energy of binding was calculated from
∆G = ∆G binding - T∆S
Results and Discussion
The recognition pattern of the zinc finger to DNA is shown in Figure 1, residues -1, 2, 3
and 6 are known to play the major role in the binding process. The aim of our calculations is to
establish which part of the protein sequence is the possible recognition domain and which
residue(s) play the crucial role in recognition and binding based on energy considerations. Non
canonical interactions, which hamper the idea of simple recognition, have also to be considered.
In general, amino acid residue A1 on a protein interacts with its specific base B1 on the DNA and
with other neighboring bases B2 and B3. On the other hand, base B1 from DNA may interact
with more than one amino acid residue on the protein (A1 and A2) at the same time (C O Pabo &
Sauer, 1984; Roy et al., 2012).
key positions in the zinc finger protein Figure 1 (namely -1, 3 and 6 in addition to
Aspartate in position 2) which are known to bind specifically to DNA bases in each finger (C O
Pabo & Sauer, 1984; Carl O Pabo et al., 2001; Pavletich & Pabo, 1991; Roy et al., 2012; D J
Segal et al., 1999) were mutated in order to test the extent of modularity, specificity and any
possible cooperativity. Aspartate in Position 2 (D2) was reported to take part in binding to the
bases C or A on the 5’ strand opposite to a G base on the 3’ strand, it also interacts with R-1 (see
10 Figure 1 and Figure 5b). Mutants of residues 2 and 6 which are reported to play a role in binding
either separately or jointly (Carl O Pabo et al., 2001; Roy et al., 2012) were studied. The role of
other residues i.e. S-2, S1 were also studied and the energy of binding was calculated in all cases.
1) Initial study of the binding of the zinc fingers to DNA
The free energy of binding of each of the zinc fingers from the x-ray structure, now termed F1,
F2 and F3 were calculated (Table I). The total free energy (GBTOT) was -50(∓ 5) Kcal/mol for each finger, with varying contributions, the Van der Waal interactions were in the same range for
all three fingers (- 35∓5 Kcal/mol). While the electrostatic interactions were maximum for F3 and lowest for F1, the free energy ∆G isthe least negative for F2 namely – 3.5 Kcal/mol. ∆G was more negative for fingers one and three indicating stronger binding, the entropy factor did not
show a considerable change within a margin of error for all three fingers. Thus, we can safely
say that absolute free energies (∆G) vary in the order F1 ≥ F3 >F2 with ∆H as the possible major contributor to the free energy, this may be an indication that F1 and F3 act as a hook to establish
the binding of the protein to DNA.
Mutations of the DNA bases specifically bound to the Zinc fingers (each finger studied individually):
Figures 2a, 2b and 2c and inserts 2a and 2b show the results of an experiment where
DNA bases were mutated leaving the protein sequence intact in its wild type form. Fingers one
(F1), two (F2) and three (F3) showed reduced binding upon mutation of the DNA bases. The loss
in binding energy upon mutating DNA bases confirms the natural selection of the binding sites
as evident in the reduction of binding energy upon mutating the wild type bases(see insert to
Figure 2a). The triplet GCG originally known to bind finger one (F1) (with the sequence
11 SRSELTR) was mutated as shown in Figure 2a. The naturally occurring base triplet TGG which
is specific to F2 has the highest negative free energy compared to other base triplets. Mutation in
the DNA triplet TGG specific for binding finger two (F2) (SRSDHLTT) in the wild type zinc
finger protein is shown in Figure 2b. These mutations in the DNA bases resulted in lower free
energy of binding. Changes in total binding energy, in this case, are paralleled by changes in
both electrostatic and VdW energies. The weakest binding is observed for ATA for F2. The
general trend is a loss in binding strength upon mutation of the wild type triplet TGG specific for
finger two(F2). This loss in binding can be attributed mainly to loss in electrostatic energy upon
mutation of bases. An increase in electrostatic energy values upon mutation of DNA bases in all
three fingers was noted. It was more pronounced for F2 than for F1 and F3. Although
electrostatic energy values increase considerably for F3, the values stay negative upon mutations.
This is expected forthe F3 sequence due to it possessing an R residue at position 4 and a K
residue at position 5. These both being polar basic residues, hence both are responsible for high
electrostatic attraction. This observation, in addition to showing the effect of mutating the bases
on reducing the free energy of binding, gives evidence of behavioral differences between F1, F2
and F3. Thereby, supporting the individual role each finger plays in the DNA binding process, in
agreement with (Eustermann et al., 2011) and (Roy et al., 2012) in which the authors highlight
the different roles and importance of each finger. The total loss in free energy in all three fingers
is about 30 Kcal/mol relative to the wild type binding energy. This loss varies according to the
type of DNA base triplet combination (see inserts to Figure 2a and 2b). Table (II) columns 1, 2
and 3 give the correlations between individual energies contributing to the total free energy, it is
clear in all fingers studied that the highest contribution is from electrostatic forces (H-bonds,
water mediated H-bonds will be published later).
12 Investigation of the binding of experimentally studied Zinc finger motifs to various DNA base combinations:
When each sequence is bound to its designated specific triplet as derived experimentally
by random selection studied by Segal in (D J Segal et al., 1999), the free energy of binding is
more negative than when that same sequence is bound to the wild type triplet (TGG), for
example the sequence SQ-1SGD3LRR6 binds GCA 1.6 times stronger than binding TGG (see
Figure 5A and Tables II and III ). This finding stands as a confirmation of the selectivity of
sequences derived experimentally by Segal and co-workers. A good correlation is observed for
F2 variants prepared by Segal when the individual energies (electrostatic, VDW, solvation) are
correlated to the total free energy (GBTOT) as can be seen in Table (II) column 4. This
observation confirms the naturally selected sequences bound to their triplets as prepared in (D J
Segal et al., 1999).
Mutation of zinc finger protein amino acid sequence bound to wild type naturally occurring 11 base pairs
In order to study the effect of amino acid residue mutations on the free energy of binding, finger
two was singled out due to its reported importance in the binding process. Each amino acid
residue in finger two was mutated (finger two (F2) amino acid sequence from zif268 (pdb code
1aay) bound to its wild type 11bp (AGCGGGTGCGT) see Figure 1. The free energy of binding
to the TGG region was calculated and the results are shown in Figure 3A and 3B. Figure 3
shows a great sensitivity of the binding free energy to the mutations of the residues in positions
13 1, 2, 3 and 6. It is evident from the mutations that the largest loss in binding energy took place
upon mutation of the key residues responsible for specific binding (R-1, H3, T6) see Figure 1 and
4. In this case, any loss in binding is attributed to the loss in net electrostatic energy. As shown in
Figure 3b electrostatic energy changed noticeably (Correlation coefficient R= 0.99) and VdW
energy (R=0.93) while desolvation energies did not show much change within the error margin
upon mutation (R=0.21) (see Figure 3c and Table IV). The electrostatic part of the desolvation
energy showed a good correlation unlike the hydrophobic part of the solvation energy (R=0.94).
This is indicative of an electrostatic nature of the hydrated pocket involved in the process of
binding.
The mutation of D2 which is responsible for cooperative binding and also binding the
opposite strand showed a significant loss in binding energy, implicating the importance of this
residue for Zinc finger binding to DNA. The importance of the key residues responsible for DNA
base binding in the zinc finger can be arranged according to the amount of lost binding energy
upon mutating the residue, and they can be arranged as follows: D2>R-1>H3 (T6 was not reported
to have such a strong binding with T of the DNA).
These mutations of the amino acid residues in the finger 2 sequence and the binding of
the mutants to the WT 11bp of the DNA bound to ZF (AGCGTGGGCGG) revealed important
information about the role of key residues -1,2,3,5 and 6, with special emphasis on
residues-1,2,3 and 6. The total free energy of binding of finger 2 was -50.5±5 Kcal/mol. When residue E replaced residue D in position two, a noticeable loss in binding was observed. When Histidine in
position 3 (known to bind the middle G in the TGG triplet) was mutated to K, the binding energy
dropped by 8.0 (∓ 4.4) Kcal/mol. The loss in binding energy was 18.0 ± 4.5 Kcal/mol when R
14 in position -1 (which is known to bind G on the 3’ side of TGG) was mutated to K. These results
show the importance of R-1, H3 and D2 in the DNA binding process.
It should be noted that some mutations, specifically the T5 to L and T6 to R mutants, showed
enhanced binding (Figure 3A). This can be explained by the increased number of electrostatic
interactions represented by hydrogen bonds to the phosphate backbone, which can be classified
as nonspecific binding, thereby confirming the indirect effect of mutating an amino acid residue
on directing side chains in the helix in order to make more nonspecific contacts. The increase in
nonspecific binding is due to turning the helix into a different position upon mutation. No
considerable change in entropy was recorded as indicated by the small change in TS upon
mutation (Figure 3B). Indeed a mutagenesis study has shown (Chang et al., 2008) that a Leucine
analogue exhibited an enhanced thermodynamic stability due to its side chain (a process
dominated by solvent reorganization). This extra stability helps in exposing the polar surface of
the helix to bind stronger to DNA bases. TheL residue is known to enhance the α helical structure and consequently the electrostatic interactions (Tsui et al., 2000).
The hydrophobic contribution to solvation remained the same upon mutation of the F2 sequence.
The drastic change occurred in the electrostatic interactions which changed the total free energy
of binding. The free energy of binding upon mutation of residues in finger two has a high
correlation with electrostatic interaction energy with an r value close to 1.0 indicating a large
contribution from electrostatic energy.
Importance of R-1
15 Upon mutation of Arginine (R-1) to other amino acid residues (Figure 4), namely lysine and
Histidine (K and H), which have a resemblance to R (all three are polar basic amino acids and
carry a positively charged Nitrogen) a loss in binding energy took place (up to 20Kcal/mol). The
same behavior was observed upon mutating R to Q (a polar uncharged residue). The loss in
binding became greater upon mutating R to the acidic residues Glutamine and Aspartic acid (E
and D). It was reported that charged side chains and solvent to helix potential and field backbone
contributions always come from the first two helical turns (Tsui et al., 2000). These results are in
agreement of the extra binding of the N-terminal side of the helix, i.e S-2 R-1S1 H3 and D2 fall in
the range of these two turns. The binding distances of R-1 and H3 in F1 and F2 are demonstrated
in the figures 5b and 5c.
Comparison of mutants of zinc finger domain sequences binding to other triplet base pairs
Finger two variants (J. Liu & Stormo, 2008; D J Segal et al., 1999) bound to 11 base pairs with
the finger two target site mutated as shown in Figure4 were used to study the predictive power of
the MD simulation in analyzing the binding of various amino acid sequences to specific base pair
combinations. It can be seen that the stability of ZF-DNA complex, as indicated by the negative
free energy, supports, in most of the cases, the experimentally obtained specificity of residues
to their specific bases as obtained by Kd values from electrophoresis Gel shift assays (D J Segal
et al., 1999) (Figure 5a) , for correlation between MD obtained values and experimental free
energy values see Table III. The most noticeable free energy values are the specificity of residue
16 R to the base G, residue Q to A and D to C, for example R-1K3R6 showed enhanced stability for
GGG over most ZF’s which contain R in position 6 (see supplementary material). The amino
acid combination also played a role in the stability, as can be seen in its extra stability over R
-1
H3R6. The type of base combination also played a role in stability, for example RKR/GGG is
more stable than RKR/GTG while in both cases R-1 and R6 are bound to G. The type of
combination of residues also affected the free energy of binding, for example R-K-R showed
stronger binding than R-H-R to GGG, although H was reported to be specific to G by Segel and
co-workers (see supplementary Figures A and B). Position of the amino acid residue in the
sequence has an effect on its strength of binding to its specific base, i.e whether the residue is in
position -1, 3 or 6. For example Q-D-R binds specifically to GCA stronger than when D is in
position -1 as the cases of D-H-R to GGC or DNR to GACshow. These findings show the
importance of the positions of residues (-1, 3 or 6) in affecting the extent of binding.
The same argument holds true for other combinations, if we compare for example
QDR/GCA, QNR/GAA, QSR/GTA, QSR/GTG and QDR/GCT. The outcome of this comparison
is that Q-1 is specific to A, but Q results in more stable binding when present with D in position 3
than when present with T or S in position 3. These interactions affect the specificity of binding
and support the hypothesis of cooperative binding. They also support the effect of interaction of
residues with each other in the finger sequence (C O Pabo & Nekludova, 2000).
Breaking the total free energy of binding to its individual energies (Electrostatic, Van der
Waals and surface area) shows which energy drives the binding process and which is most
affected by mutation. It is obvious from the variation in VdWenergy that it parallels the
variation in total free energy. This makes it one of the major contributing energies to the free
energy with the rest of the contribution from the electrostatic energy (loss in binding energy is
17 mainly due to loss in electrostatic energy in all cases, see correlation diagrams). This
contribution also depends on the type of residues and bases involved in binding; the electrostatic
contribution from the point of view of base combination is maximum for GGG then GGA then
GCA and GAA, so the order is GGG>GGA≥GCA=GAA.
Considering the amino acid combinations’ effect on electrostatic energy, they can be arranged
according to their electrostatic contribution: RK has the maximum contribution followed by QD,
QH and QN. This can be verified further upon mutating the DNA bases.
This outcome demonstrates how complicated the recognition process can be (C O Pabo &
Nekludova, 2000), and it also shows that co-operativity is a factor which cannot be ignored in the
recognition process. A final outcome is that R and H are most specific to G, D and E are specific
to C, T, S and E are specific to T and Q and N are specific to A.
The experimentally observed specificity of residues in positions -1,3 and 6 based on equilibrium
binding studies showed that R and H were specific to G; Q and N and E bind specifically to A
with Q the strongest binder; D and E bind C with D a stronger binder to C; T, S and E bind T. In
order to study the effect of positions -2,1,2 and 5, finger two with the sequence SRSDHLTT was
singled out for study, although experimental reports were mostly on –LVR in positions 5 and 6
instead of LTT (J. Liu & Stormo, 2008; Miller & Pabo, 2001; D J Segal et al., 1999). Our
predicted values for a single finger 2 were ( -50.0±4.5 Kcal/mol) and the absolute free energy was –3.5±11 Kcal/mol after considering the entropy T∆S. The details of calculated binding energies of several amino acid sequences and the experimentally calculates energies are shown
in the supplementary figures.
Conclusion:
18 F1 and F3 have higher negative hydrophobic energy than F2 (Table II). Desolvation of F3 is
highest (expected because of the type of residues involved; ARSDERKR compared to both F1
and F2 which contain LT in positions 4 and 5 instead of the KR in F3). The solvation energy
contribution is greatest for finger 3 then 2 then 1. The hydrophobic contribution to solvation is in
the same range for all three fingers indicating that the solvation energy difference arises from
polar contribution, this goes well with the more polar surface of finger three (see Table II).
Correlation for F1 and F2 (Table IV) is in the order Electrostatic>hydrophobic> Vdw while for
F3 the correlation between total energy and hydrophobic energy is better than with electrostatic
energy.
Total negative free energies GBTOT vary in the order: F3 ≥ F1> F2 (Table I). ∆G value is -3.5 Kcal/mol for all three fingers. Entropy contribution is close for all three fingers. Therefore, each
finger has the same affinity to its specific base triplet and the process is mainly enthalpy driven.
Van der Waal forces recorded similar values for all fingers, within the error margin
(-35Kcal/mol). Electrostatic contribution is close for F1 and F2, but is slightly higher for F3.
Molecular dynamics simulations and MM/GBSA prove that the free energy of binding
can be reasonably estimated for zinc finger proteins binding to DNA with correlation
coefficients comparable to those reported in (J. Liu & Stormo, 2008) which employed
context-dependent model for zinc finger-DNA interactions and compared it with other theoretically and
experimentally obtained techniques , it was shown that the estimated free energy of binding gave
acceptable correlation with values calculated experimentally from equilibrium studies (J. Liu &
Stormo, 2008; D J Segal et al., 1999; Temiz & Camacho, 2009; Temiz et al., 2010). It was
evident in all studies performed in this work that the driving force for binding of amino acid
19 residues to DNA bases is electrostatic in nature, i.e. between amino acid side chains, DNA base
side chains and the backbone phosphate (Roy et al., 2012; Temiz et al., 2010). These electrostatic
attractions are expressed as hydrogen bonding between key residues on the N-terminus of the
helix and the bases starting at the 3’ end of the strand (Figure 5B and 5C). Non specific binding
is part of the process which in some previous studies on DNA binding proteins was thought of as
a transition state in the specific binding process.
Our studies showed that Arginine and Histidine are specific to G, while glutamine is
specific to A and Aspartate is specific to C (see R—G and H—G distances in figures 5B and
5C). These findings are in agreement with experimental work by Segal (D J Segal et al., 1999). It
was evident that position -1 in the helix plays a major role in recognition of the helix to its
specific base triplet and in most cases Arginine recognized G and glutamine (Q) recognized A. In
addition to that Aspartate in position 2 proved to be very important to the recognition and
binding process as it forms four hydrogen bonds with R-1 and binds C or A on the opposite strand
on the 5’ side. This is in agreement with previous reports (Carl O Pabo et al., 2001; Temiz &
Camacho, 2009; Temiz et al., 2010).
In all studies performed, mutations of the wild type zinc finger amino acid sequences
resulted in lower energy of binding to the wild type eleven base pair DNA as can be seen in
Figures 3 and 4. On the other hand, mutations of the specific DNA triplets (WT) resulted in
lower binding energy of the zinc finger (Temiz & Camacho, 2009).
To optimize the selectivity, both the zinc finger helix and DNA triplets were mutated
together, this resulted in maximum negative free energy of binding for the experimentally
selected helices when compared to the binding energy of these helices to the original wild type
20 triplet (TGG). It was evident in the study that finger 1 and 3 have a stronger binding than finger
2, which agrees with the proposed mechanisms that finger 1 plays the major role in recognition
(Eustermann et al., 2011). It has been reported that due to the co-operatively of binding
observed, it is difficult to design sequences with high specificity (Carlson et al., 2010). However,
in the future, MM-GBSA and MD can help in designing new site-specific zinc finger proteins
with optimum binding capacity to specific DNA bases by estimating the binding energy of a
given sequence to a certain base pair combination. Indeed studies on ZF binding to DNA have
already proved important in therapeutic studies in humans (Eustermann et al., 2011).
References
Blancafort, P., Segal, D. J., & Barbas, C. F. (2004). Designing transcription factor architectures for drug discovery.
Molecular Pharmacology, 66(6), 1361–71. doi:10.1124/mol.104.002758
Brayer, K. J., Kulshreshtha, S., & Segal, D. J. (2008). The protein-binding potential of C2H2 zinc finger domains.
Cell Biochemistry and Biophysics, 51(1), 9–19. doi:10.1007/s12013-008-9007-6
Carlson, C. D., Warren, C. L., Hauschild, K. E., Ozers, M. S., Qadir, N., Bhimsaria, D., … Ansari, A. Z. (2010). Specificity landscapes of DNA binding molecules elucidate biological function. Proceedings of the National Academy of Sciences of the United States of America, 107(10), 4544–4549. doi:10.1073/pnas.0914023107
Chang, C.-E. a, McLaughlin, W. a, Baron, R., Wang, W., & McCammon, J. A. (2008). Entropic contributions and the influence of the hydrophobic environment in promiscuous protein-protein association. Proceedings of the National Academy of Sciences of the United States of America, 105(21), 7456–61.
doi:10.1073/pnas.0800452105
Cheng, X., Boyer, J. L., & Juliano, R. L. (1997). Selection of peptides that functionally replace a zinc finger in the Sp1 transcription factor by using a yeast combinatorial library. Proceedings of the National Academy of Sciences of the United States of America, 94(25), 14120–5. Retrieved from
http://www.pubmedcentral.nih.gov/articlerender.fcgi?artid=28443&tool=pmcentrez&rendertype=abstract
D. A. Case, D. A. Pearlman, J.W. Caldwell, T.E. Cheatham III, J. Wang, W. S. R., C.L. Simmerling, T.A. Darden, K.M. Merz, R.V. Stanton, A.L. Cheng, J.J. Vencent, M., Crawley, V. Tsui, H. Gohlke, R.J. Radmer, Y. Duan, J. Pietera, I. Massova, G. L. S., & U. C. Singh, P.K. Weiner, P. A. K. (2006). Amber 9.
D.A. Pearlman, D.A. Case, J.W. Caldwell, W.R. Ross, T.E. Chealtham, S., & DeBolt, I.I.I. D. Ferguson, G. Seibel, P. K. (1995). AMBER, a package of computer programs for applying molecular mechanics, normal mode analysis, molecular dynamics and free energy calculation to simulate the structural and energetic properties of molecules. Computer Physics Communication.
DeLano, W. L. (2002). The PyMOL Molecular Graphics System. Retrieved from http://www.pymol.org
21
Desjarlais, & Berg, J. M. (1992). Redesigning the DNA-binding specificity of a zinc finger protein: a data base-guided approach. Proteins, 13(3), 272. doi:10.1002/prot.340130309
Dreier, B., Beerli, R. R., Segal, D. J., Flippin, J. D., & Barbas, C. F. (2001). Development of zinc finger domains for recognition of the 5’-ANN-3' family of DNA sequences and their use in the construction of artificial
transcription factors. The Journal of Biological Chemistry, 276(31), 29466–78. doi:10.1074/jbc.M102604200
Dreier, B., Segal, D. J., & Barbas, C. F. (2000). Insights into the molecular recognition of the 5’-GNN-3' family of DNA sequences by zinc finger domains. Journal of Molecular Biology, 303(4), 489–502.
doi:10.1006/jmbi.2000.4133
Elrod-Erickson, M., Benson, T. E., & Pabo, C. O. (1998). High-resolution structures of variant Zif268-DNA complexes: implications for understanding zinc finger-DNA recognition. Structure (London, England : 1993),
6(4), 451–64. Retrieved from http://www.ncbi.nlm.nih.gov/pubmed/9562555
Eustermann, S., Videler, H., Yang, J. C., Cole, P. T., Gruszka, D., Veprintsev, D., & Neuhaus, D. (2011). The DNA-binding domain of human PARP-1 interacts with DNA single-strand breaks as a monomer through its second zinc finger. Journal of Molecular Biology, 407(1), 149–170. doi:10.1016/j.jmb.2011.01.034
Fogolari, F., Brigo, A., & Molinari, H. (2003). Protocol for MM/PBSA molecular dynamics simulations of proteins.
Biophysical Journal, 85(1), 159–66. doi:10.1016/S0006-3495(03)74462-2
Fu, F., Sander, J. D., Maeder, M., Thibodeau-Beganny, S., Joung, J. K., Dobbs, D., … Voytas, D. F. (2009). Zinc Finger Database (ZiFDB): a repository for information on C2H2 zinc fingers and engineered zinc-finger arrays. Nucleic Acids Research, 37(Database issue), D279–83. doi:10.1093/nar/gkn606
Greisman, H. a. (1997). A General Strategy for Selecting High-Affinity Zinc Finger Proteins for Diverse DNA Target Sites. Science, 275(5300), 657–661. doi:10.1126/science.275.5300.657
Gromiha, M. M., Siebers, J. G., Selvaraj, S., Kono, H., & Sarai, A. (2005). Role of inter and intramolecular interactions in protein-DNA recognition. Gene, 364, 108–13. doi:10.1016/j.gene.2005.07.022
Hou, T., Chen, K., McLaughlin, W. a, Lu, B., & Wang, W. (2006). Computational analysis and prediction of the binding motif and protein interacting partners of the Abl SH3 domain. PLoS Computational Biology, 2(1), 0046–0055. doi:10.1371/journal.pcbi.0020001
Jamieson, A. C., Miller, J. C., & Pabo, C. O. (2003). Drug discovery with engineered zinc-finger proteins. Nature Reviews. Drug Discovery, 2(5), 361–8. doi:10.1038/nrd1087
Kang, J. S., & Kim, J. S. (2000). Zinc finger proteins as designer transcription factors. The Journal of Biological Chemistry, 275(12), 8742–8. Retrieved from http://www.ncbi.nlm.nih.gov/pubmed/10722717
Kollman, P. a, Massova, I., Reyes, C., Kuhn, B., Huo, S., Chong, L., … Cheatham, T. E. (2000). Calculating structures and free energies of complex molecules: combining molecular mechanics and continuum models.
Accounts of Chemical Research, 33(12), 889–97. Retrieved from http://www.ncbi.nlm.nih.gov/pubmed/11123888
Ligands, M. B., Nguyen-hackley, D. H., Ramm, E., Taylor, C. M., Joung, J. K., Dervan, P. B., & Pabo, C. O. (2004). Allosteric Inhibition of Zinc-Finger Binding in the Major Groove of DNA by, 3880–3890.
Liu, J., & Stormo, G. D. (2008). Context-dependent DNA recognition code for C2H2 zinc-finger transcription factors. Bioinformatics (Oxford, England), 24(17), 1850–7. doi:10.1093/bioinformatics/btn331
22
Liu, Q., Xia, Z., Zhong, X., & Case, C. C. (2002). Validated zinc finger protein designs for all 16 GNN DNA triplet targets. The Journal of Biological Chemistry, 277(6), 3850–6. doi:10.1074/jbc.M110669200
Miller, J. C., & Pabo, C. O. (2001). Rearrangement of side-chains in a Zif268 mutant highlights the complexities of zinc finger-DNA recognition. Journal of Molecular Biology, 313(2), 309–15. doi:10.1006/jmbi.2001.4975
Morozov, A. V, Havranek, J. J., Baker, D., & Siggia, E. D. (2005). Protein-DNA binding specificity predictions with structural models. Nucleic Acids Research, 33(18), 5781–98. doi:10.1093/nar/gki875
Naïm, M., Bhat, S., Rankin, K. N., Dennis, S., Chowdhury, S. F., Siddiqi, I., … Purisima, E. O. (2007). Solvated interaction energy (SIE) for scoring protein-ligand binding affinities. 1. Exploring the parameter space.
Journal of Chemical Information and Modeling, 47(1), 122–33. doi:10.1021/ci600406v
Nakata, E., Liew, F. F., Uwatoko, C., Kiyonaka, S., Mori, Y., Katsuda, Y., … Morii, T. (2012). Zinc-Finger Proteins for Site-Specific Protein Positioning on DNA-Origami Structures. Angewandte Chemie, 51(10), 2421–2424.
Pabo, C. O., & Nekludova, L. (2000). Geometric analysis and comparison of protein-DNA interfaces: why is there no simple code for recognition? Journal of Molecular Biology, 301(3), 597–624. doi:10.1006/jmbi.2000.3918
Pabo, C. O., Peisach, E., & Grant, R. A. (2001). D ESIGN AND S ELECTION OF N OVEL C YS2 H IS2 Z INC F INGER P ROTEINS. Annual Review of Biochemistry.
Pabo, C. O., & Sauer, R. T. (1984). Protein-DNA recognition. Annual Review of Biochemistry, 53, 293–321. doi:10.1146/annurev.bi.53.070184.001453
Paillard, G., & Lavery, R. (2004). Analyzing Protein-DNA Recognition Mechanisms. Structure, 12(1), 113–122. doi:10.1016/j.str.2003.11.022
Pavletich, N. P., & Pabo, C. O. (1991). Zinc finger-DNA recognition: crystal structure of a Zif268-DNA complex at 2.1 A. Science, 252(5007), 809–817.
Pettersen EF, Goddard TD, Huang CC, Couch GS, Greenblatt DM, Meng EC, F. TE. (2004). a visualization system for exploratory research and analysis. J Comput Chem, 25(13), 1605–1612.
Qiu, D., Shenkin, P. S., Hollinger, F. P., & Still, W. C. (1997). The GB/SA Continuum Model for Solvation. A Fast Analytical Method for the Calculation of Approximate Born Radii, 5639(96), 3005–3014.
Rizzo, R. C., Aynechi, T., Case, D. A., & Kuntz, I. D. (2006). Estimation of Absolute Free Energies of Hydration Using Continuum Methods : Accuracy of Partial Charge Models and Optimization of Nonpolar Contributions, 128–139.
Rohs, R., West, S. M., Liu, P., & Honig, B. (2009). Nuance in the double-helix and its role in protein-DNA recognition. Current Opinion in Structural Biology, 19(2), 171–7. doi:10.1016/j.sbi.2009.03.002
Roy, S., Dutta, S., Khanna, K., Singla, S., & Sundar, D. (2012). Prediction of DNA-binding specificity in zinc finger proteins. Journal of Biosciences, 37(3), 483–491. doi:10.1007/s12038-012-9213-7
Segal, D. J., Crotty, J. W., Bhakta, M. S., Barbas, C. F., & Horton, N. C. (2006). Structure of Aart, a designed six-finger zinc six-finger peptide, bound to DNA. Journal of Molecular Biology, 363(2), 405–21.
doi:10.1016/j.jmb.2006.08.016
23
Segal, D. J., Dreier, B., Beerli, R. R., & Barbas, C. F. (1999). Toward controlling gene expression at will: selection and design of zinc finger domains recognizing each of the 5’-GNN-3' DNA target sequences. Proceedings of the National Academy of Sciences of the United States of America, 96(6), 2758–63. Retrieved from
http://www.pubmedcentral.nih.gov/articlerender.fcgi?artid=15842&tool=pmcentrez&rendertype=abstract
Temiz, N. A., & Camacho, C. J. (2009). Experimentally based contact energies decode interactions responsible for protein-DNA affinity and the role of molecular waters at the binding interface. Nucleic Acids Research,
37(12), 4076–4088. doi:10.1093/nar/gkp289
Temiz, N. A., Trapp, A., Prokopyev, O. A., & Camacho, C. J. (2010). Optimization of minimum set of protein--DNA interactions: a quasi exact solution with minimum over-fitting. Bioinformatics, 26(3), 319–325.
Tsui, V., Radhakrishnan, I., Wright, P. E., & Case, D. a. (2000). NMR and molecular dynamics studies of the hydration of a zinc finger-DNA complex. Journal of Molecular Biology, 302(5), 1101–17.
doi:10.1006/jmbi.2000.4108
Uil, T. G. (2003). Therapeutic modulation of endogenous gene function by agents with designed DNA-sequence specificities. Nucleic Acids Research, 31(21), 6064–6078. doi:10.1093/nar/gkg815
Wang, J., Morin, P., Wang, W., & Kollman, P. a. (2001). Use of MM-PBSA in reproducing the binding free energies to HIV-1 RT of TIBO derivatives and predicting the binding mode to HIV-1 RT of efavirenz by docking and MM-PBSA. Journal of the American Chemical Society, 123(22), 3986–3994. Retrieved from http://www.ncbi.nlm.nih.gov/pubmed/11457384
Wang, W., Lim, W. a, Jakalian, a, Wang, J., Luo, R., Bayly, C. I., & Kollman, P. a. (2001). An analysis of the interactions between the Sem-5 SH3 domain and its ligands using molecular dynamics, free energy
calculations, and sequence analysis. Journal of the American Chemical Society, 123(17), 3986–94. Retrieved from http://www.ncbi.nlm.nih.gov/pubmed/11457149
Wolfe, S. a, Grant, R. a, Elrod-Erickson, M., & Pabo, C. O. (2001). Beyond the “recognition code”: structures of two Cys2His2 zinc finger/TATA box complexes. Structure (London, England : 1993), 9(8), 717–23. Retrieved from http://www.ncbi.nlm.nih.gov/pubmed/11587646
Wolfe, S. a, Ramm, E. I., & Pabo, C. O. (2000). Combining structure-based design with phage display to create new Cys(2)His(2) zinc finger dimers. Structure (London, England : 1993), 8(7), 739–50. Retrieved from
http://www.ncbi.nlm.nih.gov/pubmed/10903945
Wu, H., Yang, W. P., & Barbas, C. F. (1995). Building zinc fingers by selection: toward a therapeutic application.
Proceedings of the National Academy of Sciences of the United States of America, 92(2), 344–348. doi:10.1073/pnas.92.2.344
24 H C 6 β 3 2 -1 -1 2 3 6
RPYACPVESCDRRFSRSDELTRHIRIHTGQKPFQCRICMRNFSRSDHLTTHIRTHTGEKPFACDICGRKFARSDERKRHTK IHLR
Figure 1
Cys2His2 zinc finger motif and the sequence. Ribbon diagram (top) of finger 3 from the average
structure: showing the two cysteine and two Histidine residues binding the zinc atom. Key
F1 (α) F2 (α) F3 (α)
25 positions R-1, D2, E3 and R6 which bind the G C G on the major groove of the DNA. The amino acid sequence of zif268 with key positions which bind DNA bases are shown in boldface (bottom)
26
Figure 2(a):
The change in total energy (GBTOT) upon mutation of DNA bases specific for F1.Electrostatic contribution (GBELE) and Van der Waals contribution(VDW) to the total free energy (GBTOT) upon mutation of the specific bases (GCG) for finger one (F1) with the sequence SRSDELTR. Energy changes upon mutation of the DNA triplet (GCG) specific for finger one (F1) are labeled
red. Total electrostatic energy GBELE is labeled Blue triangles. Van der Waals energy, Brick
red (squares) total energy (GBTOT), green diamond. -70.00 -60.00 -50.00 -40.00 -30.00 -20.00 -10.00 0.00 10.00 20.00 30.00 GCG GGC GTC ACG GAG TCG TGG CCG GGG en erg y ( kcal/mol ) DNA triplet GBTOT VDW GBELE
27 Figure2(b):
Loss in binding energy upon mutation of the specific base triplet (TGG) for finger two (F2)
with the sequence SRSDHLTT. GBTOT represented as green triangles and green line, GBELE
(Brick red squares and brick red line, VDW energy is labeled blue diamonds and blue line. The
wild type naturally occurring triplet TGG is labeled red in all energies. -70 -60 -50 -40 -30 -20 -10 0 10 20 30 40
CGG TGG GCG CCG GCA GCC GTA GGT GGG ATA
energ y ( kcal /m o l) DNA triplet VDW ELE GBTOT
28 Figure2(c):
Loss in binding upon base mutation of the specific sequence (GCG) for F3. GBTOT is
represented as green diamonds with green line, GBELE is represented as blue squares with blue
line, VDW energy Brick red triangles and brick red line.
The label (red diamond) represent the wild type GCG triplet. The loss in binding energy
(GBTOT) upon mutation of GCG is originated mainly in the loss in electrostatic forces
(GBELE). For F3 energies are more negative than F1 and F2. -80.00 -70.00 -60.00 -50.00 -40.00 -30.00 -20.00 -10.00 0.00 10.00 20.00
GGG GCC GCG TGG GAG CCG GCA ACG
energ y ( kcal /mol) DNA triplet GBTOT GBELE VdW
29 . Figure3A:
Plot of drop in energies of binding of finger two (F2) upon mutation of its amino acid sequence:
studied with the wild type eleven base pairs specific for F2:
GBTOT (shown as green triangles and green line). GBELE (blue diamond and blue line. VdW
(brick red squares and brick red line). GBSUR (purple( x) and purple line). The wild type finger
is shown filled with red color.
D2E means D in position 2 is replaced by E, T5L means T in position 5 is replaced by L, T6R
means T in position 6 is replaced by R. Its noticeable that GBSUR does not change considerably
upon mutation of amino acid sequence. -80 -70 -60 -50 -40 -30 -20 -10 0 10 20 R-1KT6KH3E D2E R-1K F2 H3L T5L T6R Kc al /m o l
F2 Sequence and its mutants GBELE
VDW GBTOT GBSUR
30 Figure3B: Calculation of ΔG from total energy and entropy factor
Energies of binding of finger 2 (F2) and its mutants to the 11bp WT DNA sequence: Absolute
free energies. No considerable change in entropy upon mutations was observed. GBTOT (blue).
TS (purple). ΔG = GBTOT –TS shown in green. GBTOT indicated by blue squares and blue line, TS is indicated by purple diamonds and purple line, ΔG = GBTOT –TS is indicated by the green triangles and green line
-80 -60 -40 -20 0 20 40 60 Kcal/ m o l
F2 sequence and its mutants
∆G GBTOT TS
31 Figure 3C:
Correlation between total free energy of binding ( GBTOT) and electrostatic energy (GBELE) of
amino acid residues upon mutation of finger two (F2) sequence (Bound to the wild type 11bp).
Values are taken from figure 3A. The r value of 0.99 indicates a strong correlation between the
binding energy and electrostatic energy [ see Table IV]. r=0.99 -80 -70 -60 -50 -40 -30 -20 -10 0 -30 -20 -10 0 10 to tal f ree en er gy (kcal/mo l)
Electrostatic energy (GBELE) Kcal/mol
GBELE Linear (GBELE)
32 Figure 4: Effect of mutating R-1 on binding energies
The change in free energy of binding upon mutation of the Arginine residue (R-1).Total free
energy (green line and green diamonds). Electrostatic energy (blue line and squares). Van der
Waal energy change (brick red line and diamonds). -60 -50 -40 -30 -20 -10 0 10 20 F2 R-1K R-1H R-1Q R-1E R-1D Kcal/ m o l
F2 Sequence and mutants
VdW GBELE GBTOT
33 Figure 5A: Energies of binding certain designated sequences each to its specific triplet (blue) as compared to binding the same sequence to TGG triplet (brick red).Comparison
between the free energy of binding for each sequence bound to TGG (shown in Brick red color
line and squares) compared to the free energy of binding of that sequence to its specific DNA
triplet found by experimental mutagenesis [11] (shown in blue Blue diamonds and blue line). TGG GGG GCA GGG GGG GTA GAG GTT GTG GTG GAG GCT GAT GAC -90 -80 -70 -60 -50 -40 -30 -20 -10 0 SR SD H LTT SRSD KLV R SQSGD LR R SRSD NLVR SRSD HLTR SQSSSLVR SRSD D LV R STSGSLVR SRSD KLV R SD PG ALVR SR SD EL VR STSGE LV R STSG N LVR SD PGNLVR En e ry ( K ca l/ m o l)
amino acid sequence of synthesized fingers GBTOT GBTOT/TGG
34
Figure 5B: Measured distances of amino acid residues on ZF1 from corresponding G bases
taken from the average structure of 200 snapshots: R16 = R-1, Arg22 = R6. Distances show the
binding of R-1 to N on G2(1.95Å) and R6 to N on G1 (2.00 Å).
35 Figure 5C: ZF2 binding sites obtained from average structure: the figure shows the Histidine-G
distances and Arginine-G distances in Angstroms
Binding of zinc finger F2 to DNA: R-1-- G1 (2.25 Å and 2.42Å) and H3---- G2 (2.05 Å )distances
from their G respective binding sites (TG2G1) taken from average structure of 200 snapshots.
36 Table I
: Calculated energies for zinc fingers F1, F2, and F3: Total energy released
(GBTOT) was calculated in a water box and using MM-GBSA, the net energy (
∆G)was calculated by subtracting TS from nmode calculations from the GBTOT. The contributing
forces (VDW and electrostatic) to the total energy for each finger are shown.Electrostatic
(GBELE) is greatest for F3.
VDW STD GELE STD GBTOT STD TS STD ∆G STD
F1 -39.13 4.15 -8.87 7.26 -55.22 5.98 -39.40 11.50 -15.82 12.96 F2 -30.79 4.65 -13.86 6.32 -50.47 4.83 -47.02 10.70 -3.45 11.74 F2* -27.11 4.68 -13.03 6.70 -45.42 4.73 -41.76 12.00 -3.66 12.79 F3 -32.32 3.51 -17.55 6.82 -56.44 4.70 -44.30 10.61 -12.14 11.60
• Energy for Finger 2 was calculated in second experiment
37 Table II: shows correlation (r values) of contributing forces (energies) to the total free energy of
binding (GBTOT) upon mutation of DNA triplets. Column 5shows correlation for designed
fingers bound to their designated DNA triplets (see Figure5A) as prepared experimentally by
Segal et al [11]. The strong correlation between electrostatic forces (GBELE) and total energy
released (GBTOT) is evident in all cases, also the strong correlation in column 5 between total
energy and all individual contributing energies confirms the natural selection process in
reference 11.
Correlation
coefficient of
individual energy
with GBTOT
(1)
F1/DNA
(2)
F3/DNA(MUT)
(3)
F2/DNA
(4)
Mutations in F 2
sequence
(mutant sequences based
on Segal et al [11], each
sequence bound to its
specific base triplet) as
in Figure 5A
(5)
ELE 0.78
0.69
0.3
0.89
VdW 0.25
0.294
0.21
0.63
GAS 0.78
0.71
0.295
0.88
GBSUR 0.53
0.84
0.5
0.82
GB 0.74
0.67
0.25
0.87
GBSOL 0.74
0.67
0.25
0.87
GBELE 0.78
0.61
0.85
0.872
38 Table III: Correlation Coefficients (r values) of individual energies to the absolute free energy ∆G exp for mutant sequences of finger two F2 in Figure 5A.Experimental values of ∆G were calculated using the experimentally obtained K values in reference 11 and applying the equation ∆G= -RTlnK. The low correlation because the experimental values reported error was ± 50%
Type of Energy Abbreviation
Correlation coefficient with ∆G exp[11]* ∆G predicted from MD See reference [17] ∆GMD 0.57
Total free energy of binding GBTOT 0.483
Gas phase Electrostatic energy From MM ELE 0.265
Total gas phase energy MM GAS 0.265
Van der Waal VDW 0.2
Sum of electrostatic energies from solvation and MM
energies
GBELE 0.44
Sum of polar and nonpolar contributions to solvation GBSOL 0.265
Electrostatic contribution to solvation GB 0.265
Hydrophobic contribution to solvation GBSUR 0.352
T∆S TS 0.11
• ΔG exp calculated from Kd values obtained experimentally by Segal et al [11] using
ΔG=RTlnKd
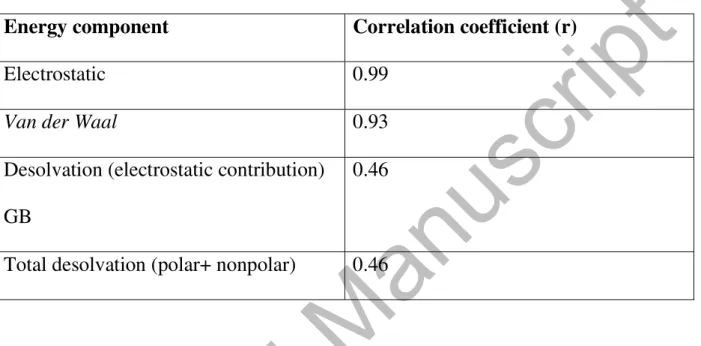
39
Table IV: Correlation coefficients (r) for different energy contributions to the total
free energy of binding (GBTOT) of F2 mutant sequences bound to the specific
naturally occurring 11bp DNA sequence (Figures 3a to 3c).
Energy component
Correlation coefficient (r)
Electrostatic 0.99
Van der Waal
0.93
Desolvation (electrostatic contribution)
GB
0.46
Total desolvation (polar+ nonpolar)
0.46
The three major contributing forces in this case are electrostatic, VdW and
hydrophobic forces.
40 Figure A supplementary material: calculated energies of different finger sequences bound to their specific DNA triplets as prepared by Segel [11]. Brick red is electrostatic energy, blue diamonds and line is VDW forces. Green triangles and line is the total energy (GBTOT).
Every point is labeled by the most important amino acids in each sequence in Red bound to their specific DNA bases, for example the first point on the left R—H---R binds G—G—G and Q---D---R binds GCA, GAG and GCG with most negative energy for GCA, see conclusion part.
GGG RHR GGG RKR GTG RKR GGA QHR GGT THR GGC THR GGC DHRGAG RNRRNGGGR GAC DNRGCC DNR GTG RSR GTC DAR GCC DAR GCC DDR GAA QNR GTA QSR GTG QSR GTT TSR GCT TER GTG RER -RER GAG RDR GCG RDR GAG GCA QDR GCT QDR GAT TNR TGG RHT -90 -80 -70 -60 -50 -40 -30 -20 -10 0 10 20 SRSD H LTR SRSD KLVR SRSD KLVR SQRAH LE R STSGHL V R STSGHL V R SD PG H LVR SRSD N LVR SRSD N LVR SD PG N LVR SD PG N LVR SRK D SLVR SD PGALV R SD PGALV R SD CRD LA R SQSSN LVR SQ SSSLV R SQ SSSLV R STSG SLVR STSG EL VR SRSD EL VR SRSD EL VR SRSD D LVR SRSD D LVR SQ SG D LRR SQ SG D LRR STSGN LV R SRSD HLTT Kca l/ m o l VDW ELE GBTOT
41 Figure B-supplementary: the energies GBTOT of synthesized sequences in Figure A supplementary were used to calculate ΔG from MD using TS and the equation ΔGMD= GBTOT- TS scattered as green triangles around experimentally obtained values from gel-shift assays by Segel [11] labeled as ΔGexp obtained from K values using ΔG= -RTlnK for different amino acid sequence arrangements
Red Bricks ΔGexp , green triangles ΔGMD , blue Diamond is GBTOT with added constant to fit the curve -100 -80 -60 -40 -20 0 20 40 Kcal /m ol GBTOT ∆GEXP ∆G MD