Riding the hype wave: Evaluating
new AI techniques for their
applicability in Earth science
Rahul Ramachandran
,
NASA/MSFC
Jia Zhang, CMU
Manil Maskey, NASA/MSFC
Tsengdar Lee, NASA/HQ
Hype Wave: The Perpetual Smart Machine
Age
“Smart machine technologies will be the most disruptive class of technologies
over the next 10 years due to radical computational power, near-endless amounts
of data, and unprecedented advances in deep neural networks that will allow
organizations with smart machine technologies to harness data in order to adapt to new situations and solve problems that no one has encountered previously.
Enterprises that are seeking leverage in this theme should consider the following technologies: Smart Dust, Machine Learning, Virtual Personal Assistants, Cognitive Expert Advisors, Smart Data Discovery, Smart Workspace, Conversational User
Interfaces, Smart Robots, Commercial UAVs (Drones), Autonomous Vehicles,
Natural-Language Question Answering, Personal Analytics, Enterprise Taxonomy
and Ontology Management, Data Broker PaaS (dbrPaaS), and Context Brokering.”
Hype Cycle for Emerging Technologies (2016)
AI Hype
Source: https://hbr.org/2016/10/machine-learning-is-no-longer-just-for-experts
Source: https://hbr.org/2016/11/the-competitive-landscape-for-machine-intelligence
Cautionary Examples
Source: https://hbr.org/2016/10/machine-learning-is-no-longer-just-for-experts
Source: https://www.theguardian.com/world/2016/mar/29/microsoft-tay-tweets-antisemitic-racism
Challenge
s
for Earth Science Informatics
•
How do we evaluate these new technologies?
• What is this new technology enabling/providing that is innovative and different?
•
Can one justify the adoption costs with respect to the research
returns?
• Since nothing comes for free, utilizing a new technology entails adoption costs that may outweigh the benefits.
• Technologies may require significant computing infrastructure in order to be utilized effectively.
AI Projects – Overview and Lessons Learned
•
Building a Knowledge Graph for Earth Science
• Rahul Ramachandran NASA/MSFC, Patrick Gatlin NASA/MSFC, Manil Maskey
NASA/MSFC; Jia Zhang, CMU; Amanda Weigel UAH, J. J. Miller, UAH
•
Evaluating deep learning technique for different applications within
Earth science using satellite imagery
Building a Knowledge Graph for Earth Science
What is a Knowledge Graph?
• Aggregates structured and detailed information about a defined topic, enabling users to resolve their query without having to navigate and
assemble information manually
• Developed by Google in 2012 to enhance the results of its search engine by systematically linking information.
Benefit
s
to NASA Earth Science
•
New knowledge/knowledge augmentation services
• Hypothesis formulation and testing:
• Automate the search for and compilation of background information • Given a topic, what hypotheses have been tested?
• What data/tools are being used to test a hypothesis? • Common paths to knowledge discovery
• Mission development/review:
• What kinds of instruments/parameters are needed to specify science objectives? • Impact of a mission by linking it with publications and dataset distribution
•
Recommendation service based on the knowledge base to broaden
usage of NASA EOS datasets and computational resources
Methodology
Earth Science Research consists of both
Structured and
Unstructured Content
How do we extract and link valuable
information from the vast distributed
heterogeneous resources?
Lessons Learned
•
Entity extraction tools work well
;
however
,
categorization of entities is
hard
.
•
Using domain control vocabularies and taxonomies help
,
but they
only get you so far
.
•
Mining for rules within sentences may work but requires extensive
number of labeled samples (training data).
Deep Learning Applications
•
Browse Imagery Retrieval Service for Different Phenomena
• Manil Maskey, NASA/MSFC
•
Study Transverse Cirrus Cloud Bands
• JJ Miller, UAH and NASA/MSFC DSIG; U.S. Nair, UAH
•
Tropical Cyclone Intensity Estimation
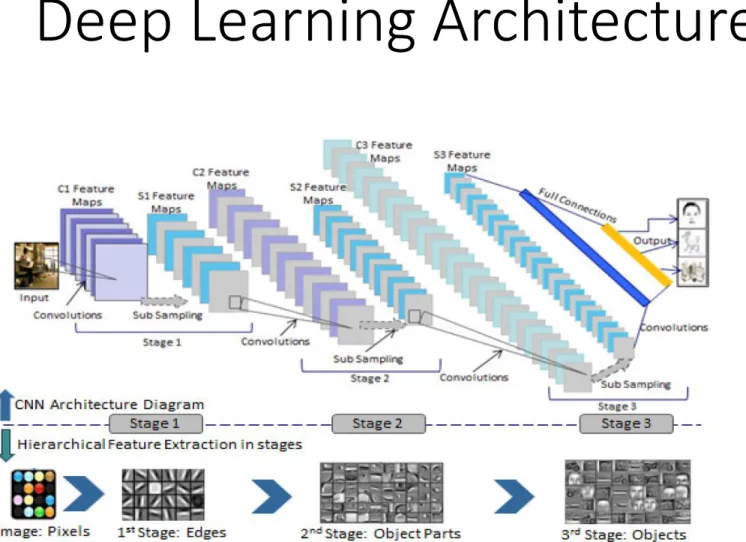
Deep Learning Architecture
•
Deep Learning
• Hierarchical Learning
• Mimics the human brain which is organized in a deep
architecture
• Processes information through multiple stages of transformation and representation
•
Key Advantage
• Automates features engineering (learns)Figure source: Katole et al., 2015 Hierarchical Deep Learning Architecture for 10K Objects Classification, Computer Science & Information Technology (CS & IT), DOI : 10.5121/csit.2015.51408
Image Retrieval Application
15
Objective:
• Test deep learning (Convolution Neural Network) to identify Earth science phenomenon in browse imagery (RGB)
Hurricane – True Positive Dust – True Positive Smoke– True Positive
Overall Accuracy = 87.88% User’s Accuracy Dust 79.72% Hurricane 97.18% Smoke 93.07% Other 76.45% Producer’s Accuracy Dust 86.45% Hurricane 92.89% Smoke 88.78% Other 80.23
Study Transverse Cirrus Bands
Transverse Cirrus Bands
• Form in and around a variety of meteorological phenomena
• Hurricanes
• Mesoscale Convective Systems (MCS) • Jet-streaks
• Associated with aviation turbulence
• Still no consensus on exactly what causes them to form
Methodology
• Gathered 5440 images (1 km MODIS RGB)
• 1741 with transverse bands • 3699 without transverse bands
• 20% were used for validation during training
• Test set consisted of 600 separate images not used in training • Use trained network to classify a one year’s worth of MODIS
Training Results
•
Model trained for 52 epochs (6
hours)
•
Highest validation accuracy
occurred at epoch 41 (0.937)
•
Testing on the test set:
• Accuracy: 94.67%
• Recall: 0.95
• Precision: 0.95
•
Class activation maps (right)
show that the network is able to
identify the regions of the image
that contain transverse bands.
Climatology Study: Spatial Distribution
•
Some interesting areas stand
out
• Eastern coast of India
• Western coast of Mexico/California
• Southeastern coast of South America
•
Eastern and Central US more
than likely due to MCSs
Tropical Cyclone Intensity Estimation
Goal
• Use deep learning to objectively estimate intensity
Dvorak technique developed in 1970s still used to estimate intensity from satellite imagery
• Inconsistent as estimation is subjective
Source: Dvorak, V. F., 1973: A technique for the analysis and forecasting of tropical cyclone intensities from satellite pictures. NOAA Tech. Memo. NESS 45, Washington, DC, 19 pp.
Image data
• US Naval Research Laboratory
(http://www.nrlmry.navy.mil/tcdat)
• 1998 to 2014
• 15 minute interval
• 98 cyclones (68 Atlantic and 30 Pacific)
Wind speed data (Truth set)
• National Hurricane Center (http://www.nhc.noaa.gov) (Best track data: HURDAT and HURDAT2)
• Hurricane Research Division
(http://www.aoml.noaa.gov/hrd/hurdat/Data_Storm.html)
Results
•
Precision – 0.80
•
Recall – 0.81
•
14,345 test images
(Atlantic + Pacific)
Lessons Learned
•
Compute intensive (requires GPUs)
•
Requires extensive amounts of training data
• Learning from a few thousand training samples is unrealistic
•
Suitable for applications where “labeled (training) data” can be
obtained from another instrument or data stream
•
For some applications transfer learning may work
• Use internal representation learned from one classification task to another
• AlexNet architecture - Krizhevsky et. al.
• Weights learned from ImageNet 1.3 million high-resolution images • State-of-the-art classification accuracy
A. Krizhevsky, I. Sutskever, and G. Hinton, “ImageNet Classification with Deep Convolutional Neural Networks,” Advances in Neural Information Processing Systems 25, Curran Associates, Inc., pp: 1097-1105, 2012.
Want more details?
Attend the following presentations
:
• Knowledge Graph: Tsengdar Lee et al.
• IN14A-08 Building Knowledge Graphs for NASA’s Earth Science Enterprise Monday, 12 December 2016, 17:45 - 18:00, Moscone West - 2000
• Deep Learning: Manil Maskey et al.
• IN52A-04 Deep Learning-Powered Insight from Dark Resources Friday, 16 December 2016, 11:20 - 11:32, Moscone West - 2000