Nadya A. Fouad, Ph.D.
Romila Singh, Ph.D.
Mary E. Fitzpatrick, Ph.D
Jane P. Liu, Ph.D.
University of Wisconsin-Milwaukee
“
There is little to no
RESPECT
for women in male-dominated fields.”
“
Still getting asked if I can handle being in a mostly male work environment
in interviews in 2009 - I’ve been an engineer for 9 years, obviously I can.
I know when I’m asked that question,
I HAVE NO CHANCE AT THE JOB
.
It
is nice they brought me in for equal opportunity survey points but don’t
waste my time if you don’t take females seriously.”
“
My current workplace is very
WOMAN ENGINEER FRIENDLY.
Women get promoted and paid
at the same rate as men.”
“
My work for many years at a U.S.
national laboratory has provided
both the flexibility and scientific/
educational environment I need.
In turn I give my professional best
while at work. It is a
WIN-WIN
.”
“
Being a blonde, blue-eyed female
DOESN’T HELP
when interviewing in
a manufacturing/plant setting.”
“
The lack of women in general, and the lack
of women mentors makes it [engineering] a
3
TABLE OF
CONTENTS
5
Executive Summary
11
Chapter 1:
Introduction
15
Chapter 2:
Participants’ Profile and Study Procedures
17
Chapter 3:
Women Who Never Entered the Field of Engineering after
Earning Their Undergraduate Degree in Engineering
23
Chapter 4:
Women Engineers Who Left the Engineering Field Over Five
Years Ago
29
Chapter 5:
Current and Former Women Engineers: Who Are They and
What Are They Doing?
35
Chapter 6:
Women Currently Working in Engineering: How are They
Faring in their Jobs and Careers?
41
Chapter 7:
Women Currently Working in Engineering: How are They
Managing Their Multiple Life Roles?
47
Chapter 8:
Women Currently Working in Engineering: How Strong is
Their Bond to the Engineering Profession and to Their Organization?
51
Chapter 9:
What Explains Women Engineers’ Desire to Leave the
Company and the Profession?
57
Chapter 10:
Summary & Recommendations
The study was conducted at the University of Wisconsin-Milwaukee (UWM) and funded with a grant by the National Science Foundation.
We would first like to acknowledge and thank the many women
engineers who so generously volunteered their time to participate
in this study. They did so with enthusiasm and commitment, often
contributing many suggestions, ideas, and comments to help us
gain a better understanding of their decisions to stay in, or leave, an
engineering career. We couldn’t have done it without them!
We thank the members of our team who were doctoral students in counseling psychology: Jane Liu, Michelle Parisot, Catia Figuereido, and Melissa Rico and, in particular, Mary Fitzpatrick, a former engineer who provided us with invaluable insights and assistance as we developed the study.
We thank the Society of Women Engineers (SWE) and all of the partner universities for their invaluable cooperation and support. We were remarkably fortunate to work with a number of Deans, Associate Deans, and Women in Engineering (WIE) Program Directors from 30 partner universities who dedicated many staff hours and resources to provide us with mechanisms to reach out to their alumnae.
We thank the members of the UWM-ENTECH (Empowering Nonprofits in Technology) team who helped to create our website and the database, and continued to help problem solve the inevitable bugs and glitches.
We thank Gina Johnson, Communications Specialist at UWM, for her creative conceptualization and design of all media associated with this project.
We thank Alfonzo Thurman, Dean of the School of Education at UWM, and Kanti Prasad, former Dean of the Lubar School of Business at UWM, for their additional financial support of the project.
We thank Patricia Arredondo, Associate Vice Chancellor of Academic Affairs, and Sammis White, Associate Dean, School of Continuing Education, at the UWM Center for the Study of the Workplace, for their support and encouragement.
We thank the media relations team at UWM, particularly Tom Luljak, Vice Chancellor, University Communications and Media Relations, Laura Glawe, Director, University Communications and Media Relations, and Laura Hunt, Senior University Relations Specialist, for their assistance with the project.
Finally, we thank our families who gave us advice, feedback, and support, especially Dr. A. A. Fouad, who is still disappointed his daughter chose psychology over engineering. This project was funded by the National Science Foundation (“Women’s Persistence in Engineering Careers: Contextual Barriers/Supports”; NSF # 0827553). Any opinions, findings conclusions, and recommendations are the authors’ and do not necessarily reflect the views of the National Science Foundation.
A
C
KN
O
WLEDGEMENT
S
© 2011-2012, UNIVERSITY OF WISCONSIN–MILWAUKEEEXECUTIVE
SUMMARY
STEMMING THE TIDE:
WHY WOMEN LEAVE ENGINEERING
Women comprise more than 20% of engineering school graduates, yet only 11% of practicing engineers
are women, despite decades of academic, federal, and employer interventions to address this gender gap.
The
Project on Women Engineers’ Retention (POWER)
was designed to understand factors related to
women engineers’ career decisions. Over 5,500 women who had graduated with an engineering degree
responded to our survey and indicated that the workplace climate was a strong factor in their decisions to
not enter engineering after college or to leave the profession of engineering. However, workplace climate
also helped to explain current engineers’ satisfaction and intention to stay in engineering.
KEY FINDINGS:
Some women left the field, some
never entered and many are currently engineers:
Those who left:
• About 11% said they left because of working conditions, too much travel, lack of advancement, or low salary.
• Approximately one-in-five women left because they did not like the workplace climate, their boss or the culture.
• Eight percent left to spend time with family.
• Those who left were not different from current engineers in their interests, confidence in their abilities or the positive outcomes they expected from performing engineering-related tasks.
Those who didn’t enter engineering after graduation:
• A third said it was because of their perceptions of engineering as being inflexible or the engineering workplace culture as being non-supportive of women.
• Thirty percent said they did not pursue engineering after graduation because they were no longer interested in engineering or were interested in another field.
• Many said they are using the knowledge and skills gained in their education in a number of other fields.
Work decisions of women currently working in engineering:
• Women’s decisions to stay in engineering are best predicted by a combination of psychological factors and factors related to the organizational climate.
• Women’s decisions to stay in engineering can be influenced by key supportive people in the organization, such as supervisors and co-workers. Current women engineers who worked in companies that valued and recognized their contributions and invested substantially in their training and professional development, expressed greatest levels of satisfaction with their jobs and careers.
• Women engineers who were treated in a condescending, patronizing manner, and were belittled and undermined by their supervisors and co-workers, were most likely to want to leave their organizations. • Women who considered leaving their companies were also very
7
EXECUTIVE SUMMARYSTUDY METHODS
In November 2009, we launched a national longitudinal study, funded by the National Science Foundation (NSF), to
investigate women engineers’ experiences in technical workplaces. To reach women who earned engineering undergraduate
degrees, we partnered with 30 universities and recruited their female engineering alumnae through e-mail and postcards.
Women recognized the importance of the study and responded enthusiastically to our survey. In fact, women from an
additional 200 universities have participated after hearing of the study in the media and through colleagues. As of August
2012, over 5,500 women have completed the survey and more than three quarters have agreed to be re-contacted in future
waves of the study.
THE PARTICIPANTS
The engineering alumnae who participated in the study consisted of 4 groups: those with an engineering undergraduate
degree who never entered the engineering field, those who left the field more than 5 years ago, those who left the engineering field
less than 5 years ago, and those who are currently working as engineers. We first report on what we learned from the first
two groups of women who are no longer working in engineering. Then, to help understand potential reasons why women left
the field, we compare current engineers with engineers who left less than 5 years ago on their perceptions of the supports
and barriers in the workplace and their perceptions of managing multiple work-nonwork roles. We only contrasted the current
engineers with those who left less than 5 years ago to provide similar time frames for comparison as well as to ensure that
recollections were recent enough to be accurate.
Women Who Left Engineering
Some alumnae never entered the engineering profession: Ten percent (N=554) of our participants had completed the rigorous training required to earn a baccalaureate degree in engineering but chose not to enter the field of engineering.
• What did they major in? The three most frequently cited majors were: Industrial Engineering, Chemical Engineering and Mechanical Engineering. Nearly half of this group of engineers earned an additional degree, primarily master’s degrees, although 11% had earned an additional B.S. degree. • Are they working?YES. Although they did not enter
engineer-ing, 4 out-of-5 of them are working in another industry. Two-thirds of the women are working in a managerial or executive position. The most frequently cited industries in which they work are: Information Technology, Education and Govern-ment/Non-profit. A quarter of the women who did not enter the field reported that they were earning less than $50,000, while another quarter reported earning between $51,000 and $100,000. Most of this group had a spouse who was also employed full time, reflected in the third of them reporting a family income greater than $150,000.
• Why did the women not enter an engineering career? The top five reasons women reported for deciding not to enter engineering were: they were not interested in engineering, didn’t like the engineering culture, had always planned to go into another field, did not find the career flexible enough, or wanted to start their own business. These reasons did not differ significantly across different age groups or years of graduation.
Some women left an engineering career more than five years ago:
• One-in-five of the participants (N=1185) started in an engi-neering career but left the field more than five years ago. • What did they major in? Similar to the women engineers
who never entered the engineering field, the top three majors earned by this group of women engineers were: Industrial Engineering, Mechanical Engineering, and Chemical Engi-neering. Almost half had earned an additional degree, most often an M.S. or M.B.A.
• Are they working?YES.All of them are currently working at least part-time, a third of them are earning over $100,000, and 54% of these women are in management or execu-tive level positions. More than one-third reported a family income of more than $100,000. The top three industries in which these women are working in are: Education, Health-care, and Consulting.
• Why did they leave an engineering career? About 10% of the women reported that they left the field to spend more time with their family. Other women reported that they lost interest in engineering or developed interest in another field, they did not like the engineering culture, they did not like engineering tasks, or they were not offered any opportunities for advancement.
“
At my last engineering job, women were fed up with the culture:
arrogant, inflexible, completely money-driven, sometimes unethical,
and intolerant of differences in values and priorities. I felt alienated,
in spite of spending my whole career
TRYING TO ACT LIKE A MAN
.”
9
EXECUTIVE SUMMARYProfile of Women Currently Working
in Engineering and Those Who Left
Less Than Five Years Ago
POTENTIAL REASONS FOR LEAVING:
The women who left engineering less than five years ago were compared to those who are still in an engineering career. Current engineers were the largest group in our study (N=3.324) while those who left less than five years ago were the smallest group (N= 279). We first compared the groups on various demographic and career-related variables.
• Are current engineers less likely to be married?NO. The groups were not significantly different in race or marital status. Both groups were about 80% Caucasian, with two-thirds married. Both groups of women were relatively evenly distributed across the different age groups.
• Are current engineers more likely to have majored in a particular area?NO. The two groups of engineers, for the most part, did not differ by disciplinary area. The top three majors for both groups were Chemical, Mechanical and Civil Engineering. • Did women leave engineering to stay home with children? A third
appear to have done so, but two thirds of the women who left are working full time in another field, and 76% of those are working in management or executive level positions.For those who are currently working, there were no significant differences between those who left and those who stayed in the average range of salary.
We next examined key psychological factors between current engineers and those who left the field. It is possible that current engineers differed from women who left engineering with regard to their levels of self-confidence, expected outcomes from performing certain tasks or underlying interests. We specifically examined confidence and expected outcomes in three critical areas that comprise a successful engineering career for women: performing engineering tasks, managing multiple work-nonwork roles and navigating the political landscape at work.
Are current engineers more likely than women who left engineering less than five years ago to:
• be confident of their abilities as an engineer or what they expect from performing engineering tasks? NO.
• be confident of their abilities to navigate the political climate or what they expect from managing these dynamics? NO.
• be confident of their abilities to manage multiple work-nonwork role demands or what they expect from managing work-nonwork multiple roles? NO.
• have interests in engineering related activities? NO.
CURRENT ENGINEERS: MANAGING
MULTIPLE WORK-NONWORK
ROLES
Are women’s perceptions of managing multiple work-nonwork roles influenced by psychological variables, such as self-confidence, or by their supervisor or other workplace factors?
• The answer was both. The three most important contributors to a current engineer’s experience of conflict between work and non-work roles was their lack of self-confidence in their ability to manage multiple work-nonwork roles, being overloaded by their current work role (including the fact that they were given too many tasks and had too much responsibility without commensurate resources) and working in an uncivil work environment that treated women in a condescending and patronizing manner.
• The use of a company’s work-life benefit policies exacerbated the conflict that engineers experienced between their multiple work-nonwork work-life roles.
• The greater the conflict experienced between work and non-work roles, the greater is the intention to leave the organization as well as the profession.
CURRENT ENGINEERS:
PREDICTING SATISFACTION AND TURNOVER
We also examined women’s perceptions of the work environment and whether those perceptions influenced satisfaction or retention. Women who left engineering differed significantly from current engineers on perceptions of the workplace climate, both in terms of supports and barriers they encountered. We examined workplace support at two levels: first, the extent to which their organizations supported their training and development, provided avenues for advancement, valued their contributions at work, and created a supportive climate for fulfilling multiple life role obligations. Second, support was assessed in terms of the extent to which the women engineers reported having a mentor, and received support from their supervisors and co-workers. We also examined two types of workplace-related barriers that could impact their levels of satisfaction as well as thoughts of leaving: workplace climate factors were captured by the extent to which supervisors, senior managers and co-workers undermined them and/or treated them in a condescending, patronizing or discourteous manner. Another set of workplace barriers focused on the extent to which women engineers lacked clarity in their roles, experienced contradictory and conflicting work requests and requirements and were overburdened with excessive work responsibilities without commensurate resources. Are current engineers more likely than women who left engineering less than five years ago to:
• experience different types of support? YES. Current engineers were significantly more likely to perceive opportunities for training and development. Interestingly, the current engi-neers reported fewer work-life benefits available to them, but were significantly more likely to have used those benefits. • have a mentoring relationship?NO. Only about one-quarter
of each group reported having a mentor and there were no differences in satisfaction with mentoring.
• encounter supportive supervisors and co-workers?YES.
• encounter role related barriers in the work environment?NO.
• encounter organizational-level barriers in the work environment?
YES. Current engineers were significantly less likely to perceive organizational barriers. They were less likely to perceive either supervisors or co-workers as undermining them, perceived less sexism in the environment, and were less likely to view organizational time demands as a barrier.
Finally, we looked at what predicts current engineers’ job and career satisfaction and their intention to leave their companies as well as the field of engineering.
• Do workplace barriers affect current women engineers’ satisfac-tion?YES. The two barriers that most negatively influenced women’s satisfaction levels were work-role uncertainly and a work environment that consistently undermined them. • Do workplace supports affect current women engineers’
satisfaction?YES. Different forms of support, such as train-ing and development opportunities, supportive co-workers, supervisors, and companies that allowed employees time to balance their multiple work-nonwork roles, were positively related to satisfaction.
• Do climate factors influence intention to leave their job?
YES. Both workplace climate and personal factors influenced intention to leave. Being undermined by their supervisors, perceiving that the organization was not supportive of them and that their managers were unwilling to accommodate their desire to balance multiple life roles, predicted their intention to leave their current organizations.
• What predicts intention to leave engineering as a career?
Feeling a lack of confidence in their ability to perform engineering tasks and manage multiple work-nonwork roles combined with not being positive about the outcomes they expected from performing engineering tasks leads women engineers to consider quitting the engineering field altogether. The other two most significant contributors to women’s intentions to quit engineering were excessive work responsi-bilities without commensurate resources and a lack of clarity regarding their work roles.
• What predicts job and career satisfaction? Perceiving that the organization is supportive and provides opportunities for advancement predicts satisfaction. Personal factors also were related to job and career satisfaction; women who reported high levels of self-confidence in navigating their organization’s political landscape and juggling multiple work-nonwork roles and who expected positive outcomes to result from their efforts to navigate the organizational climate at work, were most likely to express both job and career satisfaction. • Do psychological factors predict intention to stay better than
work environment factors?NO. Women’s intention to stay in engineering as a field and in their current organization is best predicted by a combination of psychological variables related to confidence, expected outcomes and interests, as well as supports and barriers encountered at work.
11
CHAPTER: ONE
1:
INTRODUCTION
Why Study Women Engineers?
The National Academy of Engineering has clearly shown that the U.S. needs technological expertise to be competitive in the global market and it is critical to train engineers to provide that expertise. However, research shows that women are much more likely to leave an engineering career, thus losing many of the engineers U.S. colleges are training. Wom-en are, in fact, underrepresWom-ented in the field of Wom-engineering at every level. Most of the research on effective interventions has successfully focused on increasing women’s choice of engineering major. The result is that women are now nearly 20% of engineering graduates. However, only 11% of professional engineers are women (National Science Foundation, 2011), a statistic that has not changed for nearly 20 years. In fact, the proportion of women engineers has declined slightly in the past decade, suggesting that while the pool of qualified women engineering graduates has increased, they are not staying in the field of engineering. Clearly, while our educational system is having some success at attracting and graduating women from engineering programs, women who earn engineering degrees are disproportionately choosing not to persist in engineering careers, and research has not systematically investigated what factors may contribute to their decisions.
Women’s decisions not to persist may be due to their own concerns about managing the organizational climate, performing engineering tasks or balancing work and family roles (Smith, 1993), or could be due to environmental barriers such as facing a chilly organizational climate, particularly during parenting years (Society of Women Engineers, 2007). Women may also encounter organizational barriers when they reach a juncture to move into management from engineering roles. It is, therefore, critical to understand the diversity of factors that lead some women to persist in engineering and others to leave it, as our educational system may have a role in better preparing women engineers for workforce challenges. In addition, the organizations that employ women engineers have a vital role in creating work environments that both attract and retain women engineers.
There are personal costs to choosing to leave a career for which one has trained long and hard for. There is also a societal cost to losing the potential of, or the investment in, a trained workforce, particularly at a time when there is a shortage of technological employees in the U.S. In short, it is important to understand the factors that lead to women’s choices to leave engineering so that educational and organi-zational institutions can intervene to shift those choices.
Background on Engineering
Labor Force
U.S. leadership in technical innovation has been a vigorous force behind economic prosperity for at least the last 50 years. Recent concern about declining numbers of U.S. citizens choosing to enter technical careers and the increase in technological talent and jobs overseas led Congress to ask the National Academy of Sciences to analyze the U.S. technical talent pool and make policy recommendations to advance U.S. competitiveness in global research and development markets (Committee on Science, Engineering, and Public Policy, 2007). The report effectively argues for the increased importance of technology to the U.S. economy, demonstrates global trends in research and development that favor other countries and highlights the need for concrete action to enhance U.S. competitiveness. However, while the report briefly notes that U.S. women and minorities are underrepresented in science and technology, it does not address the additional loss of women from technology careers, post-graduation, which represents a substantial loss of talent from the technical workforce.
As we note above, women are very underrepresented in the engineering disciplines. The loss of women from the profession after they complete their undergraduate degree is particularly disheartening as well as costly to the educational system, society and to women personally, given the large time, effort, and monetary investment in their education. As noted in a recent review of research on girls’ persistence in science and engineering, little is known about what happens to women
once they enter the engineering workforce (National Science Foundation, 2006). However, a report recently released by the Society of Women Engineers (2007) suggests that they leave engineering careers in part because they encounter a chilly organizational climate when they reach childbearing age and desire to balance work and family roles.
Factors Related to Employee Turnover
For any individual, the decision to persist or change careers, jobs or organizations is often precipitated by a variety of factors that influence the trajectory of the choice process. Hence it is important to capture both the more immediate predictors of that choice (such as withdrawal cognitions) as well as more distal predictors (such as attitudes towards their career and other barriers and supports) that lead to either persistence in a career or the decision to leave. By examining the antecedents of employee turnover, it is possible to gain a new understanding of some of the factors that influence individuals’ decisions to stay or leave a given career field, job or organization.
Employee turnover has been the subject of intense empirical and theoretical scrutiny for several decades and has generated an impressive body of knowledge about the withdrawal process (e.g., Griffith, Hom, & Gaertner, 2000; Lee, Mitchell, Holtom, McDaniel, & Hill, 1999; Mitchell, Holtom, Lee, Sablynski, & Erez, 2001). Turnover decision research points out that employees engage in thinking about quitting which may or may not result in actual quitting; instead these thought processes (withdrawal cognitions) may trigger alternative forms of withdrawal such as plans to search for alternative job opportunities, general thoughts or considerations of quitting, and intentions to quit (Hanisch, 1995). Withdrawal cognitions also include the concept of psychological withdrawal, which refers to a deliberate re-direction of thought processes and personal plans away from one’s current position. These cognitions are manifested in a broad, encompassing reduction of inputs to one’s current role such as absenteeism, lateness and inattention, or basic neglect of duties (Hanisch, 1995; Shaffer & Harrison, 1998). Employees who remain in the organization but are psychologically withdrawn may incur indirect costs to their organizations through reduced productivity and reduced staff morale. Further, psychological withdrawal may also be damaging to the employee in the form of diminished self-esteem, impaired relationships at work and home, and interrupted careers.
Prevailing models of voluntary turnover and accumulated research evidence indicate that withdrawal cognitions are the immediate precursors to actual, voluntary turnover decisions (Griffeth et al., 2000; Hom & Kinicki, 2001; Maertz & Campion, 2004). Withdrawal cognitions, in turn, are usually precipitated by negative evaluations about one’s job (i.e., lower job satis-faction) and lowered commitment to the organization. This is consistent with attitude theory (Ajzen & Fishbein, 1980) which posits that behavior is determined by the intention to perform the behavior and that this intention is, in turn, a function of the attitude toward the behavior. Research on voluntary turnover process has shown general support for this unfolding sequence of exit behavior: job dissatisfaction and lowered commitment progresses toward withdrawal cognitions, and withdrawal cognitions in turn, lead to turnover. Research on the relationship between turnover intentions and attitudinal variables such as job satisfaction and organizational commitment have found that both job satisfaction and commitment were negatively correlated with withdrawal cognitions (e.g., George & Jones, 1996; Hom & Kinicki, 2001; Rosin & Korabik, 1995), and withdrawal cognitions predicted turnover (e.g., Hom & Kinicki, 2001).
Despite differences in labor market behaviors by men and women, research on gender differences in voluntary turnover has been surprisingly limited. Furthermore, existing research has produced inconsistent findings. For example, some studies indicate that women and people of color tend to leave their jobs at a higher rate than Caucasian males (e.g., Cox & Blake, 1991; Stuart, 1992) while other studies report the opposite effect, turnover for males is greater than that for females (e.g., Barrick, Mount, & Strauss, 1994; Blau & Lunz, 1998). Given that withdrawal behavior progresses in these clearly identifiable stages, it is important to understand a broad range of barriers and supports that may lead to poor career commitment, psychological withdrawal and intentions to quit the organization and the engineering profession. By understanding the process that leads to turnover from engineering careers, we will be better able to design appropriate interventions that facilitate women’s decision to persist in engineering careers.
13
Women’s Preparation to
Enter STEM Fields
While we know little about the factors that predict the turnover of employed engineers, there has been research to predict initial vocational choices of engineering as a career within K-16 educational settings. This research has examined not only engineering as a career choice, but also the choices to take STEM (Science, Technology, Engineering, and Mathematics) classes that are critical to engineering education at the baccalaureate level.
Research has suggested interventions that focus on increasing girls’ participation that include promoting math/science interests (e.g., O’Brien, 1996), promoting the human-value characteristics of engineering (Eccles, 2007), increasing parental support for math and advanced classes (e.g., Burgard, 2000), promoting positive environments (e.g., Dooley, 2001), focusing on the outcome expectations of math and science (e.g., Edwardson, 1998; Nauta & Epperson, 2003) and increasing math/science and engineering self-efficacy (Mau, 2003). Colleges have also instituted systemic interventions, such as the Model Institutes for Excellence, a National Science Foundation program, that include mentoring, tutoring, targeted advising, and faculty development. And indeed, there has been a small but measurable improvement in women’s graduation rates in engineering over the last decade. For example, from 1995 to 2010, the percentage of women who have earned bachelor’s degrees in engineering has increased from 17.3% to 20.1% (National Science Foundation, 2011), and the impact of recent educational intervention ef-forts will likely be seen in coming years.
Women who do choose engineering and persist through the educational system to achieve a technical degree have demonstrated interest in their field (Davey, 2001), expect positive outcomes from their participation (Shaefers, Epperson & Nauta, 1997), possess the math, science, and engineering self-efficacy sufficient to navigate required technical coursework (Lent et al, 2003), and value the occupational characteristics of technical jobs (Eccles, 2007). Thus, one would expect that women who earn engineering degrees would be likely to persist and be successful in their careers. However, women’s representative numbers in engineering and the physical sciences decline significantly post-graduation and the occupational pipeline continues to narrow to the point that women are less and less represented over their career span (Preston, 2004; Society of Women Engineers, 2007).
Women Leave Engineering Careers
More Than Other Fields
Preston (2004) reported that all engineers leave the field at a rate four times that of doctors, three and a half times that of lawyers and judges, and 15-30% more than nurses or col-lege teachers. Specific to engineering, the Society of Women Engineers (SWE) recently reported that one-in-four women who enter engineering have left the profession after age 30, compared to one-in-ten male engineers (SWE, 2007). However, while these studies have documented that women have left the field of engineering, they have not focused on the psychological processes involved in making their decision to leave the profession. Their decision could be related to concerns with managing multiple work-nonwork roles or lack of advancement opportunities. It could be because they reach a juncture where they have to decide to enter a management career, or face the possibly limited opportuni-ties that may come with an exclusively technical engineer-ing role. It could be that they no longer enjoy the work of an engineer. It could be because they encounter a chilly organizational climate. There are many possibilities that have surfaced from anecdotal accounts but little research to offer some tangible evidence.
“
...I got to a certain point in
my engineering career when
I NO LONGER ADVANCED
.
I felt
I needed additional education
to move forward, but no topics
interested me as much as
computer programming, so I
changed my career to that.
It was a good change. I have
been more successful in the
computer field than I was in
the engineering field.”
OUR STUDY
The problem we set out to investigate was why women choose to leave engineering careers. Much of the research
on career choices has been based on the Social Cognitive Career Theory
(SCCT; Lent, Brown, & Hackett 2002). The SCCT model
has been used to help explain the factors related to initial career choice, but has not yet been studied to explain career
persistence decisions in the workplace. We extended this model to predict women’s choices related to engineering
persistence in the workplace by incorporating research related to career attitudes (career satisfaction and commitment),
psychological withdrawal and turnover intentions.
We hope that this research can help us develop interventions
(educational, organizational and/or personal) to possibly
STEM THE TIDE OF DEPARTURE AND INCREASE WOMEN’S PERSISTENCE IN ENGINEERING CAREERS
.
The results from this study may be useful to employers who seek to attract and retain talented women engineers, and in
doing so, realize their investment in their technical employees. Understanding the dynamics of women’s technical
career paths over their lifespan may also support development of interventions for university education for women, perhaps
to better prepare future engineers for challenges they will face in the workplace.
15
WOMEN IN ENGINEERING 2012 REPORT
2:
PARTICIPANTS’
PROFILE
AND
STUDY PROCEDURES
In November of 2009, we launched POWER (Project on Women Engineers’ Retention), a national longitudinal
study funded by the National Science Foundation, to investigate women engineers’ experiences in technical
workplaces. In collaboration with ENTECH (Empowering Nonprofits in Technology) at the University of
Wisconsin-Milwaukee, we developed a website for POWER, which includes information about the study
and a link to the survey. Data from the first phase of the longitudinal study have been collected and our
report is based on the findings from this first wave of participants.
Who Are The Participants?
A total of 5,562 women who graduated with a bachelor’s degree in engineering participated and completed the study. Of this, 554 (10%) women obtained a degree but never worked as an engineer, 1,464 (27%) women previously worked as an engineer but have left the field since (279 of these left less than five years ago), and 3,324 (60%) women are currently working in engineering.
WOMEN WHO GRADUATED BUT
DID NOT ENTER ENGINEERING
This group of women earned a bachelor’s in engineering but did not enter the field. This was a racially and ethnically diverse group. Women in this group include: 65% Caucasian, 18% Multi-racial, 9% Asian/Asian-American, 5% African American, 2% Latina, and less than 1% American Indian. Of those who reported their marital status, about half (46%) of the women were married, a third (29%) were not married, and a small percentage indicated that they were either not married but in a committed relationship (4%), divorced (3%), separated (<1%), or widowed (<1%).
WOMEN WHO LEFT ENGINEERING
The women in this group were separated into those who worked as engineers but left engineering more than five years ago and those who worked in engineering but left within the past five years.
Women Who Left Engineering Over Five Years Ago. This group consisted of 1,185 women, with the majority self-identifying as White (62.4%), 4.5% as Asian/Asian-American, 4% African Asian/Asian-American, 2% Latina, 26% Multi-racial, 1% other, and less than 1% identified themselves as Other and as American Indian. The majority of women in this group reported being married (67%), 22% of women were not married, 5% were divorced, 4% reported being in a committed relationship, 1% indicated they were separated from their spouse, and 1% reported being widowed. Women Who Left Engineering Less Than Five Years Ago. 279 women fell in this group, with the majority self-identifying as White (78%), then Asian/Asian-American (4%), Multi-racial (5%), Latina (3%), African American (3%), American Indian (<1%), and other (2%). About two-thirds of women in this group are married (63%), 29% reported not being married, 4% indicated they were in a committed relationship, 3% were divorced, and less than 1% of the group were either separated or widowed.
CURRENT ENGINEERS
Women who are currently working in engineering represent the largest group in the study (3,324). As with the other groups, morethan half of the women self-identified as White (56%), 3% were Asian/Asian-American, 38% indicated Multi-racial heritage, 1% African American, 2% Latina, and less than 1% as American Indian. About two-thirds of the women were married (62%), 23% reported not being married, 8% were in a commit-ted relationship, 4% were divorced, less than1% were separacommit-ted and were widowed.
HOW WERE THE VARIABLES MEASURED?
The study included a demographics questionnaire and 26 different measures that assessed factors that would influence women’s thoughts about leaving the field of engineering. The survey used well-established and validated measures designed to probe a variety of perceptions, attitudes and behaviors that could potentially influence withdrawal and turnover intentions. The survey topics included: vocational interests, job and career satisfaction, managing multiple work-nonwork roles, withdrawal intentions, commitment to the current organization and the engineering profession, availability of training and development opportunities, undermining behaviors in the work environment, and a variety of workplace support mechanisms and initiatives. When well-established measures were not available, we created new measures for this study that accurately captured women engineers’ experiences. Specifically, we developed six new measures: three domain-specific self-efficacy measures and three outcome expectations measures related to working and managing in the field of engineering. Prior to launching POWER, each newly developed scale was carefully validated through a pilot test on a separate pool of women engineers.
HOW WERE THE WOMEN SURVEYED?
To reach women who earned engineering undergraduate degrees, POWER partnered with 30 universities to recruit their female engineering alumnae through email and postcards. Women interested in participating in this study were directed to the POWER website and a link to the online survey. Recognizing the importance of the study, women not only respondedenthusiastically by completing our survey, but also contacted the POWER team to express their interest in this project and shared their personal experiences. In fact, women from an additional 200 universities participated in this study after hearing about POWER in the media and through colleagues. Over 5,500 women completed the first phase and more than three-quarters agreed to be re-contacted to participate in fu-ture waves of the study.
PARTICIPATING UNIVERSITIES
1. California Polytechnic State University, SLO 2. California State Polytechnic University, Pomona 3. California State University, Northridge
4. Cornell University
5. Georgia Institute of Technology 6. Iowa State University
7. Marquette University 8. Michigan State University
9. Massachusetts Institute of Technology 10. North Carolina State University 11. Ohio State University
12. Penn State University 13. Purdue University 14. Rutgers University 15. San Jose State University 16. Southern Illinois University 17. Stanford University
18. University of California, San Diego 19. University of Florida
20. University of Illinois 21. University of Maryland 22. University of Michigan
23. University of Missouri-Kansas City 24. University of New Mexico 25. University of Texas, El Paso 26. University of Washington 27. University of Wisconsin-Madison 28. University of Wisconsin-Milwaukee 29. University of Wisconsin-Platteville 30. Virginia Tech
17
WOMEN IN ENGINEERING 2012 REPORT
3:
WOMEN
WHO NEVER
ENTERED
THE FIELD
OF
ENGINEERING
AFTER EARNING THEIR
UNDERGRADUATE
DEGREE IN ENGINEERING
“
You have to be a bit
TOUGHER
when you are around the guys,
you feel you have to do better
than them to be accepted.”
– Caucasian Operations & Research Engineering Graduate“
I interviewed with a company where there were
NO WOMEN
working there, besides secretaries,
NO MINORITIES
and no
one in the young adult age group.”
– African American Chemical Engineering Graduate
“
I do not know why other
women leave engineering.
I got an engineering
degree because I was very
good at math & sciences
and wanted a technical &
CHALLENGING
degree.”
WHO ARE THE WOMEN WHO NEVER
ENTERED THE ENGINEERING FIELD?
Ten percent of engineering alumnae who par-ticipated in the POWER study were women who never entered an engineering field after receiv-ing a degree in engineerreceiv-ing. Of the women who never entered (n= 554), the majority (n=260, 47%) graduated between the years 2000-2010.
More than half of the POWER participants (65%) who have never entered an engineering field were Caucasian. The second largest group was participants who identified with more than one race (18%). The age of the women in the Non-Entrants group ranged from 22-66 years old. Nearly half (46%) of the women were married and 29% reported never being married. Most of the women reported having a spouse that is employed full-time. Most of the women who have never entered an engineering field are not parents (61%) and the majority of them (98%) did not care for dependents.
25
%
20
%
15
%
10
%
5
%
0
%
1983 & Prior 1984-1989 1990-1994 1995-1999 2000-2004 2005-2010 American Indian <1% Asian/Asian-American Latina 2% 5% Multi-racial 18% Caucasian 65% 9% African AmericanFigure 3.1 Percentage of Women Who Never Entered Engineer-ing Based on Graduation Year
Figure 3.2 Racial/Ethnic Background of Women Who Never Entered Engineering
19
Individual
Contributor
37%
Executive
40%
Manager
23%
CHAPTER THREEMost women (64%) who have never entered an engineering field reported working at least 40 hours per week in a current non-engineering position.
Individual salary ranged from less than $50,000 to more than $151,000. Twenty-six percent of women who never entered the engineering field reported earning less than $50,000 and 25% make $51,000 - $100,000.
Thirty percent of participants in this group reported a family total income of more than $151,000, 15% earned $101,000 - $150,000, 14% earned between $51,000 - $100,000, and 10% earned less than 50,000.
The highest percentage of women in the Non-Entrants group (40%) reported having an executive management status position. Other women in the group (23%) reported either having a manager status position or an individual contributor position (37%).
WHAT IS THE EDUCATIONAL
BACKGROUND OF WOMEN WHO
NEVER ENTERED ENGINEERING?
The top five major areas of study reported by more than half of the Non-Entrants included the following: Industrial Engineering (22%), Chemical Engineering (13%), Mechanical Engineering (13%), Electrical Engineering (10%), and Bioengineering (9%).
Nearly half (46%) of the Non-Entrants had an additional degree. Of the women who received an additional degree, 18% earned a M.S., 12% earned a M.B.A., 11% earned a B.S., and 4% earned a Ph.D.
25%
30%
20%
15%
10%
5%
0%
Individual Salary $ 151,000+ $ 150,000 $ 100,000 $ 50,000 and lessFamily Total Income
Figure 3.3 Individual and Family Income based on the Percentage of Women Who Never Entered Engineering
“
At the time I graduated no one was hiring except for the
computer consulting companies who also paid very well
compared to engineering and valued our problem-solving
skills. By the time I worked … for 5 years,
I HAD SURPASSED
my father’s salary who had worked in engineering for over
40 years.”
– Caucasian Aerospace Engineering GraduateWHAT ARE THESE WOMEN DOING NOW?
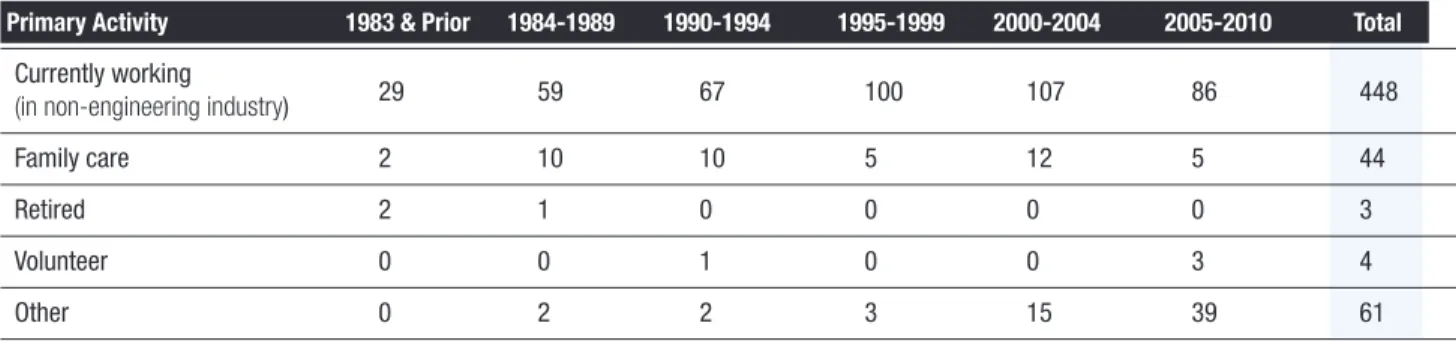
Table 3.1 Primary Activities of Women Who Never Entered Engineering (for Different Years of Graduation)
Primary Activity 1983 & Prior 1984-1989 1990-1994 1995-1999 2000-2004 2005-2010 Total
Currently working
(in non-engineering industry) 29 59 67 100 107 86 448 Family care 2 10 10 5 12 5 44 Retired 2 1 0 0 0 0 3 Volunteer 0 0 1 0 0 3 4 Other 0 2 2 3 15 39 61
Total Responses = 560
Figure 3.5 Primary Activities of Women Who Never Entered Engineering
Currently Working
(non-engineering industry)80%
Other
11%
Family Care
Volunteer 1%
8%
“
I chose to study engineering
and to pursue a Master’s in
Engineering even though I
knew that I did not want to
practice as a ‘traditional’
engineer. My first-class
education allowed me to pursue
EXTRAORDINARY OPPORTUNITIES
as a strategy consultant.”
21
CHAPTER THREEKEY FINDINGS:
80% are working full time in another field
Organizational climate was a factor in not entering engineering - lack of flexibility, didn’t like the culture, management not appealing Lack of interest cited as a reason not to enter engineering
20% never planned to enter and pursued other post-graduate degrees
“
ENGINEERING SCHOOL WAS PURE HELL
for me—my personality inspired
much sexist behavior from my male classmates and my T.A.s...
At some point, after many interviews, I decided that I wouldn’t
want to spend the majority of my waking hours with the type of
people interviewing me.”
– Caucasian Mechanical Engineering GraduateWHY DID WOMEN WITH AN ENGINEERING DEGREE NEVER ENTER THE ENGINEERING FIELD?
Table 3.2 Reasons Why Women Never Entered Engineering for Different Years of GraduationReason For Not Entering 1983 & Prior 1984-1989 1990-1994 1995-1999 2000-2004 2005-2010 Total
Couldn’t find position 1 11 3 8 13 14 50 Management not appealing 0 2 3 3 7 5 20 Too difficult 2 3 4 5 4 8 26 Low salary 1 2 8 17 11 8 47 No advancement 1 3 6 11 9 10 40 Not flexible enough 2 2 6 7 14 14 45 Never planned to enter 4 16 11 20 32 24 107 Wanted to start own business 7 14 16 21 29 36 123 Didn’t like culture 4 13 18 28 27 29 119 Not interested in engineering 9 25 24 34 46 32 170
23
WOMEN IN ENGINEERING 2012 REPORT
“
In my experience, women leave
engineering for
FAMILY REASONS
.
I left engineering when I had my
first child. I decided to stay
home with my children...we
moved to an area with very few
engineering jobs. So I decided to
go back to school and become a
math teacher.”
– Caucasian Electrical Engineering Graduate
“
[There is no] opportunity for advancement in a
male-dominated field—the culture of engineering is male-centric
with
HIGH EXPECTATIONS
for travel and little personal time.”
– Caucasian Chemical Engineering Graduate
20% wanted to start their own business
4:
WOMEN
WHO LEFT
THE
ENGINEERING
FIELD
OVER FIVE
YEARS AGO
“
There isn’t a strong network of
females in engineering. You either
need to learn to be “one of the guys”
or
BLAZE THE TRAIL YOURSELF
, which
is very difficult. I deviated from
engineering... but work now in
construction, where I am the only
female executive officer.”
Multi-racial 2% 4% 6% Other 1% American Indian <1% Asian/Asian-American Latina 2% Caucasian 85% African American
WHO ARE THE WOMEN WHO
LEFT OVER FIVE YEARS AGO?
Twenty one percent of engineering alumnae who participated in the POWER study were women who entered an engineering field after receiving a degree in engineering but left the field more than five years ago. Of the women who did not persist in engineering and left more than five years ago (n= 1185), eighteen percent (n=212) graduated prior to 1983 and an addi-tional 249 graduated between 1984 and 1989. Two-thirds of this group of women engineers (62%) was White and reported being married (67%) with 22% reporting never being married. Almost half of the married women reported hav-ing a spouse that is employed full-time. Half of the women who have left the engineering field over five years ago are parents.
25
%20
%15
%30
%35
%10
%5
%0
% 1983 & Prior 1984-1989 1990-1994 1995-1999 2000-2004 2005-2010Figure 4.2 Racial/Ethnic Background of Women Who Left Engineering Over Five Years Ago
Figure 4.1 Percentage of Women Who Left the Engineering Field More Than Five Years Ago Based on Graduation Year
25
CHAPTER FOURMore than two-thirds (67%) of the women who left the engineering field over five years ago reported working at least 40 hours per week in a current non-engineering position.
Individual salaries ranged from less than $50,000 to more than $151,000. Sixteen percent of women in this group reported earning between $101,000 -150,000 and 13% earn more than $151,000.
Forty-two percent of women in this group reported earning a family total income of more than $151,000.
More than half of the women in this group reported being in an executive management po-sition, 15% were in a managerial popo-sition, and 30% reported being individual contributors.
WHAT IS THE EDUCATIONAL
BACKGROUND OF WOMEN
ENGINEERS WHO LEFT ENGINEERING
OVER FIVE YEARS AGO?
The top five major areas of study reported by this group included the following: Industrial Engineering (21%), Mechanical Engineering (18%), Chemical Engineering (15%), Electrical Engineering (15%), and Civil Engineering (9%). Almost half (41%) of this group earned an ad-ditional degree: 24% earned a M.S., 15% earned a MBA, 9% earned a B.S., and 4% earned a M.A., and 3% earned a PhD.
Individual
Contributor
30%
Executive
55%
Manager
15%
0
%5%
10%
15%
20
%25
%30
%35%
40%
45%
50%
Individual Salary $ 151,000+ $ 150,000 $ 100,000 $ 50,000 and lessFamily Total Income
Figure 4.3 Individual and Family Income Based on the Percentage of Women Who Left Over Five Years Ago
Figure 4.4 Organizational Rank of Women Who Left Engineering Over Five Years Ago
WHAT ARE THESE WOMEN DOING NOW?
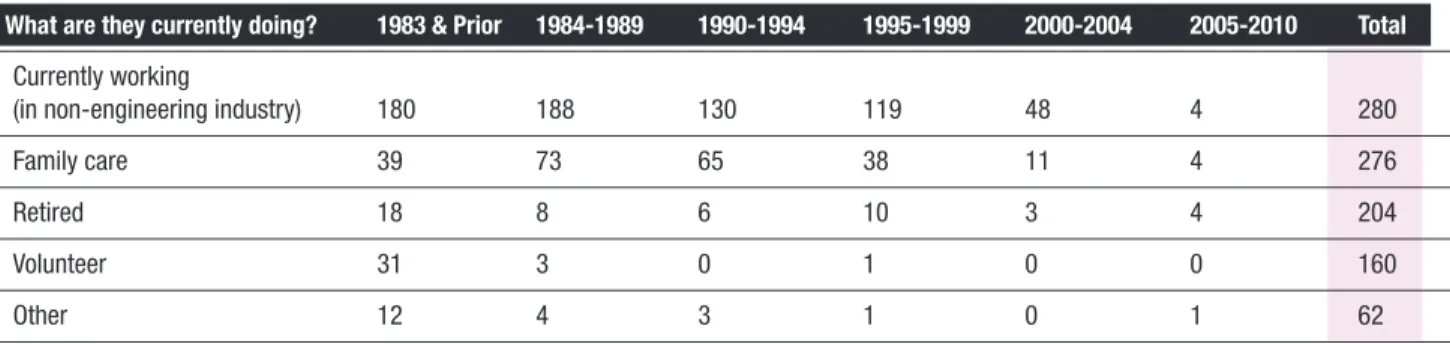
Table 4.1 Primary Activities of Women Who Left Engineering Over Five Years Ago (For Different Years of Graduation)
What are they currently doing? 1983 & Prior 1984-1989 1990-1994 1995-1999 2000-2004 2005-2010 Total
Currently working
(in non-engineering industry) 180 188 130 119 48 4 280 Family care 39 73 65 38 11 4 276 Retired 18 8 6 10 3 4 204 Volunteer 31 3 0 1 0 0 160 Other 12 4 3 1 0 1 62
Total Responses = 982
Figure 4.5 Primary Activities of Women Engineers Who Left Engineering Over Five Years Ago
Volunteer
2%
Other
Retired
Currently Working
68%
Family Care
22%
4%
4%
“
I feel that most engineering jobs are
VERY DISAPPOINTING
,
at least
as compared to the high expectations I had going in to engineering
school. School programs are advertised as “build cool stuff!”, and then
you get a job and are put in a cubicle and go to boring meetings and
are part of a team making a bracket...”
– Caucasian Mechanical Engineering Graduate“
TO ADVANCE
, it seems
as though you must be
willing and able to work
50+ hours/week; and
often be on-call 24/7.
”
27
CHAPTER FOURKEY FINDINGS:
More than two-thirds are working in another field, half of those are in executive positions
Nearly half of women left a career in engineering because of working conditions - too much travel, lack of advancement, or low salary
Thirty percent left engineering because of organizational climate
A quarter left a career in engineering because they wanted more time with family
“
[I left because I wanted] more
OPPORTUNITY FOR
ADVANCEMENT
in non-engineering positions.”
– Caucasian Mechanical Engineering GraduateWHAT WERE THE REASONS FOR LEAVING ENGINEERING?
Table 4.2 Reasons Why Women Left Engineering (For Different Years of Graduation)Reason Left 1983 & Prior 1984-1989 1990-1994 1995-1999 2000-2004 2005-2010 Total
Too difficult 2 1 0 1 0 0 4 Couldn’t find position 1 2 5 4 1 0 13 Started own business 6 9 6 2 1 0 29 Didn’t like co-workers 2 4 5 4 4 1 24 Too much travel 9 7 9 10 1 0 36 Low salary 8 12 12 11 3 1 47 Too many hours 14 13 13 8 5 0 53 Conflict with family 22 17 8 4 0 0 51 Poor working conditions 14 10 14 18 6 1 63 Didn’t like boss 15 16 15 19 7 2 74 Didn’t like culture 18 16 19 15 11 1 80 Didn’t like daily tasks 21 25 19 34 12 1 112 No advancement 32 29 34 31 8 1 135 Lost interest 21 34 32 37 11 1 136 Wanted more time with family 42 35 25 10 1 0 113
29
5:
CURRENT
AND
FORMER
WOMEN ENGINEERS:
WHO ARE THEY
AND
WHAT ARE
THEY DOING
?
“
…being a female minority, it was
DIFFICULT
to work with white men who
were much older than me and did not
share a similar background.”
– Asian American Chemical Engineering Graduate
“
The pressure is intense, and with
no viable part-time alternatives, a
woman [engineer] is
FORCED TO
CHOOSE
between work and family.”
– Caucasian Civil Engineering Graduate
“
Women leave engineering due to lack of job
satisfaction, lack of reliable female role
models, inflexible work schedules, workplace
discrimination,
WHITE MIDWESTERN MEN
syndrome,
and glass ceiling issues.”
PROFILE OF WOMEN ENGINEERS
The study was designed to understand why women engineers leave the field of engineering. For those who are currently working in engineering, we sought to gauge/assess their intentions to leave the field and to explain factors related to their satisfaction with their job and with an engineering career. We first report on two groups of women in this chapter; those who are currently working as engineers and those who left recently, less than five years ago. We chose five years as a cut-off for our comparison point to provide similar time frames for comparison as well as to ensure that recollections were recent enough to be accurate. Thus, the women who left engineering less than five years ago were compared to those who are still in an engineering career. Current engineers were the largest group in our study (N=3,324), while those who left less than five years ago were the smallest group (N= 279). As can be seen from the other chapters in this report, the women who had left engineering less than five years ago were overall the smallest group in our sample. We do not know why this might be the case. This group was distributed across age and cohort levels similar to the other groups, and we can assume that they received the email invitation to take part in the survey at the same rate as the other women in the study. It may be that their decision to leave engineering left an emotional legacy that they did not want to revisit by participating in the survey. This is a hypothesis, however, and we really do not know why their representation is the smallest. However, this group of participants was large enough to allow us to make some comparisons with women who are currently working in engineering.
We first compared the two groups on various background factors. 1984-1989 1990-1994 1995-1999 2000-2004 2005-2010
25
%
20
%
15
%
10
%
5
%
0
%
1983 & Prior 1983 & Prior 1984-1989 1990-1994 1995-1999 2000-2004 2005-201025
%
30
%
20
%
15
%
10
%
5
%
0
%
Figure 5.1 Graduation Year of Current Women Engineers
Figure 5.2 Graduation Year of Women Who Left Engineering in the Past Five Years
31
CHAPTER FIVEMost of the women who are currently working in engineering work 40 hours a week, had been with their organization for about 8 years and reported earning salaries ranging from $51,000 to $100,000. This group of women was very diverse in terms of their undergraduate engineering majors with most of them representing Chemical, Mechanical, Civil and Electrical Engineering fields.
45 44 43 42 40 39 38 37 36 0
Current Engineers Former Engineers
10 9 8 7 6 5 4 3 2 1 0
Current Engineers Former Engineers
30% 25% 20% 15% 10% 5% 0% Under 25K 25-50K 51-75K 76-100K 101-125K 126-150K 151-175K 17-200K Over 201K
Current Engineers Former Engineers
Figure 5.3 Hours Worked of Current Engineers and Former Engineers (per week)
Figure 5.5 Total Compensation for Current Engineers and Former Engineers (salary, bonuses, stocks, & commissions)
Figure 5.4 Tenure of Current Engineers and Former Engineers with Current Organization (years)
About half of them are individual contributors in their organization while one-third are in project management positions. The least common positions occupied by these engineers were in executive roles (16%). Consistent with the percentage of individual contributors, about half of the engineers were not in a supervisory role. For those in management positions, a majority of engineers in this group supervised between one to four individuals. Most worked in groups that were predominantly male with a smaller number (15%) reporting working in gender balanced groups.
There were no significant differences between women who are currently working in engineering and those who left engineering less than five years ago in terms of the hours worked (39 hours/week) or length of tenure with their company (10 years), but they were different in average range of salary reported (between $51,000 and $75,000), and both groups were likewise most likely to have graduated with chemical, mechanical, civil, and electrical engineering degrees.
Unlike women who are currently working in engineering, women who left engineering were more likely to report being in management and executive position (53.8%) and project management roles (21.9%). The least common positions occupied by these engineers were non-management roles (24.4%). Unlike women who are currently in engineering, the majority of women who left less than 5 years ago were in an executive role.
70% 60% 50% 40% 30% 20% 10% 0%
All Women Mostly Equal # Mostly All Men Women of Men & Men
Women
Current Engineers Former Engineers
“
It is hard to justify the long hours to go nowhere.”
– Caucasian Industrial Engineering Graduate
60
%50
%40
%30
%20
%10
%0
% IndividualContributor Project orProgram Manager
Executive
Current Engineers Former Engineers
Figure 5.6 Management Rank of Current Engineers and Former Engineers
Figure 5.7 Gender Make-up of Co-workers for Current Engineers and Former Engineers
33
CHAPTER FIVEFor those in management positions, the majority indicated that they had 1 to 4 direct reports and were most likely to work in groups that were predominantly male; however, a larger number who left engineering (26%) reported working in gender balanced groups.
Current women engineers in our sample were no less likely to be married as their counterparts who left engineering less than five years ago, but less likely to be parents. Neither did the two groups of women differ in terms of their race, which was predominantly Caucasian. Both groups of women were relatively evenly distributed across the different cohort (or graduation groups).
50% 40% 20% 15% 10% 5% 0% 0 1 - 2 3 - 5 6 - 10 11 - 24 25 - 50 50 - 100 over 100
Current Engineers Former Engineers
Other 2% 3% 8% Multi-racial Asian/Asian-American Latina Caucasian 79% African American 3% 3% 8%
African American 2% Multi-racial
American Indian <1% Asian/Asian-AmericanLatina Caucasian 84% Other 1% 3% 3%
Note: All figures are rounded to the closest percentage point.
Figure 5.8 Number of Direct Reports for Current Engineers and Former Engineers
“
[I] worked in a department for 4 years—in that time,
three people out of fifty got promotions—all men. Then
only the women and elders got laid off. Senior VP couldn’t
even handle saying hello to females in the hallway. His
AWKWARD OLD SCHOOL TENDENCIES
made him unable to
consider females as equals. This was at a company with
90% female employees throughout the company; just a
lack of females in the engineering group.”
– Caucasian Industrial Engineering Graduate
“
Most of management is a male-dominated culture
(male conversation topics, long hours, demanding
lifestyle, career-focused expectations). … Women
usually choose to leave
WITHOUT FIGHTING THE UPHILL BATTLE
to make improvements. It is a self-sustaining cycle!”
– Asian-American Operations Research and Engineering GraduateKEY FINDING:
Current and former engineers do not differ in marital or parental status, engineering major, salary level, or number of direct reports.
35
6:
WOMEN
CURRENTLY
WORKING
IN
ENGINEERING:
HOW ARE THEY
FARING
IN THEIR
JOBS
AND
CAREERS
?
“
We are often executing other’s
orders and decisions, and the
OPPORTUNITIES FOR ADVANCEMENT
within the organization, to be
a leader or impact business
decision making, are slim.”
– African American Mechanical Engineering Graduate“
There’s still a bit of an
“BOYS CLUB”
mentality around, even with younger
engineers and non-engineer women. Some older male engineers certainly
think that females shouldn’t be engineers, or that it’s “cute” when they
are, like it’s an amusing phase she’s going through, instead of a career…”
– Caucasian Civil Engineering Graduate