FULL LENGTH ARTICLE
Modeling minimum temperature using adaptive
neuro-fuzzy inference system based on spectral
analysis of climate indices: A case study in Iran
Hojatollah Daneshmand
a,*
, Taghi Tavousi
a, Mahmood Khosravi
a, Saeed Tavakoli
ba
Department of Climatology, University of Sistan and Baluchestan, Zahedan, Iran
bDepartment of Electrical Engineering, University of Sistan and Baluchestan, Zahedan, Iran
Received 2 April 2013; accepted 4 June 2013 Available online 11 June 2013
KEYWORDS
Spectral analysis;
Monthly minimum tempera-ture;
Climate indices;
Adaptive neuro-fuzzy infer-ence system;
Fast Fourier transform
Abstract Nowadays, a lot of attention is paid to the application of intelligent systems in predicting natural phenomena. Artificial neural network systems, fuzzy logic, and adaptive neuro-fuzzy infer-ence are used in this field. Daily minimum temperature of the meteorology station of the city of Mashhad, in northeast of Iran, in a 42-year statistical period, 1966-2008, has been received from the Iranian meteorological organization. Adaptive neuro-fuzzy inference system is used for model-ing and forecastmodel-ing the monthly minimum temperature. To find appropriate inputs, three approaches, i.e. spectral analysis, correlation coefficient, and the knowledge of experts,are used. By applying fast Fourier transform to the parameter of monthly minimum temperature and climate indices, and by using correlation coefficient and the knowledge of experts, 3 indices, Nino 1 + 2, NP, and PNA, are selected as model inputs. A hybrid training algorithm is used to train the system. According to simulation results, a correlation coefficient of 0.987 between the observed values and the predicted values, as well as amean absolute percentage deviations of 27.6% indicate an accept-able estimation of the model.
ª2013 Production and hosting by Elsevier B.V. on behalf of King Saud University.
1. Introduction
human beings have invariably been closely in touch with weather events. Owing to this fact, identification of the factors affecting long-term and short-term weather changes and also climate fluctuations is of particular importance. Since temper-ature is one of the most fundamental elements of climate for-mation and its changes may transform the weather patterns in any region, a large segment of climatology researches has been earmarked to the investigation of the temperature behavior in
different time and location scales (Rosenberg et al., 1983;
Smith et al., 2006; Majnooni-Heris et al., 2011). Temperature
* Corresponding author. Tel.: +98 9133414438; fax: +98 157553490.
E-mail address:[email protected](H. Daneshmand).
Peer review under responsibility of King Saud University.
Production and hosting by Elsevier
King Saud University
Journal of the Saudi Society of Agricultural Sciences
www.ksu.edu.sa
www.sciencedirect.com
1658-077Xª2013 Production and hosting by Elsevier B.V. on behalf of King Saud University.
is one of the essential parameters of the weather and one of the few measurable thermodynamic variables. Modeling and pre-diction of temperature and particularly minimum temperature are of special importance in the fields of agricultural climatol-ogy, glaciation and frost management, water resources plan-ning and management, irrigation networks, tourism and everyday life issues. Weather transformations are extremely vol-atile. These changes lead to the emergence of weather patterns and forms of weather flows which occur in different time scales. Large-scale transformations and synoptic factors have a great effect on temperature and the minimum temperature event is more related to transformation factors. Teleconnection patterns may be used in order to study and identify minimum tempera-ture variations in short-term and long-term periods. The reason is the fact that teleconnection patterns can be in a way indicative of these large-scale transformations. Understanding the causes and the identity of climate changes is one of the most significant purposes of gathering climatology data and monitoring climato-logical phenomena. In this regard, climatoclimato-logical fluctuations caused by teleconnection patterns have taken on tremendous importance. Teleconnection is one of the climatic characteristics in the global scale. By means of this mechanism, the changes that occurred in the temperature or pressure pattern in a region of the Earth are transferred to other regions using large-scale systems and they affect weather conditions in different ways (Osborn,
2006, 2011). Teleconnection patterns typically possess
fluctuat-ing low-frequency behavior and they are used in order to fore-cast the average weather conditions during several-month or annual time periods. Figures indicating teleconnection patterns are called climate indices. Hence, it is crucial to study minimum temperatures according to these indices which represent the interaction of weather and environmental patterns and can play an important role in identifying short-term and long-term behaviors of monthly minimum temperature and the modeling thereof.
One of the important aspects of the analysis of time series is spectral analysis which deals with the analysis and decomposi-tion of time series to components with different frequencies. Alternation and hidden cycles in the behavior of the climatic parameters are revealed in this method.Taghavi et al. (2011) presented a climatological regionalization for 65 synoptic sta-tions of the Iranian Meteorological Organization using the spectral analysis method and clusterization. The spectral anal-ysis method was used to investigate average temperature in northwestern Iran. According to the research findings, the tem-perature of the region contained a two-and-a-half-year period
(Asakereh, 2010). The entire physical processes of the soil are
directly or indirectly dependent on temperature. The daily and annual estimations of the soil temperature were carried out in different depths in six stations located in western Iran using the Fourier series analysis. In this research, the air temperature (2 m high) was merely used.
A review of different references indicates the existence of numerous models for the prediction of minimum air tempera-ture which are used in order to investigate the solutions to combat the threat of frost and glaciation (Allen, 1957). Predic-tion of average daily temperature was carried out in Turkey using artificial neural networks (Dombayci and Go¨lcu¨, 2009). The adaptive neuro-fuzzy inference system is used as a new method for prediction (Jang, 1993). Air temperature forecast in northwestern Iran was carried out using a neuro-fuzzy
infer-ence system (Darbandi and Arvanaghi, 2009). Nayak et al.
(2004, 2005)used intelligent systems in order to model
precip-itation-runoff. The results demonstrated that the non-linear model of precipitation-runoff is much more efficient in the adaptive neural-network-based fuzzy inference system,
com-pared to independent neural and fuzzy systems. Rojas et al.
(2008), Zounemat-Kermani and Teshnelab (2008), Wang
et al. (2009), and Firat et al. (2009)separately compared the
capability of ANFIS in predicting time series with that of other intelligent systems. The results indicated much better efficiency of this system compared to other intelligent systems. The adap-tive neuro-fuzzy inference system was used to estimate daily evaporation in eastern Iran (Moghaddamnia et al., 2009a,b). In another research, meteorological parameters effective in the solar radiation level were determined using gamma test. The forecast of solar radiation level was then carried out using artificial neural networks and the adaptive neuro-fuzzy infer-ence system (Moghaddamnia et al., 2009a,b). Ustaoglu et al.
(2008)used three different intelligent system methods in order
to predict minimum, maximum and daily average temperature.
Kisi and Ozturk (2007)estimated the water requirement of the
reference plant using the ANFIS system. Forecasting autumn droughts in eastern Iran was carried out using different input variables. Climatic indices, precipitation and the drought index were used as the input variables of the ANFIS system. The in-put variables were introduced to the model with zero-, one-, two-, and three-month delays. The results showed that appro-priate inputs are different for different delays and using a
cer-tain input will not lead to optimum modeling (Hosseinpour
Niknam et al., 2011). Among other researches in this context,
the studies byCoulibaly et al. (2005) and Drake (2000)may be pointed out. Since temperature is one of the fundamental fac-tors in climate formation and its changes can transform the weather patterns in any region, researchers have always paid attention to its prediction and estimation. To this end, numer-ous methods including intelligent systems such as the ANFIS system have been developed. This research aims at predicting the monthly minimum temperature of the region under study in order to combat frost and glaciation and the incidents caused by this environmental hazard. The appropriate inputs for the model were initially selected and then, the ANFIS sys-tem was used to forecast the monthly minimum sys-temperature.
2. Material and methods
In this research, the statistical data pertaining to the monthly minimum temperature of the meteorology station of the region under study was used for modeling. The daily minimum tem-perature of the station was received from the Iranian Meteo-rology Organization for the 42-year statistical period since 1966–2008. Afterward, the monthly minimum temperature was extracted (1). The monthly values for 13 teleconnection indices were also extracted from the website of the National Oceanic and Atmospheric Administration in the same statisti-cal period. The specifications of the station of the region under study are demonstrated inTable 1. In the subsequent step, the
Table 1 Specifications of the station under study.
Latitude Longitude Elevation
spectral analysis of the monthly minimum temperature and 13 teleconnection patterns was conducted using fast Fourier transform.
2.1. Fast Fourier transform
A proper mathematical transformation can be used for spec-tral analysis. From a general point of view, the purpose of applying a mathematical transformation to a series is to obtain extra data which are initially unavailable in the series. In most of the processing approaches, what is meant by the initial raw series is the respective series in the time domain. Most of the series, which are used, are practically in the time domain. In other words, the observations of the series are time-dependent, aside from what the respective series measures. It is obvious that this sort of representation is not the best for the descrip-tion of a series. In many cases, the useful informadescrip-tion of the series is hidden in its frequency contents, which is called the series spectrum. The spectrum of a series demonstrates the fre-quencies existing in that series. Fourier transforms are proper tools to measure the frequency contents of a series. In the 19th century, a French mathematician called Joseph Fourier dem-onstrated that every periodic function may be written in terms of an infinite summation of basic sine and cosine functions or a
complex exponential function (Cartwright, 1961). This idea
was generalized to other functions under the title of Fourier transform. Discrete Fourier transform should be used for dis-crete data. Due to lengthy calculations in the disdis-crete Fourier transform method, a new algorithm called fast Fourier trans-form (FFT) may be used. This transtrans-formation is much faster than the discrete Fourier transform method in terms of calcu-lation. The Fourier transform of the time seriesx(t) is obtained via the following relation:
XðtÞ ¼X
n
xðtÞej2pntt ð1Þ
wheretrepresents time andtis frequency. The reverse of the Fourier transform is expressed as follows:
xðtÞ ¼X
n
XðtÞej2pntt ð2Þ
The exponential term is written as follows:
ej2pntt¼cosð2pnttÞ þjsinð2pnttÞ ð3Þ
Thus, what actually happens in a Fourier transform is multi-plying the time series by a complex exponential function or a
combination of two periodic functions with the frequencyt.
In the next step, all of these products are added to one another. Finally, if this finite addition leads to a large number, it is said
that x(t) has a prominent frequency component in the
fre-quencyt. If the summation is a small number, it is said that
thet frequency component is not dominant in this series. If
the addition equals zero, it suggests that this frequency does not exist in the series. The spectral analysis of the monthly minimum temperature and patterns was conducted using fast Fourier transform. The teleconnection patterns used in model-ing are demonstrated inTable 2.
Using the expert’s knowledge and mathematical methods are two general methods of choosing appropriate inputs for a model. In this research, the most important criterion for selecting patterns is having a prominent frequency component with a period equal to that of the monthly minimum
tempera-ture. The four indices Nino1 + 2, NP, PNA, and EAWR were selected from among thirteen indices by applying fast Fourier transform.
2.2. Fuzzy inference system
Fuzzy logic theory is a powerful and flexible tool for modeling the uncertainties and the implicitness in the real world. It is a very difficult task to gather precise information and data in or-der to describe the behavior of natural systems. Therefore, as the complexity of systems increases, precise mathematical modeling appears to be impossible. As system complexity in-creases, the precision of the mathematical model decreases and it reaches a point where no acceptable comment may be made with respect to the dynamicity of the system. Fuzzy cal-culation is an answer to such complicated problems. Fuzzy sys-tems may be considered as non-linear dynamic syssys-tems which are able to estimate real systems using empirical data and are based on numerical calculations with particular precision, no matter how complex the systems are. On the whole, this new theory simulates an expert by formulating uncertainties and intuitive issues which are extracted from the expression of skills and the method of learning. The ability to implement hu-man knowledge using linguistic concepts and labels and fuzzy rules, non-linearity, the ability to compromise, and better accuracy compared to other methods when there is a limitation of data among the most important features of fuzzy systems. On the other hand, artificial neural networks have the ability to learn and to receive instructions using different patterns. These networks may be used in interpolation, forecasting, clas-sification, etc. As a matter of fact, the application domain of artificial neural networks is very extensive. Perhaps the most significant advantage of these networks is their enormous power. Neural networks are of different types, but all of them are comprised of two components:
1. A set of nodes. Each node is in fact a calculation unit of the network which receives the inputs and processes them to produce outputs.
2. Connections among the nodes: These connections deter-mine the way in which information is transferred among the nodes.
The interaction among the nodes through these connections causes the network to demonstrate a general behavior not ob-served in any individual element of the network. If the node is considered as an artificial neuron in a network, this network is called an artificial neural network, in short ANN. Thus, if fuz-zy logic operators are introduced into neural networks and training and classification of neural networks are used in fuzzy systems, then the defects present in neural networks and fuzzy systems may be remedied. These systems are known as adap-tive neuro-fuzzy inference systems (ANFIS). The adapadap-tive neu-ro-fuzzy inference system is among the methods used in
Table 2 Variables used in modeling.
The pattern of boundary values of the temperature of the region Nino
Nino1 + 2
Mild pattern/North America PNA
analyzing natural phenomena and investigating input–output relationships in multi-parameter systems. Developed by Jang in 1993, neuro-fuzzy models combine fuzzy systems with arti-ficial neural networks in order to facilitate learning and adap-tation. It should be noted that the main problem upon designing and using fuzzy systems is to obtain fuzzy rules or ‘‘if-then’’ sentences, which are expressed by experts. Using the learning ability of artificial neural networks effectively in order to generate these rules automatically and optimize the parameters, resolves the major problem in designing fuzzy
sys-tems. Hence, the adaptive neuro-fuzzy inference system is a hy-brid model composed of fuzzy and artificial neural models. Adaptive networks are feed forward neural networks with the capability of supervised learning. An adaptive network is a network structure comprising nodes connected to each other and directional connections. Moreover, a part or all of these nodes is adaptive. In other words, the output of each node de-pends on the parameters pertaining to the nodes and the learn-ing rule determines how much these parameters will be changed in order for the model error to be at a minimum. The adaptive neuro-fuzzy inference system enjoys the advan-tage of being able to receive fuzzy rules from the expert’s knowledge and build a rule base adaptively. This system makes use of neural networks and fuzzy logic in order to design a non-linear mapping between the input and output space. In summary, it can be stated that the adaptive neuro-fuzzy infer-ence system is considered as a powerful, appropriate, and flex-ible tool for modeling uncertainties and implicitness present in the real world and expressing linguistic terms adopted from human experience and knowledge in the form of mathematical relations.
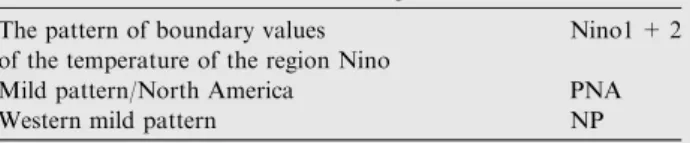
The architecture of the ANFIS is shown inFig. 1. The AN-FIS consists of five layers including, the fuzzy layer, product layer, normalized layer, de-fuzzy layer and total output layer.
Figure 1 ANFIS architecture.
(a)
(b)
(c)
(d)
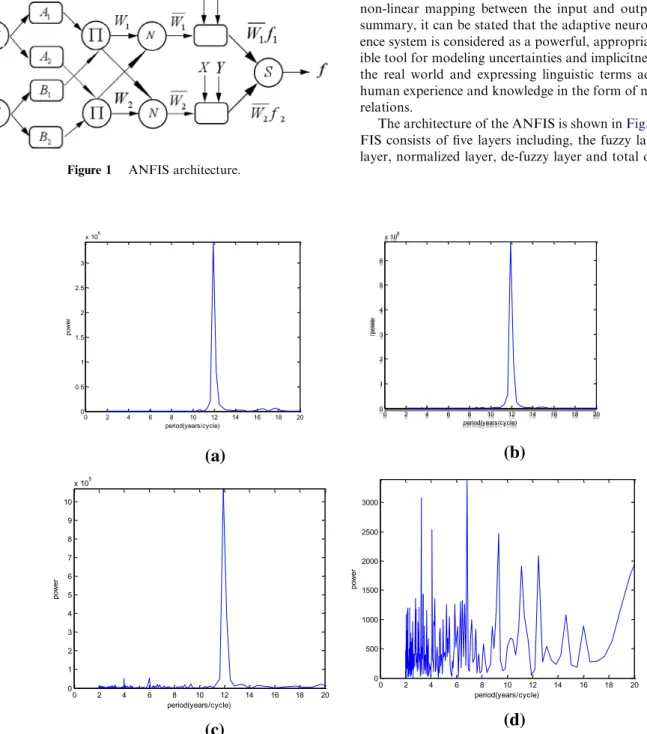
0 2 4 6 8 10 12 14 16 18 20 0 0.5 1 1.5 2 2.5 3 x 10⁵ pow e r period(years/cycle) 0 2 4 6 8 10 12 14 16 18 20 0 1 2 3 4 5 6 x 10⁶ pow er period(years/cycle) 0 2 4 6 8 10 12 14 16 18 20 0 1 2 3 4 5 6 7 8 9 10 x 105 pow e r period(years/cycle) 0 2 4 6 8 10 12 14 16 18 20 0 500 1000 1500 2000 2500 3000 pow er period(years/cycle)Figure 2 Diagram of spectrum power in terms of period, (a) minimum temperature, (b) Nino1 + 2 index, (c) NP index, and (d) PNA index.
In the first layer (fuzzy layer),xandyare the inputs of adap-tive nodesAiandBi, respectively.AiandBiare the linguistic
la-bels used in the fuzzy theory for describing the membership functions. The outputs of layer 1 are the fuzzy membership de-gree of the inputs which can be expressed as given below:
O1i ¼lAiðxÞ; i¼1;2;. . .;n ð4Þ
O1
i ¼lBiðyÞ; i¼1;2;. . .;n ð5Þ
where lAiðxÞ andlBiðyÞ denote the membership functions
degree.
Second layer is the product layer that consists of two fixed
nodes labeled with P. The outputw1 andw2are the weight
functions of the next layer. The outputs of this layer can be represented as:
O2i ¼wi¼lAiðxÞlBiðyÞ; i¼1;2;. . .;n ð6Þ
whereO2i is the output of layer 2.
The third layer is the normalized layer, whose nodes are also fixed and labeled with N. The outputs of this layer can be represented as:
O3i ¼wi¼wi=
Xn
i¼1
wi; i¼1;2;. . .;n ð7Þ
whereO3i is the output of Layer 3.
The fourth layer is the defuzzification layer. In this layer, the nodes are adaptive nodes. The relationship between the in-puts and output of this layer can be expressed as given below:
O4i ¼wiðpixþqiyþriÞ i¼1;2;. . .;n ð8Þ
whereO4i is the output of Layer 4 andpi,qiandriare the
con-stant parameters of the node.
The fifth layer is the output layer, whose node is labeled with S. This node performs the summation of all incoming sig-nals, which represents the results of cleaning rates. The overall output of the model is given by:
O5i ¼X
n
i¼1
wifi i¼1;2;. . .;n ð9Þ
whereO5
i is the output of layer 5 and the output of the system.
Different methods may be employed in order to predict and estimate monthly minimum temperature. The existence of numerous parameters affecting climatic components and the lack of a straightforward definition of the climate phenomena denote uncertainty and implicitness in the real world.
Table 3 Correlation coefficient for the PNA index and the seven climate indices used in the spectral analysis.
Indices AO Nino3,4 Nino3 Nino4 NOI NP PDO
PNA 0.190 0.145 0.099 0.127 0.208 0.352 0.305 Nino1+2 (7) PNA (7) NP (7) f(u) out1 (7) ANSFIS (sugeno) 7 rules
Figure 3 Simple structure of adaptive neuro-fuzzy inference model.
Table 4 Specifications of the fuzzy inference system.
Type Sugeno
Decision method for fuzzy logic operators AND (intersection)
Product Decision method for fuzzy logic
operators OR (union)
Probabilistic or
Output combination method (Defuzzification) Weighted average
Number of membership functions for input #1 7 Number of membership functions for input #2 7 Number of membership functions for input #3 7
Type of membership functions Gaussian
Number of rules 7
Output function Linear
Number of training epochs 100
0.004 0.006 0.008 0.01 0.012 0.014 0.016 5 12 30 48 90 Epoches
Mean square error
Figure 4 The curve of network error convergence of ANFIS.
Figure 5 Diagram of minimum temperature observed values (MTO) and those predicted (MTP) by model.
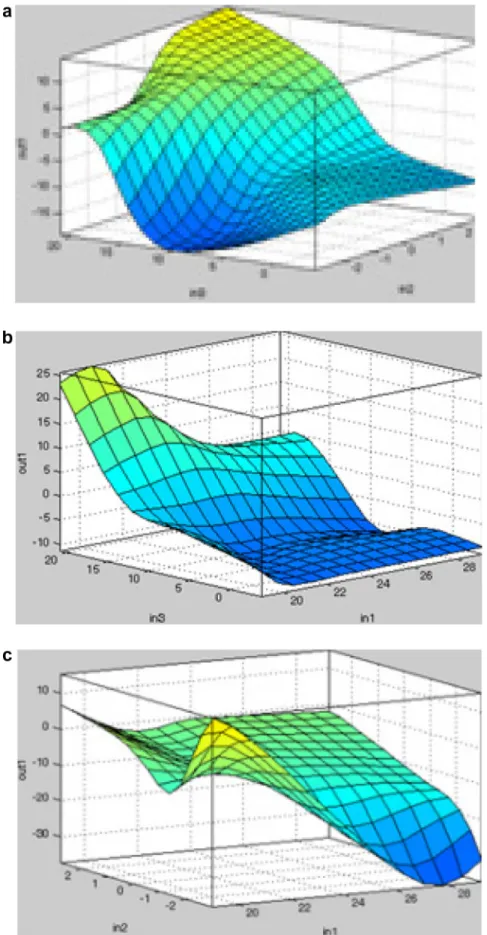
Figure 6 Diagram of relationship between different input variables (three climate indices) and output (minimum temperature): (a) NP and PNA index, (b) Nino1 + 2 and NP index, and (c) Nino1 + 2 and PNA index.
Therefore, the adaptive neuro-fuzzy inference system is one of the most appropriate modeling methods for predicting monthly minimum temperature. The following points are a number of its advantages (MATLAB):
Non-linear structure and combining fuzzy inference system with artificial neural networks.
Learning ability of the network with hybrid learning algorithm.
Ease of using the network after design and training.
2.3. Data normalization
In general, the adaptive neuro-fuzzy inference network is not particularly sensitive to non-normal inputs. However, normal-ized data are usually used for optimal modeling. In this re-search, the data are normalized between zero and one. The following relation was used for normalization:
xN¼
xmaxxi
xmaxxmin
ð10Þ
wherexNdenotes the normalized value of the input quantity.
The input data matrix of the model consists of 516 rows and 3 columns. In other words, the number of observations used equal 1548 data. The percentage of the data used for training and testing were 70 and 30, respectively.
3. Results and discussion
In this research, prominent frequencies of the monthly mini-mum temperature of the Mashhad meteorology station were obtained together with thirteen climate indices using fast Fou-rier transform. The three climate indices Nino1 + 2, NP, and PNA were selected as input parameters to create the ANFIS model using expert’s knowledge and correlation coefficient. The diagram of spectrum power in terms of the period of the monthly minimum temperature and three climate indices is de-picted inFig. 2. The spectrum power value is used to compare the frequencies in each diagram and also to compare two dia-grams with each other.Fig. 2illustrates the period in terms of year and the spectrum power value in the dominant frequency for the monthly minimum temperature and three climate indices.
The Nino1 + 2 pattern from the region Nino with a period equal to that of the monthly minimum temperature was se-lected as the first input of the model. The period of the NP pat-tern was also equal to that of the monthly minimum temperature (Figs. 2-b and -c). The EAWR index has a period close to that of the monthly minimum temperature in domi-nant frequency. The correlation of this index with other indices is not considerable. The period of the PNA index approxi-mately equals half of that of the monthly minimum tempera-ture. The PNA pattern possesses at least eight considerable frequency components. Using the PNA pattern causes the model to be optimum, because different frequencies exist in this pattern (Fig. 2-d). The correlation of this index with the seven climate indices used in the spectral analysis is also one of the other reasons of choosing this index in modeling the
monthly minimum temperature.Table 3shows the correlation
coefficients.
The monthly minimum temperature has a period or cycle of approximately 12 years. This indicates the fact that tempera-ture conditions repeat themselves every 12 years. The two indi-ces Nino1 + 2 and NP also have a similar period of almost 12 years. The spectrum power value for the prominent and
considerable frequency in Fig. 2-a–c is almost equal. The
monthly minimum temperature lacks other periods, while the two indices Nino1 + 2 and NP have other periodic fluctua-tions as well. The NP index has periods of almost 4 and 6 years. These cycles have lower spectrum power. Thus, they may be overlooked.
Hence, the Nino1 + 2 and NP indices almost fully overlap with the monthly minimum temperature. The PNA index also has several periods with considerable powers. Care should be taken when using fast Fourier transform regarding the fact that the number of data used for the spectral analysis of the climate parameter should equal an integer exponent of the number 2. That is why the four initial data of climate indices and minimum temperature were left out. This means 512 data from each climate parameter were used in the spectral analysis. In case the number of data does not equal an integer exponent of the number 2, other observations are considered as zero and the spectral analysis faces a problem. The simple structure of the model is demonstrated inFig. 3.
The training data set was used to train the ANFIS, while testing data set was used to verify the accuracy and the effec-tiveness of the trained ANFIS model for the computation of the date quality evaluation. Fuzzy system is implemented using the fuzzy inference system properties (Table 4).
In this study, we use the proposed method to train the in-put–output relation according to training data set. In the train-ing phase the ANFIS firstly makes the suitable membership functions for each input. In the sequel, the membership func-tions are tuned according to error correction training method by using the BP algorithm. Also, the constant parameter of the linear output functions is adapt during the learning phase based on LMS algorithm. ANFIS model utilizes 100 training data over the 90 training periods. At the end of the training phase, the network error convergence curve (mean square
er-ror) of ANFIS was derived as shown inFig. 4.Fig. 5shows
the diagram of the observed values for the monthly minimum temperature and the calculated or predicted values using the ANFIS model.
High correlation coefficient (0.987) between the observed values and the values predicted by the model and the Mean Absolute Percentage Deviations equal to 27.6 indicate an acceptable estimation of the model.
Fig. 6depicts the input–output surface yielded. This pattern
is capable of investigating the relationship among input vari-ables. The respective surface is a complicated one, but it is evi-dent that the surface is a combination of two input planes, each of which is determined by an output equation of a fuzzy rule.
4. Conclusion
In this research, the three climate indices Nino1 + 2, NP, and PNA were chosen as input parameters to create the ANFIS model in order to estimate and forecast monthly minimum tem-perature in the Mashhad meteorology station. Three properties were taken into consideration upon selecting the model inputs:
Having a frequency (period) identical or close to that of the monthly minimum temperature.
Selecting model input patterns from different areas based on Knowledge of experts.
Having a significant correlation coefficient with other cli-matic indices.
Research results indicated that the ANFIS can estimate and predict the monthly minimum temperature in the station under study with a correlation coefficient of 0.987. The average abso-lute value of the deviation percentage equal to 27.6 suggests that the system is properly trained and appropriate inputs are used for modeling. It seems that simultaneous use of ex-pert’s knowledge and mathematical methods when choosing model inputs lead to an optimal model and the model results are more reliable. Attention should be paid to the fact that as the number of inputs increases, the ANFIS system faces the curse of dimensionality owing to the existence of a huge number of rules and the model is unable to simulate the sys-tem. The number of model inputs should be reduced in order for this problem to be alleviated. Alternatively, the fuzzy clus-tering method should be employed to pre-process the data. Other mathematical transformations such as the Wavelet Transform may be used in spectral analysis to select model in-puts. Furthermore, with regard to the period of the monthly minimum temperature of the region and the changes of sun-spots, it seems that the sunspot activity could be an appropri-ate input for modeling the monthly minimum temperature.
Acknowledgements
The authors would like to extend their appreciation to the anonymous referees and the editor for their constructive comments.
References
Allen, C.C., 1957. A simplified equation for minimum temperature prediction. Monthly Weather Review 85, 119–120.
Asakereh, H., 2010. Analysis of the cycles annual average temperature of Zanjan. Geography and Development 19, 11–24.
Cartwright, M., 1990. Fourier Methods for mathematicians, scientists and engineers. Ellis Horwood Limited, Chichester.
Coulibaly, P., Yoans, D., Francois, A., 2005. Downscaling precipita-tion and temperature with temporal neural networks. Journal of Hydrometeorology 6, 483–496.
Darbandi, S., Arvanaghi, H., 2009. Air temperature estimation using artificial intelligent methods (Case study: Maragheh City). Euro-pean Journal of Scientific Research 61 (2), 290–298.
Dombayci, O¨.A., Go¨lcu¨, M., 2009. Daily means ambient temperature prediction using artificial neural network method: a case study of Turkey. Renewable Energy 34 (4), 1158–1161.
Drake, J.T., 2000. Communications phase synchronization using the adaptive network fuzzy inference system. Ph.D. Thesis, New Mexico State University, Las Cruces, New Mexico, USA.
Firat, M., Turan, M.E., Yundusev, M.A., 2009. Comparative analysis of fuzzy inference system for water consumption time series prediction. Journal of Hydrology 374, 235–241.
Hosseinpour Niknam, H., Azhdari Moghadam, M., Khosravi, M., 2011. Drought forecasting using ANFIS, drought time series and climate indices for next coming year (Case study: Zahedan). Water and Wastwater consulting Engineers Research Development 2, 42– 51.
Jang, J.S.R., 1993. ANFIS: adaptive-network based fuzzy inference system. IEEE Transactions on Systems, Man, and Cybernetics 23 (3), 665–685.
Kisi, O., Ozturk, O., 2007. Adaptive neuro-fuzzy computing technique for evapotranspiration estimation. Journal of Irrigation and Drainage Engineering (ASCE) 133, 368–379.
Majnooni-Heris, A., Zand-Parsa, S.H., Sepaskhah, A.R., Kamgar-Haghighi, A.A., Yasrebi, J., 2011. Modification and validation of maize simulation model (MSM) at different applied water and nitrogen levels under furrow irrigation. Archives of Agronomy and Soil Science 57 (4), 401–420.
Moghaddamnia, A., Ghafari Gousheh, M., Piri, J., Amin, S., Han, D., 2009a. Evaporation estimation using artificial neural networks and adaptive neuro-fuzzy inference system techniques. Advances in Water Resources 32, 88–97.
Moghaddamnia, A., Remesan, R., Hassanpour Kashani, M., Moham-madi, M., Han, D., 2009b. Comparison of LLR, MLP, Elman, NNARX and ANFIS Model with a case study in solar radiation estimation. Journal of Atmospheric and Solar-Terrestrial Physics
71 (8–9), 975–982. http://dx.doi.org/10.1016/j.jastp.2009.04.009,
Issn 1364-6826.
Nayak, P.C., Sudheer, K.P., Rangan, D.M., Ramasastri, K.S., 2005. Short-term flood forecasting with a neuro fuzzy model. Water
Resources Research 41.http://dx.doi.org/10.1029/2004WR003562.
Nayak, P.C., Sudheer, K.P., Rangan, D.M., Ramasastri, K.S., 2004. A neuro-fuzzy computing technique for modeling hydrological time series. Hydrological Sciences Journal 291, 52–66.
Osborn, T.J., 2006. Recent variations in the winter North Atlantic Oscillation. Weather 61, 353–355.
Osborn, T.J., 2011. Winter 2009/2010 temperatures and a record-breaking North Atlantic Oscillation index. Weather 66, 19–21.
Rojas, I., Valenzuela, O., Rojas, F., Guillen, A., Herrera, L.J., Pomares, H., Marquez, L., Pasadas, M., 2008. Soft-computing techniques and ARMA model for time series prediction. Neuro Computing 71, 519–537.
Rosenberg, N.J., Blad, B.L., Verma, S.B., 1983. Microclimate: The Biological Environment, 2nd ed. John Wiley and Sons, New York.
Smith, B.A., McClendon, R.W., Hoogenboom, G., 2006. Improving air temperature prediction with artificial neural networks. Interna-tional Journal of ComputaInterna-tional Intelligent 3 (3), 179–186.
Taghavi, F., Naseri, M., Bayat, B., Motavaliyan, S.S., Azadifar, D., 2011. Determination of the behavior patterns of climate in different areas of Iran based on spectral analysis and clustering limit values of precipitation and temperature. Geographical Research 77, 109– 124.
Ustaoglu, B., Cigizoglu, H.K., Karaca, M., 2008. Forecast of daily minimum, maximum and mean temperature time series by three artificial neural networks. Meteorological Applications 15, 431– 445.
Wang, W.C., Chau, K.W., Cheng, C.T., Qiu, L., 2009. A comparison of performance of several artificial intelligence methods for forecasting monthly discharge time series. Journal of Hydrology 374, 294–306.
Zounemat-Kermani, M., Teshnelab, M., 2008. Using adaptive neuro-fuzzy inference system for hydrological time series prediction. Applied Soft Computing 8 (1), 928–936.