Journal of Eye Movement Research 6(2):3, 1-17
Introduction
Helicopter Landing
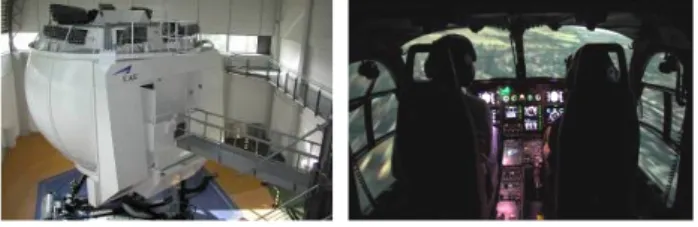
Helicopter landing maneuvers comprise complex de-mands which include solving the conflict between the safety of an aircraft which is not inherently stable and the efficient completion of a mission (e.g. search and rescue). Modern glass cockpits consist of complex display sys-tems (Figure 1) so that information processing is charac-terized by high cognitive workload and increasing head-down activities by the pilot (Colvin, Dodhia, & Dis-mukes, 2005). Thus, there is a growing need for training effective scanning techniques since visual attention is the most crucial resource of pilots (European Aviation Safety Agency, EASA, 2010).
Figure 1. Helicopter Simulator with Glass Cockpit Mock-Up.
Eye Tracking in Training Simulation
Military aviation studies indicate that simulator train-ing supported by eye tracktrain-ing feedback can increase the performance of fighter pilots (Wetzel, Anderson, & Barelka, 1998) as well as helicopter pilots (Sullivan, Yang, Day, & Kennedy, 2011) because student pilot scanning techniques can be compared to those used by experts. This offers the chance to identify scanning errors and teach trainees correct scanning techniques by provid-ing them with individual feedback. The principle has al-ready been demonstrated for serious video gaming (Shapiro & Raymond, 1989): Here, a correlation was found between efficient scanning techniques and per-formance. Two groups of gamers learned to use efficient scanning techniques and inefficient techniques respec-tively. The performance of the inefficient group with re-dundant eye movements and wrong scanning techniques was identical to the performance of an untrained control group. To enable effective training of the optimal scan-ning techniques of military pilots it is necessary for them to learn to reflect and consciously control their scanning techniques. This principle is well-known from biofeed-back: If persons receive visual feedback on biological reactions, their awareness increases in this respect,
en-Tracking Visual Scanning Techniques in
Training Simulation for Helicopter
Landing
Maxi Robinski
German Air Force Instituteof Aviation Medicine
Michael Stein
German Air Force Instituteof Aviation Medicine
Research has shown no consistent findings about how scanning techniques differ between experienced and inexperienced helicopter pilots depending on mission demands.To ex-plore this question, 33 military pilots performed two different landing maneuvers in a flight simulator. The data included scanning data (eye tracking) as well as performance, workload and a self-assessment of scanning techniques (interviews). Fifty-four percent of scanning-related differences between pilots resulted from the factor combination of exper-tise and mission demands. A comparison of eye tracking and interview data revealed that pilots were not always clearly aware of their actual scanning techniques. Eye tracking as a feedback tool for pilots offers a new opportunity to substantiate their training as well as research interests within the German Armed Forces.
Keywords: Pilot scan pattern, flight experience, mission demands, helicopter landing, self-assessment, target fixations
Journal of Eye Movement Research Robinski, M. & Stein, M. (2013) 6(2):3, 1-17 Tracking Pilot Visual Scanning Techniques in Training Simulation for Helicopter Landing
hancing the motivation to improve reactions and generat-ing behavioral control (Janelle & Hatfield, 2008).
Scanning Techniques of Helicopter Pilots
In order to understand scanning techniques of pilots in helicopter landing, the basic principles of human infor-mation processing should be taken into account. In this context, the visual attention of pilots should be under-stood as an endogenously controlled process which, in combination with sufficient experience, enables the ac-quisition of relevant information, also from non-foveal vision (Williams, 1995; Kasarskis, Stehwien, Hickox, Aretz, & Wickens, 2001).
Target Fixations. This is relevant particularly with regard to aircraft landings during which experienced pilots use special gaze patterns for tactical information acquisition. In our practical context of the Army Aviation School, scanning techniques in the cockpit were ad-dressed pre-test in half-standardized interviews with flight instructors (N = 6). Following expert statements scanning techniques partly consist in gaze concentrations, so-called Target Fixations (TF), on objects or instru-ments, the duration of which is "longer than a regular gaze" and which are considered to be indicators of the tactical acquisition of information by experienced pilots. The flight instructors pointed out that we must differenti-ate between TF as used by experienced pilots vs. novices. Unintended TF are used more likely by student pilots who will thus overlook crucial flight situation parameters, particularly under high workload. This is explained by the student pilots' visual field which is not fully devel-oped or still needs to be trained which is why their para-foveal and peripheral perception will only improve after intensive practice. Pilots who are combat ready, on the other hand, absorb specific information using TF and maintain the desired flight path, for instance by determin-ing the changes in the retinal projection of outside object complexes and maintaining an ideal approach angle via control inputs. Expert TF represent a desirable strategy at the right moment, profiting from a fully-developed para-foveal perception and a larger peripheral vision. Corre-spondingly, Colvin et al. (2005, p. 5) report empirical findings for civil pilots who also use intended concentra-tions of gaze:
“Scanning the outside world strongly favored looking straight ahead, with many fixations directed only a few degrees to either side. We suspect that many of these fixations represent not scanning for traffic but rather the default position for gaze, centered along the central axis of the pilot, the aircraft, and the direction of travel. Gazing mainly straight ahead, coupled with peripheral vision, allows pilots to maintain control of the aircraft.”
The operationalization problem. In order to define and operationalize TF we need to know what "ex-tended duration" of gaze means. It is somewhat confusing that flight instructors use the term "Target Fixations" al-though they do not actually mean single fixations but rather the total dwell time in which their gaze is directed to certain target objects or instruments. Since TF, how-ever, is an established term used in pilot jargon we adopted it in this study. Moreover, we should distinguish between gazes inside the cockpit and those outside the window (OTW) and keep in mind that the distribution of gaze only between the cockpit and the outside world is a rough measure. To date, little is known about TF, and the relevant literature does not provide an appropriate tempo-ral indicator to measure this form of scanning technique. Unfortunately, the flight instructors in our expert inter-views also did not specify in detail the gaze duration on which a TF measurement should be based; possibly, ex-perienced pilots cannot be expected to be precisely aware of how they use their gazes. Hence, we should consult the advice of aviation safety authorities. Addressing the as-pect of "optimal scanning", the Federal Aviation Admini-stration (FAA, 1998) recommends constant and frequent visual scanning of the airspace for all pilots and the European Aviation Safety Agency (EASA, 2010) states that a regular gaze inside the cockpit should take ap-proximately three seconds. According to previous find-ings in civil aviation, pilots do not follow existing rec-ommendations given by the authorities (Colvin et al., 2005). It has been shown that OTW gazes are too rare and systematic scan paths cannot be identified among pilots (Anders, 2001). The role of TF in helicopter land-ing, however, has been neglected so far. Nevertheless, the recommendations of the EASA give us a clue how to differentiate TF on the instruments from regular three-second-gazes inside the cockpit. In contrast, unfortu-nately, there is no indication of the duration of OTW gazes. Thus, we need an empirical approach to differenti-ate TF from regular OTW gazes. Regarding this, Inhoff
Journal of Eye Movement Research Robinski, M. & Stein, M. (2013) 6(2):3, 1-17 Tracking Pilot Visual Scanning Techniques in Training Simulation for Helicopter Landing
and Radach (1998) proposed a procedure for gaze data: If duration values X are spread around the mean MX with the standard deviation SD, the duration values X with (MX – 3*SD) ≤ X ≤ (MX + 3*SD) are within the normal range, while all values X with X > (MX + 3*SD) signifi-cantly exceed the average, implying gazes with an ex-tended duration.
As mentioned above, we can expect an influence of flight experience on the application of TF by helicopter pilots. Based on the fact that expert pilots benefit from an enlarged functional visual field (Williams, 1995), identify relevant objects more quickly and make adequate choices of action (Kasarskis et al., 2001), we can assume that they tend to apply TF in a different way than inexperi-enced pilots. The sole impact of flight experience on scanning techniques has been suggested by a wide range of empirical results, even if TF have not been considered explicitly. Some of these results are shown below in order to substantiate hypotheses about scanning techniques of helicopter pilots.
Impact of Flight Experience on Scanning
Techniques
Dixon, Rojas, Krueger, and Simcik (1990) investi-gated the scanning techniques and performance of mili-tary transport aircraft pilots, varying the size of the field of view (FOV) in the simulator with visual flight rules (VFR). It has been demonstrated that, in contrast to train-ees, experienced aviators adapt to a smaller FOV more efficiently to maintain flight parameters. The strategy of experts in the group using a smaller FOV consisted of fewer OTW gazes and more instruments scanning.
By analogy, Bellenkes, Wickens, and Kramer (1997) found different visual scanning techniques of expert and novice pilots for varying flight phases with instrument flight rules (IFR). In comparison to novices, the gaze duration of experts was shorter and fixations on instru-ments were more frequent. Experts were able to react more flexibly to mission demands in that way.
Similarly, the study by Kasarskis et al. (2001) showed that experienced pilots had significantly shorter gaze du-rations, more fixations in total and more relevant fixa-tions on aim points or instruments than novices while performing simulated landing maneuvers (VFR). Thus, experts had more targeted scanning techniques and were able to allocate their attention more efficiently than inex-perienced pilots. We may assume that exinex-perienced pilots
overlearn scanning techniques relevant for flight control and thus have more spare capacity. O'Hare (2002) ex-plains this superiority of experts by using a strategy relat-ing to long-term memory: Experts use experience-driven techniques in attempting to identify stimuli of situational relevance which can assist in solving tasks (also: long-term working memory). They ignore irrelevant stimuli so they have more cognitive resources at their disposal in difficult situations than novices.
The principle of tactical information acquisition by experts is also evident in space flight: Matessa and Rem-ington (2005) modeled astronaut scanning techniques applied to error management by hierarchically breaking down behavior sequences in the Space Shuttle. The par-ticipants were to process a sudden error during a simu-lated Space Shuttle flight. It can be concluded from the eye tracking results that novices (i.e. regular pilots with no experience in space flight) have to fixate their gaze on sudden, unknown information repeatedly for a longer period of time in comparison with experts. In contrast, experienced astronauts conduct effective status analyses more rapidly.
Sullivan et al. (2011) investigated the scanning tech-niques of helicopter pilots in a fixed-base simulator by performing a navigation task (VFR). The results showed that performance cannot be predicted by flight experi-ence; scanning techniques, however, correlated with ex-pertise: The more extensive the flight experience, the shorter the gaze duration and the more frequent the sac-cades between the outside world and the cockpit map. In this study, OTW gazes were more frequent among train-ees than among experts. Here, too, experienced pilots employ a more efficient scanning technique for relevant information channels.
Summarizing the results, it cannot be generally as-sumed that flight experience determines fixations on cer-tain areas for a shorter or longer period of time or more or less frequently, but rather it is to be expected that scans by experts are more targeted than scans by novices. This obviously depends on mission demands. The singular impact of mission demands on scanning techniques has also already been investigated.
Impact of Mission Demands on Scanning
Techniques
Colvin, Dodhia, Bechler, and Dismukes, (2003) in-vestigated scanning techniques of pilots for varied task
Journal of Eye Movement Research Robinski, M. & Stein, M. (2013) 6(2):3, 1-17 Tracking Pilot Visual Scanning Techniques in Training Simulation for Helicopter Landing
demands. In addition to regular straight level flights, phases with high traffic density were performed (VFR). An individual case analysis showed that increasing de-mands result in a concentration of gazes on main displays and instruments (tunnel vision) in order to maintain the performance level. In contrast, fixations on peripheral displays were less frequent.
Gaze concentrations on the instrumentation were also investigated (Thomas & Wickens, 2004) by varying con-trol displays (VFR). The displays were equipped with and without raster graphics creating the effect of an optical tunnel. Measurements were conducted to record scanning data and to determine whether pilots are able to identify unexpected other aircraft. When unpredictable events occurred, resulting in increased demands, it became evi-dent that in both conditions non-detectors fixated their gazes more frequently than detectors and their number of OTW gazes was smaller. In contrast, detectors distributed their scans more evenly between the displays and the outside world. As expected, the graphic tunnel of one of the displays adversely affected the detection performance with respect to other aircraft as it facilitated tunnel vision. While the two studies mentioned above prove the oc-currence of tunnel vision effects with increasing de-mands, the study by DiNocera, Camilli, and Terenzi (2007) implies an inverse trend. The authors measured the subjective workload, performance and scanning data of police pilots over different flight phases (VFR). Re-sults showed that the higher the workload, the more ran-dom or untargeted were fixations in the simulated cock-pit. Moreover, subjects had shorter gaze durations and saccades were longer (visual scanning randomness). The authors are of the opinion that this serves to optimize information acquisition in order not to miss anything, even in high workload phases.
As indicated, the impact of task demands also does not allow any consistent conclusions concerning pilot scanning techniques: On the one hand the tendency of visual tunneling increases with higher workload, on the other hand visual scanning randomness was found. Since the individual operationalizations of the mission demands are not directly comparable to each other, the question as to what extent the findings can be generalized remains currently unsolved. Moreover, research has not found a consensus on how scanning techniques of pilots can be defined and measured. Obviously, flight experience and mission demands must be assumed to be a combined
fluencing factor. This interaction effect has not been in-vestigated particularly with respect to landing maneuvers yet and the differences regarding the scanning techniques of expert and trainee helicopter pilots remain vague.
In order to address this, we tested multivariate effects between flight experience and mission demands (inde-pendent variables) on TF, workload and performance (dependent variables) of military helicopter pilots. If we assume interactive effects, we can establish multivariate hypotheses (H) which can be tested in a multi-factorial design. We have deliberately avoided the formulation of one sided hypotheses since we do not have sufficient in-formation as yet regarding the occurrence of TF and in what sense these are affected by flight experience or the demands of a mission. Due to previous findings the focus is on an interaction hypothesis using a multivariate ap-proach.
H Flight Experience: The flight experience of helicopter pilots affects the use of TF, performance as well as subjective workload during a mission.
H Mission Demands: Mission demands affect the use of TF, performance and subjective workload of helicopter pilots during a mission.
H Flight Experience x Mission Demands: The factors "flight experience" and "mission demands" affect the use of TF, performance and subjective workload of helicopter pilots interactively.
From a training effectiveness point of view it should be noted that effects of single factors fade into the back-ground if experience and demands have a significant in-teraction effect (Janssen & Laatz, 2007, p. 377). Addi-tionally, we explored
•whether objectively measured and subjectively assessed scanning techniques deviate from one another,
•the connection between pilot performance and their scanning techniques, and
•the usability of the eye tracking method from the pilots' point of view.
Methods
Subjects
Thirty-three male helicopter pilots recruited from the German Bueckeburg Army Aviation School voluntarily
Journal of Eye Movement Research Robinski, M. & Stein, M. (2013) 6(2):3, 1-17 Tracking Pilot Visual Scanning Techniques in Training Simulation for Helicopter Landing
took part in the study. The sample included 16 student pilots and 17 flight instructors. On average, the experi-ence of the student pilots amounted to approximately 76 hours in the simulator as well as in real aircraft, while the flight instructors on average had 1501 hours of flight and 301 hours of simulator experience.
Equipment
All tests were conducted in the Eurocopter (EC) 135 flight simulator. The simulator with its original cockpit has a six degrees-of-freedom motion system, eight pro-jectors with a 240*90° FOV and a resolution of 1600*1200 pixels.
The Dikablis® head mounted eye tracking system by Ergoneers Ltd was used for data recording. In addition to a head unit the eye tracking system consists of an elec-tronic unit and a computer for storing the data. Areas of Interest (AOIs) can be mapped in the raw videos using special markers and data can be evaluated in quantitative terms. The evaluation (based on statistical inference) was carried out with SPSS 17.0 for Windows.
Landing Maneuvers
A pre-test expert interview (N = 6) was conducted based on recommendations by Denning, Bennett, and Crane (2003), according to whom the definition and op-erationalization of mission demands should be estab-lished with the support of experienced flight instructors. The experts responded as follows to the question of what exactly makes up high demands of a helicopter landing maneuver:
•Information from the cockpit must be evaluated rapidly.
•A large amount of data must be acquired from the instruments, while information concerning the environment (e.g. ground conditions) is difficult to assess.
•There are hardly any fixed reference points within the peripheral FOV.
•It is necessary to carefully hover to the landing point. Subsequently, a difficulty-ranking of different landing maneuvers was established and performed by a sample of 15 flight instructors. Subjects were asked to rank five maneuvers from 1 = low to 5 = high mission demands. The results showed that landing on a terrain-pinnacle was ranked among the low mission demands by most subjects (53.3%). In contrast, landing on a frigate on the open sea
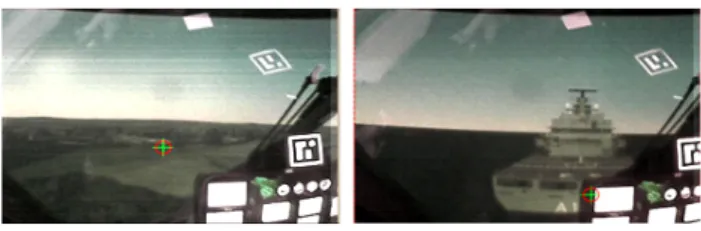
was ranked among the high mission demands by the ma-jor part of the sample (50.0 %). Accordingly, these two missions were included in the study (Figure 2).
Figure 2. Screenshots of the Landing Maneuvers (Left: Pinnacle, Right: Frigate).
Both missions were conducted under visual flight conditions. The pinnacle landing included numerous ref-erence objects within the pilot's peripheral visual field (trees, utility poles) which he could use to orient himself during approach; the landing was therefore a compara-tively easy flight maneuver for an expert. After takeoff the pilot was to fly a short traffic pattern followed by landing the helicopter. In contrast, the second mission was more challenging because there were no reference objects on the open sea. Therefore the pilot had to hover to the landing point on top of the frigate based on skillful visual orientation guided by the cockpit instruments. Both missions lasted approximately 5 minutes and were subdi-vided into three parts: Take-off lasted about one third of the time, the traffic pattern and landing each took another third of the time. Eye tracking data was collected in all three flight phases until touchdown and compared subse-quently. The landing approach was initiated at a flight altitude of approximately 300 ft.
Procedure
After each subject had been equipped with the eye tracking head unit and the system had been calibrated, both missions were performed (33*2 trials). The factors "experience" as well as "demands" were combined in randomized pairs to avoid sequence effects. Between flights subjects took a 20 minute break while the next participant performed the mission. After each mission an interview was conducted via radio. The subjects were asked for a self-assessment of their scanning techniques, performance and workload during the mission. After each subject had performed two missions, a final questionnaire was handed out and completed for a usability evaluation of the eye tracking method.
Journal of Eye Movement Research Robinski, M. & Stein, M. (2013) 6(2):3, 1-17 Tracking Pilot Visual Scanning Techniques in Training Simulation for Helicopter Landing
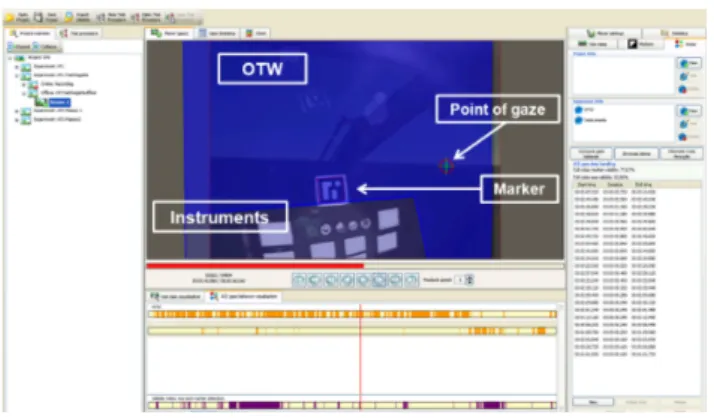
For the analysis of the gaze data AOIs were defined in the eye tracking videos; these are shown in blue in Figure 3. The AOIs "Instruments" (for head-down gazes into the cockpit) and "OTW" (for head-up gazes out of the cock-pit) were selected for data analysis. Both AOIs were di-mensioned using the horizontal instrument panel top side with a reference marker and to the outer limits of the eye tracking videos as shown in Figure 3. Additionally, the AOIs were dynamic (software setting) so they moved transversally with the pilot's head movements. The AOIs were not subdivided into further subsections for the TF analysis since the general occurrence of TF during a heli-copter mission was the focus of the study.
Figure 3. Position of AOIs “OTW” and “Instruments” (Software D-Lab® from Eye Tracking System Dikablis®).
Parameters
TF. Based on the recommendations of EASA (2010) according to which a regular gaze inside the cockpit should take approximately three seconds, gazes with X > 3000 ms were coded as "TFinstruments". A sample-related algorithm (Inhoff & Radach, 1998) was used to calculate individual OTW gazes: All gaze duration values X with X > (MX + 3* SD) were coded as "TFOTW". Based on the algorithm all those gazes are considered to be TFOTW whose duration deviates by at least three standard devia-tions in positive direction from the mean value of the OTW gaze duration.
Performance. According to the pre-test expert inter-view a performance assessment of helicopter pilots should consist of the following aspects: The remaining mental capability of the pilot after the mission (%), the deviation from the optimal landing point (meters) and the airmanship (safe and foresighted aircraft piloting, crew communication; rated with grades from 1-5). In accor-dance with our expert interview helicopter pilots define
remaining mental capability as the subjective amount of spare capacity after a completed mission. It is noticeable that performance is always evaluated subjectively by the flight instructors at the Army Aviation School and that neither objective main task parameters (e.g. reaction time, error frequency or objective performance) nor the per-formance in a secondary task are assessed or stored. On the one hand, there is a standardization requirement since the performance rating of the student pilots can be biased by subjective influences of the flight instructors. On the other hand, studies show that the accuracy of perform-ance ratings by experts is frequently very high with re-spect to the performance of student pilots. Coladarci (1986) proves that teachers evaluate their students with an accuracy of .67 ≤ r ≤ .85 in various fields of compe-tence which is a relatively adequate evaluation regarding the objective performance. Jako and Murphy (1990) show that decomposition (i.e. subcategorization of the evalua-tion in several fields) results in a higher accuracy of sub-jective performance rating. Our approach takes due ac-count of this principle by evaluating the three categories mentioned above (remaining capability, deviation from landing point, airmanship). Moreover, interrater reliabil-ity studies show that there is a high consistency among expert evaluations (Borman: r = .97; Akinwuntan, DeWeerdt, Feys, Baten, Arno, & Kiekens, 2003: r = .80, for the evaluation of driving performance).
Other influences play a role when we take a look at the accuracy of expert self-evaluations. According to established psychological findings, self-evaluations of performance are frequently self-serving biased (cf. Stroebe, Jonas, & Hewstone, 2002). For instance, per-formance tests show no correlations between the self-evaluations of doctors with respect to their expertise and their actually performed skills. By analogy, nurses rate their knowledge about life-saving measures higher than it actually turns out to be when they apply these measures (examples in accordance with Ehrlinger & Dunning, 2003). But the empirical accuracy of self-evaluated per-formance varies strongly in dependence on experimental design. Moorthy, Munz, Adams, Pandey and Darzi (2006) determine an acceptable accuracy of r = .64 re-garding the self-evaluation of performance of medical experts during a simulation operation if the self-evaluation items are tailored in detail to the criteria of the task. In their meta-analysis of 55 studies Mabe and West (1982) also already identified significantly positive corre-lations between self-evaluation and objective
perform-Journal of Eye Movement Research Robinski, M. & Stein, M. (2013) 6(2):3, 1-17 Tracking Pilot Visual Scanning Techniques in Training Simulation for Helicopter Landing
ance (medium accuracy r = .29) in many fields (school achievement, job and sport performance). With regard to the empirical findings the performance assessments in the present study were made by the flight instructors. The dependent variable "performance" was compiled as fol-lows for data analysis: performance = (remaining mental capability + airmanship [inverted] - deviation from land-ing point). Thus, performance was an interval-scaled sum variable which fulfilled the MANOVA requirements. Inverted meant that airmanship was recoded since better (lower) school grades stand for a better performance than poorer (higher) grades. A sample calculation:
Subjective remaining mental capability = 70 % Airmanship = grade 2 (inverted = 4)
Deviation from landing point = 1.5 meters Performance score = 70 + 4 – 1.5 = 72.5
Workload. Due to its approved diagnostic properties the NASA-TLX (Hart & Staveland, 1988) was applied post-trial to assess the subjective workload. The NASA-TLX is a questionnaire that measures the perceived work-load of a task operator. The NASA-TLX total score con-sists of a combination of six subscales (Mental Demand, Physical Demand, Temporal Demand, Performance, Ef-fort, and Frustration) which are rated within a 100-percent range (5-points steps). The subjective workload assessment via interviews using the NASA-TLX was conducted subsequently to each mission.
Statistical Analyses
After inspection of the raw data 21 eye tracking vid-eos had to be excluded from the 66 data sets due to the poor quality of the marker detection. Thus, 45 eye track-ing data sets were included. TF were subsequently ex-tracted from gaze duration data.
Following the descriptive analysis (distributions of gaze duration) the data was verified regarding its possible use for a MANOVA. The demands for all variables were fulfilled: The homogeneity of covariance was determined (Box's M-test: F [18, 4207] = 0.72; p = .798) and all vari-ables were normally distributed (Kolmogorov-SmirnovTF = 0.82, p = .511; Kolmogorov-SmirnovPerformance = 1.09, p = .183; Kolmogorov-SmirnovWorkload = 0.45, p = .989). Regarding type-one-error α was set .05. For all follow-up tests a Bonferroni adjustment was made.
The conduct of a MANOVA was warranted for the following reasons: Without a MANOVA, several uni-variate ANOVAs with the same sample would be indi-cated. This would result in an accumulation of the α er-ror. In addition, a MANOVA can reveal group differ-ences which result from linear combinations. Due to this fact the MANOVA is more exhaustive in comparison with ANOVA. In the case of significant effects, however, the test results do not deliver a clear understanding of where the manifestations of group differences occur. This necessitates post-hoc analyses.
Since a temporal cut-off value "c" for target fixations in aviation has not been empirically validated, further manifestations of c (2000, 4000, 5000, 10000 ms) were tested in follow-up analyses with respect to their impact on explained variance. For the interpretation the conven-tions by Cohen (1988) were applied according to which
η²≥ .01 is a small, η²≥ .06 is a medium and η²≥ .14 is a large effect.
Interview data was compared with eye tracking data for the explorative analysis and deviation variables were calculated: deviation = subjective assessment – objective eye tracking data. Thereby, a) negative values indicated an underestimation of the pilot's own scanning techniques (e.g. more gazes were measured by eye tracking than were subjectively estimated); and b) positive values indi-cated an overestimation of the pilot's own scanning tech-niques (e.g. fewer gazes were measured than were subjec-tively estimated). Furthermore, the existence of linear correlations (Pearson) was explored.
Results
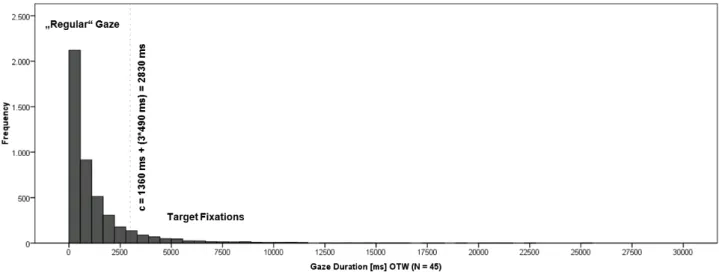
Figures 4 and 5 show the frequency distributions of gaze duration for OTW and instruments (N = 45, each distribu-tion for both missions). Both were tested for normal dis-tribution, however they were not normally distributed (Kolmogorov-SmirnovOTW = 18.51, p < .000; Kol-mogorov-Smirnovinstruments = 14.33, p < .000). As is com-mon for gaze duration both distributions showed a left-steep shape. A visual inspection of both distributions already indicated that the percentage of TFOTW is greater than the percentage of TFinstruments for nearly identical cut-off values (cinstruments = 3000 ms vs. cOTW = 2830 ms).
Journal of Eye Movement Research 6(2):3, 1-17
Figure 4. Frequency Distribution of Gaze Duration for OTW (c = MGaze Duration + 3* SDGaze Duration; see Inhoff & Radach, 1998).
Figure 5. Frequency Distribution of Gaze Duration for Instruments (c = 3000 ms, see EASA, 2010). The descriptive characteristics of TF (%) are shown in
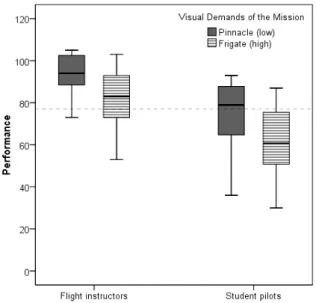
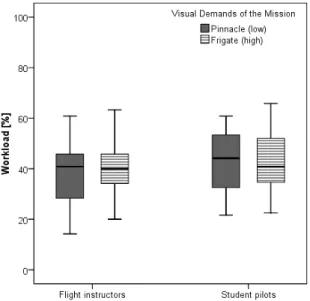
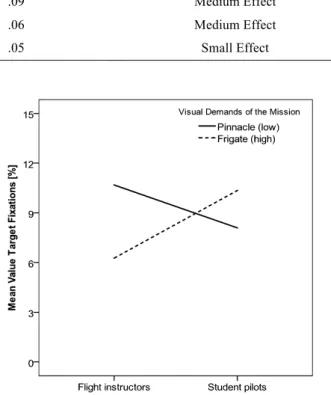
Table 1 and Figure 6. Table 2 as well as Figures 7 and 8 show performance and workload characteristics. As was expected, the factor "experience" revealed a significant main effect on performance (p < .000); however, there were no main effects regarding the total workload or TF (see Table 3). The factor "demands" did not reveal any significant main effects on the dependent variables, ei-ther. In congruence with the assumption of an interactive influence of experience and demands, however, a signifi-cant interaction effect was found for TF (p = .033), but not for performance and workload. Figure 9 was
exam-ined in more detail for a post-hoc analysis. While student pilots had a higher tendency to conduct TF during ma-neuvers with higher visual demands (frigate), a reverse pattern was found for flight instructors: They conducted more TF for lower visual demands (pinnacle).
With respect to flight experience a follow-up T-test revealed a significant difference regarding the NASA-TLX mental scale (MFlight instructors = 45.6, SD = 23.8; M Stu-dent pilots = 60.6, SD = 24.1; t [64] = - 2.55, p = .013): In both missions, the subjective mental demand was greater for student pilots than for flight instructors. This was ob-viously not true, however, for the total workload.
Journal of Eye Movement Research 1(1):1, 1-2
Table 1
Descriptive TF Characteristics
Experience Demands n M [%] SD [%] M [ms] MOTW [%] Minstruments [%]
Pinnacle (low) 16 10.7 5.1 5967 92.6 7.4 Flight Instructors Frigate (high) 9 6.3 4.3 5438 68.4 31.6 Pinnacle (low) 10 8.1 3.3 5702 68.0 32.0 Student Pilots Frigate (high) 10 10.4 6.3 5637 80.4 19.6 Total Sample -- 45 9.2 5.1 5686 77.4 22.6
n = (Sub)sample size, M [%] = Mean amount of TF, SD [%] = Standard Deviation of TF, M [ms] = Mean duration of TF, MOTW [%]
= Mean amount of TFOTW, Minstruments [%] = Mean amount of TFinstruments.
Table 2
Descriptive Performance and Workload Characteristics
Experience Demands n MPerformance SDPerformance MWorkload SDWorkload
Pinnacle (low) 16 91.7 13.6 38.3 13.2 Flight Instructors Frigate (high) 9 81.7 20.2 41.3 11.1 Pinnacle (low) 10 72.4 20.6 42.4 12.5 Student Pilots Frigate (high) 10 60.8 20.0 42.7 12.2 Total Sample -- 45 77.0 21.7 41.2 12.1
MPerformance = Mean value of Performance, SDPerformance = Standard Deviation of Performance, MWorkload = Mean value of Workload,
SDWorkload = Standard Deviation of Workload.
Journal of Eye Movement Research Robinski, M. & Stein, M. (2013) 1,(1):1, 1-2 Tracking Pilot Visual Scanning Techniques in Training Simulation for Helicopter Landing
Figure 8. Boxplot for Workload (M for total sample dashed).
Since the cut-off value for target fixations was calcu-lated from the data set and a specified value has not been established yet, it was also varied (see Table 4) to deter-mine in what way the quality of the multivariate model changes in terms of explained variance (η²). It was found that explained variance was greater for a decreased rather than for an increased cut-off value. A value of 2000 ms would conform to the safety-critical maximum taken from the driving context extracted by means of the sec-ondary task paradigm (Alliance of Automobile Manufac-turers, AAM, 2002). Since gaze durations in aviation cannot be easily compared to those conducted in the driv-ing context and model quality was still satisfactory for 3000 ms, the application of this threshold value proved useful. Since for instance a maximum of 10000 ms does not yield a comparably satisfactory separation between the groups (small effect), its predictive power in various expertise and demand groups is apparently lower than for 3000 ms.
Table 3
MANOVA Results
Source Dependent Variable Sum of Squares df Mean Squares F p Power
TF 6.0 1 6.0 0.3 .623 .08 Performance 5334.4 1 5334.4 15.6 .000 .97 Experience Workload 257.6 1 257.6 1.8 .193 .25 TF 12.5 1 12.5 0.5 .479 .11 Performance 1229.4 1 1229.4 3.6 .065 .46 Demands Workload 148.2 1 148.2 1.0 .321 .17 TF 119.2 1 119.2 4.9 .033 .58 Performance 157.4 1 157.4 0.5 .501 .10 Experience x Demands Workload 8.4 1 8.4 0.1 .812 .06 TF 1000.9 41 24.4 Performance 13980.8 41 341.0 Error Workload 6018.4 41 146.8 TF 4907.8 45 Performance 302972.0 45 Total Workload 82168.1 45
Journal of Eye Movement Research Groner, R., Raess, S. & Reber, T. (2008) 1,(1):1, 1-2 How to Prepare your Manuscript for the Journal of Eye Movement Research
Table 4
Explained Variance for a Variation of the Target Fixation Cut-Off Value
Cut-Off Value [ms] η²Total η²Target Fixations Contribution of Target Fixations
2000 .58 .15 Large Effect
3000 .54 .12 Medium Effect
4000 .51 .09 Medium Effect
5000 .49 .06 Medium Effect
10000 .48 .05 Small Effect
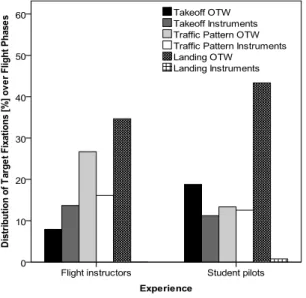
In the subsequent analysis of the determined interac-tion effect the distribuinterac-tion of TF was investigated for takeoff, traffic pattern and landing. For this purpose, a further MANOVA was conducted. Significant differences could again be revealed for the factor combination for TFOTW in the takeoff phase (F [1, 45] = 4.33, p = .044, Power =.53), for TFinstruments during the traffic pattern (F [1, 45] = 7.41, p = .009, Power = .76) as well as for TFOTW in the landing phase (F [1, 45] = 5.04, p = .030, Power = .59). Figure 10 and Figure 11 were used for data interpretation. Since the distribution of TF was analyzed among flight phases the focus was on the relative vs. the absolute quantitative interpretation, i.e. the figures had to be compared to each other.
Pinnacle. During takeoffs and landings in terrain flight operations experts pilot the aircraft using TFOTW to a larger extent than student pilots (black and spotted bars in Figure 10; flight instructorsOTW = 68.3 %, student pi-lotsOTW = 48.5 %) and also have fewer fixations on in-struments during the traffic pattern (white bar in Figure 10; flight instructorsinstruments = 3.1 %, student pilots instru-ments = 22.3 %) than trainees. The scanning technique in-dicates the tactical use by flight instructors of TF in flight phases involving greater workload (takeoff and landing) and at the same time a large amount of environmental information; in this process OTW gazes enable them to benefit from their higher skill of peripheral perception (more TF). Student pilots, on the other hand, apparently conduct shorter scans more frequently, particularly dur-ing landdur-ing approaches, to be able to assess their envi-ronment. The overall smaller amount of TF for trainees in the pinnacle mission (11% vs. 8%) serves to illustrate this. Thus, experts use their peripheral FOV more effec-tively by means of TF when confronted with a large amount of reference information.
Figure 9. Interaction Effect.
Frigate. A different type of expert scanning technique is apparently used for landing on the frigate. While stu-dent pilots tend to fix their gaze on the outside world dur-ing takeoff, flight instructors acquire a comparatively greater amount of information from the instruments (black and dark grey bars in Figure 11; flight instructorsOTW = 7.9 %, student pilotsOTW = 18.8 %). This indicates that they stabilize the aircraft first in spite of the limited environmental information by monitoring flight parameters from instruments. During the traffic pattern over the sea experts predominantly use TFOTW to orient themselves relative to the frigate (see ratio of light grey vs. white bars in Figure 11; flight in-structorsOTW = 26.7 %, student pilotsOTW = 13.4 %); how-ever, the use of instruments by experts is also more ex-tensive here in comparison to terrain flight. Flight in-structors pilot the aircraft over the open sea by means of increased frigate fixation (OTW) even prior to the
land-Journal of Eye Movement Research Robinski, M. & Stein, M. (2013) 6(2):2, 1-17 Tracking Pilot Visual Scanning Techniques in Training Simulation for Helicopter Landing
ing. In contrast, TFOTW of trainees do not increase until landing, while their gazes during flight tend to be shorter. Accordingly, experts use available information channels more efficiently in this case, too: For the purpose of sta-bilization at the beginning of the flight they use instru-ments for a longer period of time than trainees and adhere to an available landing reference point (frigate) at an ear-ly stage.
Figure 10. Relative Amount of Target Fixations for Pinnacle.
Figure 11. Relative Amount of Target Fixations for Frigate. In order to verify the difference between the subjec-tive and objecsubjec-tive scanning techniques deviation vari-ables were examined with regard to their manifestation
and distribution. The analysis showed that misestimation of OTW and instrument gazes occurred among the pilots. As an explorative MANOVA showed, the self-assessment of OTW gazes was on average positively bi-ased, i.e. fewer OTW gazes were measured than were subjectively estimated (mean difference of objective and subjective data = 17.0 %, SD = 17.6 %). A corresponding inverse pattern was found for instrument gazes (mean difference = - 16.87, SD = 17.59). The explorative MA-NOVA for the experience and demand factors revealed a significant main effect for experience regarding the mis-estimation of OTW gazes (F = 10.1, p = .003, Power = .87) and the misestimation of instrument gazes (F = 10.6, p = .002, Power = .89).
An analysis of the mean estimation of gazes inside the cockpit analysis showed that the mean difference for stu-dent pilots was - 25.8 % (SD = 12.9 %), while the mean difference for flight instructors was - 9.8 % (SD = 17.8 %). This means that the frequency of instru-ment gazes tended to be underestimated. In conclusion it can be observed that experts also partly misestimated their scanning techniques; however, the variance was somewhat greater than for student pilots.
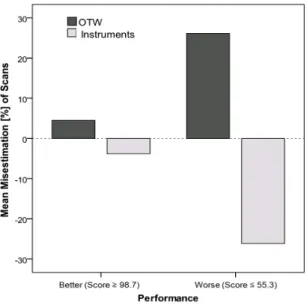
The explorative correlation analysis, however, did not reveal any significant linear correlation between individ-ual gaze parameters and performance, although an inter-correlation of gaze data was observed (amount of signifi-cant correlations: .19 ≤ r ≤ .99, .000 ≤ p ≤ .006). Further exploration did, however, show a significant correlation between performance and the misestimation of the pilots' own scanning technique: referring to the instrument check, r = .31 (p =.035). In other words, a connection was established between the correctness of self-assessment and the landing maneuver performance. In order to un-derstand the difference between better and worse per-formers with respect to their subjective assessment we used the data of pilots whose performance was one stan-dard deviation above or below the mean value. Only flight instructors (n = 9) turned out to be particularly bet-ter performers; eight student pilots and three flight in-structors were rated worse performers (n = 11). If we compare better to worse performers in Figure 12, it can be seen that the misestimation was lower for better per-formers (better perper-formers: MOTW = 4.5, SD = 17.6; M
in-struments = -3.8, SD = 17.1; worse performers:
MOTW = 26.1, SD = 9.1; Minstruments = -26.1, SD = 9.2; FOTW = 8.3, p = .014; Finstruments = 9.3, p = .010). This
ob-Journal of Eye Movement Research Robinski, M. & Stein, M. (2013) 6(2):2, 1-17 Tracking Pilot Visual Scanning Techniques in Training Simulation for Helicopter Landing
servation underlines the differences between experts and trainees: The subjective assessment by experienced and better performers regarding their scanning techniques seems to be more realistic.
Figure 12. Self-Assessment of Better and Worse Performers. Another part of the analysis was the evaluation of the usefulness of eye tracking as a feedback method in simu-lator training and its usability for real flights. More than half of the sample (53.3 %) could imagine using it as a feedback tool in simulator training on a regular basis once a month. 61.5 % could imagine applying eye track-ing in real flights.
Discussion
Scanning Techniques of Helicopter Pilots
The results of this study suggest that – in line with the interaction hypothesis – there is an interactive influence between flight experience and demands of the mission on the scanning techniques of helicopter pilots. We were able to show that, in total, up to 10 % of the gazes are TF. In summary, regarding terrain landing, experts seem to profit - as expected - from their greater parafoveal and peripheral visual field during terrain flight (cf. Williams, 1995; Kasarskis et al., 2001). We can presume a connec-tion between experience and mental workload: If experts highly overlearn a task, they may have more cognitive resources to process peripheral cues more easily. This fact is underpinned by the higher total amount of TF in
this group vs. the inexperienced group. Regarding land-ing on the open sea, experts use comparatively more in-formation from instruments during flights over the sea and, all in all, use fewer TF than inexperienced pilots.
Caution is required in drawing general conclusions from our data. The high vs. low visual demands are con-founded with the variety of visual information available to the pilots for the two conditions. The amount of time required to process some visual cues necessary for atti-tude control could be greater in one of the missions. More generally, with only two flight scenarios and the analysis of only TF as gaze data, conclusions about how expert pilots use their eye movements as a function of task char-acteristics and available visual cues can be drawn only to a limited extent. Apart from that, although TF are a rather global measure, they could represent a handy pooling tool for scanning techniques in a training context.
The interaction effect determined with regard to heli-copter pilot scanning techniques is noteworthy because it could offer an explanation for the previously inconsistent findings: With increasing mission demands researchers previously found either visual tunneling or visual scan-ning randomness (e.g. Colvin et al., 2003; DiNocera et al., 2007). If we combine previous findings and the re-sults of this study, these inconsistencies can possibly be explained by the fact that flight experience and demands can only be considered as a factor combination to explain varying scanning techniques. This also becomes clear when looking at the results of Sullivan et al. (2011): The authors found a percentage of only 42 % explained vari-ance for gaze duration exclusively for flight experience, while the combination with mission demands resulted in 54 % (TF: η² = .12; medium effect) in this study.
In accordance with the study by Dixon et al. (1990) which investigated how rapidly transport aircraft pilots adapt to a smaller FOV, the use of a more effective strat-egy by experts during a visually demanding mission can be proven in this study, too (earlier use of instruments and tactical instrument fixations). The findings are also coherent with the more recent study by Sullivan et al. (2011) which found that a navigational task was handled better by experienced helicopter pilots (H-60 Navy heli-copter) when they gazed into the cockpit rather than the outside world. Nevertheless, the studies must be com-pared with caution since scanning techniques must al-ways be interpreted in the context of aircraft type and task within the experiment setting.
Journal of Eye Movement Research Robinski, M. & Stein, M. (2013) 6(2):2, 1-17 Tracking Pilot Visual Scanning Techniques in Training Simulation for Helicopter Landing
The Interpretation of Eye Tracking Data from the
Simulator Cockpit
Eye tracking data in virtual environments have to be interpreted with caution for several reasons. In addition to the question of the extent to which simulator studies can be generalized there exists the option of measuring arti-facts. Applied to this case simulator artifacts would con-sist of gazes with a duration of more than 3,000 ms which, however, would not result from the visual de-mands of the mission or from flight experience but rather from the visual processing of the discrepancy between the virtual and the real environment, for instance. Assuming that the deviation from reality comes into effect more significantly in a simulated environment in the presence of numerous objects (pinnacle) than in the absence of reference objects (frigate) and assuming that another type of lens accommodation might be required due to the vir-tual environment, especially flight instructors could tend to deviations regarding their true scanning techniques in such a virtual situation. If we link the different scenarios to the observation that student pilots are likely to belong to the "generation simulator", it is conceivable that latter have a more realistic impression in the simulated envi-ronment and demonstrate more natural scanning tech-niques in both missions. This interpretation is substanti-ated by results according to which flight instructors at the Army Aviation School are more likely to criticize the visual simulator characteristics than student pilots and suffer from simulator sickness more frequently (Stein & Robinski, 2012) which can be an indication of their lower adaptation to the virtual environment. These effects are also known from other fields of research (driving simula-tions): Older subjects (56 years +) complain more often about a lack of comfort in the simulator as well as graph-ic quality and control input delays and suffer from simu-lator sickness symptoms more frequently than younger subjects (up to 35 years). Verifiably, older persons play video or computer games less frequently (Liu, Watson, & Miyazaki 1999). This fact in combination with a high degree of experience in the real task (e.g. driving a car or operating an aircraft) is also a strong argument that this older generation is less familiar with virtual environ-ments. In the present study, however, the occurrence of simulator sickness was controlled via post-trial question-naire but no subject affirmed the symptoms.
Compared to the pilots investigated by Sullivan et al. (2011), this study showed a different gaze duration of
helicopter pilots: In the study involving the navigational task the mean gaze duration OTW was 231 ms. The pilots in this study on average gazed six times longer into air-space (M = 1360 ms) and still three times longer at in-struments than the helicopter pilots in the Sullivan et al. study, who had map fixations in the simulator cockpit for 271 ms on average. Apart from this, however, gaze dis-tributions were almost identical in both studies: 57.7% OTW scans were determined in the study by Sullivan et al.; a percentage of 58.2% OTW was measured in this study. The differences in gaze duration could be the result of eye tracking system differences (fixation vs. gaze measurement) or also the divergent instructions by Sulli-van et al. (2011) to pilots who were to handle a naviga-tional task which did not include conducting a landing maneuver (terrain-following fixed). We must also con-sider that eye tracking does not enable the measurement of parafoveal perception patterns, but that it merely en-codes foveal vision. The lack of a second task (e.g. navi-gation) and the disregard of parafoveal information proc-essing which may be involved in the paradigm including only one primary task (safely landing the aircraft) to a certain amount could explain the longer gaze durations of the pilots investigated here.
The differences in gaze duration could possibly also be explained by design aspects of the cockpit. In contrast to the EC 135 the helicopter (Navy H-60) used by Sulli-van et al. (2011) has the adSulli-vantage that the displays are all illuminated with a light green LED frame if the system status is normal. In case of system malfunctions the col-ors change to amber or red. Thus, the pilot can conduct an exhaustive instrument check with short cockpit scans. The EC 135 offers no comparable visual support by LEDs so longer gaze duration into the cockpit may be necessary. The above mentioned difference substantiates the fact that the results of eye tracking studies must al-ways be interpreted within the context of each individual study.
Comparing Eye Tracking Data and
Self-Assessments
Regarding the comparison between scanning data and subjective statements the participants in this study over-estimated the amount of OTW gazes and underover-estimated their instrument checks. As was expected, the misestima-tion was more significant among student pilots. This sup-ports the findings of other eye tracking studies according to which subjects are not always able to correctly assess
Journal of Eye Movement Research Robinski, M. & Stein, M. (2013) 6(2):2, 1-17 Tracking Pilot Visual Scanning Techniques in Training Simulation for Helicopter Landing
their scanning techniques (e.g. media research: Geise, 2012). In addition to considering the inability to precisely recall their scanning techniques, we must also take into account the fact that the focus has never been on helicop-ter pilot scanning techniques to a similar extent before; accordingly, there was no reference information for the subjects and self-assessment was difficult. The correct subjective assessment of individual scanning techniques is no trivial matter in aviation because these are crucial to the safe piloting of aircraft and should be utilized as an intended strategy for preventing errors. This fact is re-flected in the correlation of the pilots' subjective assess-ment of their scanning techniques and performance (r = .31, p = .035). Of course, self-assessment of scanning techniques is not the only determinant of performance, but the precise visual acquisition of information or meta-cognition about this can be a key preliminary stage of decision making and action in aviation (EASA, 2010). The results exceed those of the study by Sullivan et al. (2011); here, it was initially only found that objective gaze parameters by themselves do not directly correlate with performance during a navigational task. The cor-rectness of self-assessment as a predictor has not been verified until now.
The NASA-TLX mental scale varied significantly be-tween the experience groups; however, no differences were revealed for the total score. In light of the fact that the missions had different visual demands, this result is curious; however, it is congruent with the other findings according to which the NASA-TLX does not always re-veal differences of subjective workload due to various task characteristics within one sensory modality (here: visual; cf. Billings, 2008; Horberry, Anderson, Regan, Triggs, & Brown, 2006; Metzger & Parasuraman, 2005). The variation of demands on the visual level is possibly too specific for a general workload measurement.
Conclusion
This study has suggested that there are significant dif-ferences in scanning techniques of helicopter flight in-structors and student pilots when facing different mission demands. Thereby, a correct self-assessment of scanning techniques can influence helicopter pilot performance in landing maneuvers positively. By comparing objective measured gaze data with self-assessments of pilots, eye tracking feedback can potentially enhance simulator
training transfer. It is possible to compare scanning vid-eos of better and worse performers or to investigate the amounts of TF with regard to their connection to specific events during missions to enable trainees to optimize their scanning techniques more quickly. The application of the procedure to the selection of potential pilots is an-other implication. In this context scanning techniques applied by candidates can be compared with models of experienced pilots and used to determine the candidates' qualification.
Acknowledgements
We would like to thank the Bueckeburg Army Avia-tion School for its cooperaAvia-tion in this study and Ms. Eva Maria Walter for her language support.
References
Akinwuntan, A. E., DeWeerdt, W., Feys, H., Baten, G., Arno, P., & Kiekens, C. (2003). Reliability of a road test after stroke. Archives of Physical Medicine and
Rehabilitation, 84(12), 1792-1796.
Alliance of Automobile Manufacturers (AAM). (2002). Driver Focus-Telematics Working Group: Statement of principles, criteria and verification procedures on driver interactions with advanced in-vehicle
information and communication systems. Washington
DC, USA: Alliance of Automobile Manufacturers (AAM).
Anders, G. (2001). Pilot´s attention allocation during approach and landing – Eye- and head-tracking research in an A330 full flight simulator. In
Proceedings of the 11th International Symposium on
Aviation Psychology (ISAP). Columbus, OH, USA:
Ohio State University.
Bellenkes, A. H., Wickens, C. D., & Kramer, A. F. (1997). Visual scanning and pilot expertise: The role of attentional flexibility and mental model develop-ment. Aviation, Space, and Environmental Medicine, 68(7), 569-579.
Billings, D. R. (2008). The effects of input device and latency on ability to effectively pilot a simulated Micro-UAV. In Proceedings of the Human Factors
and Ergonomics Society 52nd Annual Meeting (pp.
Journal of Eye Movement Research Robinski, M. & Stein, M. (2013) 6(2):2, 1-17 Tracking Pilot Visual Scanning Techniques in Training Simulation for Helicopter Landing
Borman, W. C. (1977). Consistency of rating accuracy and rating errors in the judgment of human perform-ance. Organizational Behavior and Human
Perform-ance, 20(2), 238-252.
Cohen, J. (1988). Statistical power analysis for the behavioral sciences (vol. 2). Hillsdale, NJ, USA: Erlbaum.
Coladarci, T. (1986). Accuracy of teacher judgments of student responses to standardized test items. Journal
of Educational Psychology, 78(2), 141-146.
Colvin, K. W., Dodhia, R. M., Bechler, S. A., &
Dismukes, R. K. (2003). Scanning for Visual Traffic: An Eye Tracking Study. In Proceedings of the 12th
International Symposium on Aviation Psychology (pp.
255-260). Dayton, OH, USA: The Wright State University.
Colvin, K. W., Dodhia, R. M., & Dismukes, R. K. (2005). Is Pilots´ Visual Scanning Adaequate to Avoid Mid-Air Collisions? In Proceedings of the 13th
International Symposium on Aviation Psychology (pp.
104-109). Oklahoma City, OK, USA.
Denning, T., Bennett, W., & Crane, P. (2003). Mission Complexity Scoring in Distributed Mission Training. United States Air Force Research Laboratory (Rep. No. AFRL-HE-AZ-TR-2002-0192), Ohio, USA. Retrieved 25 March 2013 from
http://www.dtic.mil/cgi-bin/GetTRDoc?AD=ADA418478.
DiNocera, F., Camilli, M., & Terenzi, M. (2007). A Random Glance at the Flight Deck: Pilot´s Scanning Strategies and the Real-Time Assessment of Mental Workload. Journal of Cognitive Engineering and
Decision Making, 1, 271-285.
Dixon, K. W., Rojas, V. A., Krueger, G. M., & Simcik, L. (1990). Eye Tracking Device for the Measurement
of Flight Performance in Simulators (Rep. No.
AFHRL-TP-89-18). Williams Air Force Base, Arizona, USA: Air Force Human Ressources Laboratory.
Ehrlinger, J. & Dunning, D. (2003). How chronic self-views influence (and potentially mislead) estimates of performance. Journal of Personality and Social
Psy-chology, 84(1), 5-17.
European Aviation Safety Agency (EASA). (2010). Collision Avoidance. Methods to reduce the risk. Retrieved 25 March 2013 from
http://easa.europa.eu/essi/documents/EGAST_Leaflet 1.pdf.
Federal Aviation Administration (FAA). (1998). Scanning for Other Aircraft. Aeronautical
Information Manual (Rep. No. 8-1-6-c). Oklahoma
City, OK, USA: Federal Aviation Administration. Geise, S. (2012): Eyetracking in der Kommunikations-
und Medienwissenschaft: Theorie, Methode und kritische Reflektion [Eye Tracking in Communication and Media Science: Theory, Method, and Critical Reflection]. Studies in Communication and Media,
2/2011, 149-263. Retrieved 25 March 2013 from
http://www.scm.nomos.de/aktuelles-heft-und-archiv/2011/heft-2/beitrag-geise/.
Hart, S. G. & Staveland, L. E. (1988). Development of NASA-TLX (Task Load Index): Results of Empirical and Theoretical Research. In P. A.Hancock & N. Meshkati (Eds.), Human Mental Workload (pp. 139-183). Amsterdam, The Netherlands: North-Holland. Horberry, T., Anderson, J., Regan, M. A., Triggs, T. J., &
Brown, J. (2006). Driver distraction: The effects of concurrent in-vehicle tasks, road environment complexity and age on driving performance. Accident
Analysis and Prevention, 38, 185-191.
Inhoff, A. W. & Radach, R. (1998). Definition and computation of oculomotor measures in the study of cognitive processes. In G. Underwood (Ed.), Eye
Guidance in Reading and Scene Perception (pp.
29-53). Oxford, UK: Elsevier.
Jako, R. A., & Murphy, K. R. (1990). Distributional rat-ings, judgment decomposition, and their impact on in-terrater agreement and rating accuracy. Journal of
Applied Psychology, 75(5), 500-505.
Janelle, C. M. & Hatfield, B. D. (2008). Visual attention and brain processes that underlie expert performance: Implications for sport and military psychology.
Military Psychology, 20, 39-69.
Janssen, J. & Laatz, W. (2010). Statistische Datenanalyse mit SPSS. Eine anwendungsorientierte Einführung in das Basissystem und das Modul Exakte Tests
[Statistical data analysis with SPSS. An applied introduction to the basic system and the modul of
Journal of Eye Movement Research Robinski, M. & Stein, M. (2013) 6(2):2, 1-17 Tracking Pilot Visual Scanning Techniques in Training Simulation for Helicopter Landing
Kasarskis, P., Stehwien, J., Hickox, J., Aretz, A., & Wic-kens, C. (2001). Comparison of expert and novice scan behaviors during VFR flight. In Proceedings of the 11th International Symposium on Aviation
Psy-chology. Columbus, OH, USA: Ohio State University.
Liu, L., Watson, B., & Miyazaki, M. (1999). VR for the elderly: Quantitative and qualitative differences in performance with a driving simulator.
Cyberpsychol-ogy and Behavior, 2, 567-576.
Mabe, P. A., & West, S. G. (1982). Validity of self-evaluation of ability: A review and meta-analysis.
Journal of Applied Psychology, 67(3), 280-296.
Matessa, M. & Remington, R. (2005). Eye Movements in Human Performance Modeling of Space Shuttle Operations. In Proceedings of the Human Factors and
Ergonomics Society 49th Annual Meeting (pp.
1114-1118). Orlando, FL, USA.
Metzger, U. & Parasuraman, R. (2005). Automation in Future Air Traffic Management: Effects of Decision Aid Reliability on Controller Performance and Mental Workload. Human Factors, 47, 1-15.
Moorthy, K., Munz, Y., Adams, S., Pandey, V., & Darzi, A. (2006). Self-assessment of performance among surgical trainees during simulated procedures in a simulated operating theater. The American Journal of
Surgery, 192(1), 114-118.
O'Hare, D. (2002). Aeronautical decision making: Meta-phors, models, and methods. In P. S. Tsang & M. A. Vidulich (Eds.), Principles and practices of aviation
psychology (pp. 201-237). Mahwah, NJ, USA:
Law-rence Erlbaum.
Shapiro, K. L., & Raymond, J. E. (1989). Training of efficient oculomotor strategies enhances skill acquisition. Acta Psychologica, 71, 217–242. Stein, M. & Robinski, M. (2012). Simulator Sickness in
Flight Simulators of the German Armed Forces.
Avia-tion Psychology and Applied Human Factors, 2(1),
11-19.
Stroebe, W., Jonas, K., & Hewstone, M. R. (2002). Sozi-alpsychologie: Eine Einführung [Social Psychology.
An Introduction]. Heidelberg, Germany: Springer.
Sullivan, J., Yang, H. J., Day, M., & Kennedy, Q. (2011). Training Simulation for Helicopter
Navigation by Characterizing Visual Scan Patterns. Aviation, Space, and Environmental Medicine, 82, 871-878.
Thomas, L. C. & Wickens, C. D. (2004). Eye Tracking and Individual Differences in Off-Normal Event Detection when Flying with a Synthetic Vision System Display. In Proceedings of the Human
Factors and Ergonomics Society 48th Annual Meeting.
New Orleans, LA, USA.
Wetzel, P. A., Anderson, G. M., & Barelka, B. A. (1998). Instructor Use of Eye Position Based Feedback for Pilot Training. In Proceedings of the Human Factors
and Ergonomics Society 42nd Annual Meeting (pp.
1388-1392). Chicago, IL, USA.
Williams, L. J. (1995). Peripheral target recognition and visual field narrowing in aviators and nonaviators.
International Journal of Aviation Psychology, 5,