Durham Research Online
Deposited in DRO:
05 September 2013Version of attached file:
Published VersionPeer-review status of attached file:
Peer-reviewedCitation for published item:
Xue, Y.Q. and Brandt, W.N. and Luo, B. and Rafferty, D.A. and Alexander, D.M. and Bauer, F.E. and Lehmer, B.D. and Schneider, D.P. and Silverman, J.D. (2010) ’Color-magnitude relations of active and non-active galaxies in the Chandra Deep Fields : high-redshift constraints and stellar-mass selection effects.’, Astrophysical journal., 720 (1). pp. 368-391.
Further information on publisher’s website:
http://dx.doi.org/10.1088/0004-637X/720/1/368Publisher’s copyright statement:
Credit: Xue, Y.Q. and Brandt, W.N. and Luo, B. and Rafferty, D.A. and Alexander, D.M. and Bauer, F.E. and Lehmer, B.D. and Schneider, D.P. and Silverman, J.D., AA, 720, 368-391, 2010, reproduced with permission, ESO.
Use policy
The full-text may be used and/or reproduced, and given to third parties in any format or medium, without prior permission or charge, for personal research or study, educational, or not-for-profit purposes provided that:
• a full bibliographic reference is made to the original source • alinkis made to the metadata record in DRO
• the full-text is not changed in any way
The full-text must not be sold in any format or medium without the formal permission of the copyright holders. Please consult thefull DRO policyfor further details.
Durham University Library, Stockton Road, Durham DH1 3LY, United Kingdom Tel : +44 (0)191 334 3042 — Fax : +44 (0)191 334 2971
C
2010. The American Astronomical Society. All rights reserved. Printed in the U.S.A.
COLOR–MAGNITUDE RELATIONS OF ACTIVE AND NON-ACTIVE GALAXIES IN THE CHANDRA DEEP
FIELDS: HIGH-REDSHIFT CONSTRAINTS AND STELLAR-MASS SELECTION EFFECTS
Y. Q. Xue1,2, W. N. Brandt1,2, B. Luo1,2, D. A. Rafferty1,10, D. M. Alexander3, F. E. Bauer4,5, B. D. Lehmer3,6,7, D. P. Schneider1, and J. D. Silverman8,9
1Department of Astronomy and Astrophysics, Pennsylvania State University, University Park, PA 16802, USA;[email protected] 2Institute for Gravitation and the Cosmos, Department of Physics, Pennsylvania State University, University Park, PA 16802, USA
3Department of Physics, Durham University, Durham, DH1 3LE, UK 4Space Science Institute, 4750 Walnut Street, Suite 205, Boulder, CO 80301, USA
5Departamento de Astronom´ıa y Astrof´ısica, Pontificia Universidad Cat´olica de Chile, Casilla 306, Santiago 22, Chile 6The Johns Hopkins University, Homewood Campus, Baltimore, MD 21218, USA
7NASA Goddard Space Flight Centre, Code 662, Greenbelt, MD 20771, USA
8ETH Zurich, Institute of Astronomy, Department of Physics, Wolfgang-Pauli-Strasse 16, 8093 Zurich, Switzerland
9Institute for the Physics and Mathematics of the Universe (IPMU), University of Tokyo, Kashiwanoha 5-1-5, Kashiwa-shi, Chiba 277-8568, Japan
Received 2010 March 19; accepted 2010 July 7; published 2010 August 10
ABSTRACT
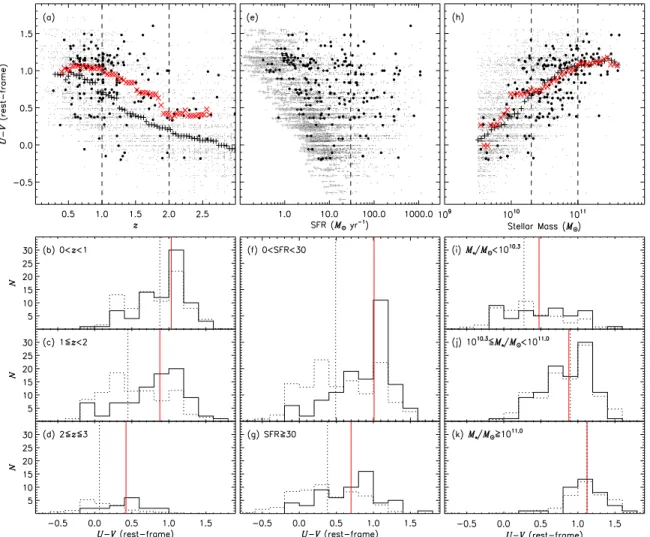
We extend color–magnitude relations for moderate-luminosity X-ray active galactic nucleus (AGN) hosts and non-AGN galaxies through the galaxy formation epoch (z≈1–4) in the Chandra Deep Field-North and Chandra Deep Field-South (CDF-N and CDF-S, respectively; jointly CDFs) surveys. This study was enabled by the deepest available X-ray data from the 2 Ms CDF surveys as well as complementary ultradeep multiwavelength data in these regions. We utilized analyses of color–magnitude diagrams (CMDs) to assess the role of moderate-luminosity AGNs in galaxy evolution. First, we confirm some previous results and extend them to higher redshifts, finding, for example, that (1) there is no apparent color bimodality (i.e., the lack of an obvious red sequence and blue cloud) for AGN hosts from z ≈ 0 to 2, but non-AGN galaxy color bimodality exists up to z ≈ 3 and the relative fraction of red-sequence galaxies generally increases as the redshift decreases (consistent with a blue-to-red migration of galaxies), (2) most AGNs reside in massive hosts and the AGN fraction rises strongly toward higher stellar mass, up toz≈2–3, and (3) the colors of both AGN hosts and non-AGN galaxies become redder as the stellar mass increases, up to z ≈ 2–3. Second, we point out that, in order to obtain a complete and reliable picture, it is critical to use mass-matched samples to examine color–magnitude relations of AGN hosts and non-AGN galaxies. We show that for mass-matched samples up to z ≈ 2–3, AGN hosts lie in the same region of the CMD as non-AGN galaxies; i.e., there is no specific clustering of AGN hosts in the CMD around the red sequence, the top of the blue cloud, or the green valley in between. The AGN fraction (≈10%) is mostly independent of host-galaxy color, providing an indication of the duty cycle of supermassive black hole growth in typical massive galaxies. These results are in contrast to those obtained with non-mass-matched samples where there is apparent AGN clustering in the CMD and the AGN fraction generally increases as the color becomes redder. We also find, for mass-matched samples, that the star formation rates of AGN hosts are typically a factor of ≈2–3 larger than those of non-AGN galaxies atz ≈ 0–1, whereas this difference diminishes atz ≈ 1–3. With mass-selection effects taken into account, we find that almost all of the results obtained in this work can reasonably be explained by two main ingredients, color–mass correlation (i.e., X-ray AGNs preferentially reside in massive galaxies that generally tend to be redder than less-massive galaxies) and passive or secular evolution of galaxies. Our results show that the presence of moderate-luminosity AGN activity does not have a significant effect on the colors of galaxies and thus tightly constrain any effects from moderate-luminosity AGN feedback upon color–magnitude properties over the≈80% of cosmic time during which most of galaxy formation occurred.
Key words: cosmology: observations – galaxies: active – galaxies: evolution – galaxies: general – surveys – X-rays: galaxies
Online-only material:color figures, machine-readable table
1. INTRODUCTION
Deep multiwavelength surveys have greatly refined our un-derstanding of the cosmic star formation and mass-assembly history. Measurements of galaxy luminosity functions at multi-ple wavelengths have provided a reasonably tight constraint on the evolution of the space density of the galaxy star formation rate (SFR): the cosmic star formation history is known to within
≈30%–50% up to redshifts of z ≈ 1 and within a factor of
10Current address: Leiden Observatory, Leiden University, Oort Gebouw, P.O. Box 9513 RA, Leiden, The Netherlands.
≈3 atz ≈ 1–6 (e.g., Hopkins2004). It has been established that the galaxy SFR density has a broad maximum atz≈1–4, followed by a sharp drop fromz≈1 toz≈0 (e.g., Dickinson et al.2003a; Giavalisco et al.2004) and a fast decrease beyond z ≈ 3–4 (see, e.g., Hopkins & Beacom 2006; Wilkins et al.
2008). It now seems clear that the bulk of present stellar mass was formed over a critical epoch atz≈1–4 (e.g., Hopkins & Beacom2006).
Star formation and active galactic nucleus (AGN) activity in galaxies are often found to go hand-in-hand (e.g., Page et al.
2001; Alexander et al.2005b; Netzer et al.2007; Silverman et al.
2009). Both AGN activity and star formation peak in about the 368
No. 1, 2010 COLOR–MAGNITUDE RELATIONS OF ACTIVE AND NON-ACTIVE GALAXIES 369 same redshift range (z ≈ 1.5–2), and they undergo a similar
decline belowz ≈ 1 (e.g., Cowie et al. 2003; Merloni et al.
2004; Silverman et al.2008a). Mounting evidence has shown that supermassive black holes (SMBHs) centered in galaxies must play an important role in galaxy evolution. The close connection between AGNs and their hosts is most strikingly shown by the tight correlations between the masses of SMBHs and the properties of their host-galaxy bulges (e.g., H¨aring & Rix2004; Ferrarese & Ford2005; G¨ultekin et al.2009). Recent theoretical models propose that AGN feedback is an important ingredient in understanding the interconnection between AGNs and their hosts (e.g., Silk & Rees1998; Di Matteo et al.2005; Bower et al.2006; Croton et al.2006; Fabian et al.2008). Two main AGN feedback modes are thought to be significant. In the “radiative mode,” the initially shrouded luminous AGN expels the obscuring gas (that feeds both the SMBH and star formation) and thus quenches star formation (e.g., Hopkins et al.2005; Springel et al.2005). The “kinetic mode” invokes AGN heating to prevent hot gas from cooling and falling into a galaxy to form stars (e.g., Croton et al.2006), which is generally thought to be important in the more massive halos and occurs at much smaller accretion rates than that of the radiative-mode feedback. To investigate the close connections between star formation and AGN activity and thus fully understand galaxy formation and evolution, a sensible approach is to study both AGNs and their hosts.
Galaxy colors are directly related to the star formation, dust, and metal-enrichment history of galaxies and thus provide im-portant constraints for models of galaxy formation and evolu-tion. The color–magnitude diagram (CMD; plot of rest-frame
U−V/U−B colors versus V-band/B-band absolute magni-tudes) has proven to be one effective tool for exploring the role of AGNs in galaxy evolution. Previous CMD studies have obtained a number of results, e.g.: (1) the galaxy color bimodal-ity (i.e., separation of galaxies into the red sequence and the blue cloud) has been clearly seen in the CMD, while no color bimodality of X-ray AGN hosts appears to exist (e.g., B¨ohm & Wisotzki2007; Nandra et al.2007; Silverman et al.2008b). (2) The clustering of AGNs in the CMD is distinct. It has been shown that X-ray/optically selected AGNs reside in the red sequence, the top of the blue cloud, and the green valley in be-tween (e.g., Martin et al.2007; Nandra et al.2007; Rovilos & Georgantopoulos2007; Westoby et al.2007); it has also been found that radio AGNs preferentially lie on the red sequence, X-ray AGNs lie in the green valley, and IR-selected AGNs are found in somewhat bluer hosts than X-ray AGNs (Hickox et al.
2009). (3) The broad distribution of host-galaxy colors of X-ray selected moderate-luminosity AGNs is dependent on the strong color evolution of luminous (MV < −20.7) galaxies and the
influence of enhanced AGN activity in≈10 Mpc large-scale structures (Silverman et al.2008b). (4) Morphologies of X-ray selected moderate-luminosity AGNs reveal no close connection between major mergers and AGN activity, and are consistent with minor interactions and/or secular evolution (e.g., Grogin et al.2005; Georgakakis et al.2008; Silverman et al.2008b). (5) X-ray AGNs preferentially reside in luminous bulges (e.g., Nandra et al.2007; Silverman et al.2008b). However, we note that these CMD results are limited to redshifts below≈1.4 and relatively bright sources (usuallymR 24), primarily due to
data-depth limitations. A natural follow-up question is: what fur-ther insights can be gained by extending CMD studies through the galaxy formation epoch when star formation and AGN ac-tivity peaked?
As data from exceptionally deep multiwavelength surveys have become available in the 2 Ms Chandra Deep Fields (see Brandt & Hasinger 2005 and Brandt & Alexander 2010 for reviews of deep extragalactic X-ray surveys), it is now feasible to push CMD studies to higher redshifts. In this paper, we aim to assess the role of AGNs in galaxy evolution by means of CMD analyses through the galaxy formation epoch, using the 2 Ms Chandra Deep Field (CDF) surveys (e.g., Alexander et al.2003; Luo et al.2008) as well as superb complementary ultradeep multiwavelength data. A key aspect of this paper is the use of reliable stellar masses and the assessment of possible stellar-mass selection effects because stellar mass is likely the most fundamental observable parameter for understanding the properties of galaxies and there are suggestions of stellar-mass biases in CMD works (e.g., Silverman et al.2009). This paper is structured as follows. Section2describes the multiwavelength data used in this work; Section3shows the derivations of source physical properties as well as AGN identification; Section 4
details sample construction; Section5gives the results obtained by this work, where we critically examine issues such as color bimodality, AGN clustering in the CMD, and evolutionary trends in the colors of AGN hosts and non-AGN galaxies, with mass-selection effects taken into account; and finally, Section6 presents the conclusions and summary. Throughout this paper, all absolute magnitudes quoted are based upon the Vega magnitude system; X-ray luminosities are absorption-corrected (i.e., intrinsic) and quoted in the 0.5–8 keV full band; and a cosmology ofH0 =70.5 km s−1Mpc−1,ΩM =0.274,
andΩΛ=0.726 derived from the 5-yearWilkinson Microwave Anisotropy Probeobservations (Komatsu et al.2009) is adopted.
2. MULTIWAVELENGTH DATA
2.1. Source Catalogs
X-ray catalogs:we made use of the 2 Ms CDF point-source catalogs. The CDF-N catalog (Alexander et al.2003) consists of 582 X-ray point sources (503 in the main Chandrasource catalog and 79 in the supplementary optically brightChandra
source catalog). The CDF-S catalog (Luo et al.2008) consists of 578 X-ray point sources (462 in the main Chandrasource catalog, 86 in the supplementary CDF-S plus E-CDF-SChandra
source catalog, and 30 in the supplementary optically bright
Chandrasource catalog).
Optical/UV/IR catalogs:for the CDF-N, we used the Hawaii HDF-N optical and NIR catalog (U, B, V , R, I, z,HK; Capak et al. 2004) as the base catalog that has a total of 48,858 sources. This base catalog is sufficiently deep and complete tomR 26. We cross-matched four other available optical/
UV/IR catalogs to the Hawaii HDF-N catalog and kept only sources that have counterparts in the Hawaii HDF-N catalog. Those catalogs are (1) the GOODS-N Advanced Camera for Surveys (ACS) and IRAC catalogs (ACS F435W, F606W, F775W, F850LP, and IRAC 3.6μm, 4.5μm, 5.8μm, 8.0μm; Dickinson et al. 2003b);11,12 (2) the GALEX HDF-N deep
imaging survey catalog (NUV, FUV; GALEX Release 4 Data13); (3) the ACS GOODS-N regionKs(<24.5) catalog (Barger et al. 2008); and (4) the GOODS-N MIPS 24μm catalog (Dickinson et al.2003b). In this work, we adopted the aperture-corrected photometry as detailed in the original references.
11 Seehttp://archive.stsci.edu/pub/hlsp/goods/catalog_r2/. 12 See
http://ssc.spitzer.caltech.edu/spitzermission/observingprograms/legacy/goods. 13 Seehttp://galex.stsci.edu/GR4/.
For the CDF-S, we combined three catalogs to produce a base catalog: (1) the MUSYC BVR-detected optical catalog (U, B, V , R, I, o3, z; Gawiser et al.2006), (2) the COMBO-17 optical catalog (U, B, V , R, I + 12 medium-band filters; Wolf et al.2004,2008), and (3) the GOODS-S MUSIC catalog (U, F435W, F606W, F775W, F850LP,J, H, Ks, and IRAC; Grazian
et al.2006). All MUSYC sources and all the unique COMBO-17 and MUSIC sources (i.e., COMBO-17 and MUSIC sources that did not match to a MUSYC source, with a matching radius of 0.5) were kept. With this approach, the base catalog has a total of 100,318 sources. This base catalog is also sufficiently deep and complete tomR 26. We then cross-matched four other
available catalogs to the base catalog and kept only sources that have counterparts in the base catalog. Those catalogs are (1) the MUSYC NIR catalog (J, H, Ks; Taylor et al.2009b), (2) the
SIMPLE IRAC catalog (Damen et al.2010), (3) the GALEX CDF-S deep imaging survey catalog (NUV, FUV; GALEX Release 4 Data), and (4) the GOODS-S MIPS 24μm catalog (Dickinson et al. 2003b). Again, we adopted the aperture-corrected photometry for analysis.
2.2. Cross-matching
Two cross-matching methods were used: closest-counterpart matching and likelihood-ratio matching. Closest-counterpart matching, as the name suggests, simply assigns the closest angu-lar match as the counterpart (given some maximum matching ra-dius); the separation between two sources is the sole criterion for this method (so it is easily implemented and executes quickly). Closest-counterpart matching performs acceptably (i.e., with a low false-match probability14), provided that an appropriate maximum-matching radius is adopted (see, e.g., Table1). Here, closest-counterpart matching was used for the cross-matching between the base catalogs and other optical/UV/IR catalogs.
The matching between the X-ray and optical/near-infrared sources is more challenging due to the fact that X-ray positions are usually not as good as the optical/near-infrared ones, which are accurate to≈0.1–0.2;15 the false-match probability increases because of the high density of faint background optical/near-infrared sources. Therefore, we used likelihood-ratio matching (e.g., Ciliegi et al. 2003; Luo et al. 2010) between the X-ray and base catalogs, which not only takes into account the positional accuracy, but also the expected magnitude distribution of the counterparts. Likelihood-ratio matching outperforms closest-counterpart matching for the matching between the X-ray and optical sources, especially when matching faint sources (see Table1).16We note that the
14We estimated the false-match probability by shifting the coordinates of base sources in R.A. and decl. by±5and re-correlating with sources from other catalogs.
15 As inferred from Table1, X-ray positional accuracies are generally not as good as optical/IR ones, but are generally better than UV positions. We note that these X-ray positional accuracies are the best so far at these fluxes due to the long exposures of the 2 Ms CDFs: the majority of sources within the centralrencircled=8area have a positional accuracy of0.4–0.5; a number of sources even have a positional accuracy of0.2 that is comparable to the optical positional accuracy (e.g., Alexander et al.2003; Luo et al.2008). 16 For the centralr
encircled=8area of the CDF-N (CDF-S), we obtained a false-match probability of 13.78% (15.86%) and a median offset of 0.364 (0.291) using closest-counterpart matching (compared to 7.57% (7.04%) and 0.369 (0.302) using likelihood-ratio matching; see Table1), with a matching radius ofrm=1.9
Δ2
X+Δ2Oused, whereΔX(ΔO=0.1) is the X-ray (optical) positional error, and the coefficient of 1.9 was chosen to obtain roughly the same number of matches as in the case of using likelihood-ratio matching for the purpose of direct comparison between methods. We refer readers to Luo et al. (2010) for more details on the likelihood-ratio matching method we used.
Table 1
Cross-matching Results for the Centralrencircled=8Areas Catalog Matching Median False Matching
Radius () Offset () Rate Method
(1) (2) (3) (4) (5)
CDF-N
GOODS-N ACS 0.50 0.145 4.76% Closest-counterpart GOODS-N IRAC 0.75 0.202 3.99% Closest-counterpart GALEX 1.00 0.505 8.25% Closest-counterpart GOODS-NKs 0.50 0.202 1.42% Closest-counterpart
GOODS-N MIPS 0.75 0.276 6.05% Closest-counterpart 2 Ms CDF-N 5.00 0.369 7.57% Likelihood-ratio
CDF-S
MUSYC NIR 0.75 0.167 3.53% Closest-counterpart SIMPLE IRAC 0.75 0.215 4.53% Closest-counterpart GALEX 1.00 0.475 8.95% Closest-counterpart GOODS-S MIPS 0.75 0.338 5.65% Closest-counterpart 2 Ms CDF-S 5.00 0.302 7.04% Likelihood-ratio
Notes.All numbers quoted in this table are for matches to the base catalogs for sources withmR 26 (only the centralrencircled=8radius areas around the respective average aim points of the 2 Ms CDFs are considered; see Section4.1
for source-selection areas). Column 1: catalog that was matched to a base catalog. For the 2 Ms CDF catalogs, all X-ray sources (i.e., not limited to AGNs) were used for the assessments here. Column 2: maximum matching radius (for closest-counterpart matching) or searching radius (for likelihood-ratio matching). Column 3: median sepalikelihood-ration of all matches between a catalog and a base catalog. Column 4: false-matching probability. For the case of the 2 Ms CDF-N catalog, four filters (U, R, I,HK) of the north base catalog were used with likelihood-ratio matching. The choice of these four filters was made to ensure broad wavelength coverage and to cover all the sources in the north base catalog using as few filters as possible (this criterion of choosing filters also applies to the south base catalog). Around 7.57% is the average of the false rates derived with the four filters: 7.06% forUband, 8.66% forRband, 9.01% for
Iband, and 5.57% forHKband, respectively. For the case of the 2 Ms CDF-S catalog, eight filters (MUSYCB, MUSYCR, MUSICI, MUSICJ, COMBO-17
U, COMBO-17R, COMBO-17 915 nm, and IRAC 3.6μm) of the south base catalog were used with likelihood-ratio matching. Around 7.04% is the average of the false rates derived with the eight filters (in the aforementioned order, 8.61%, 9.28%, 6.83%, 5.88%, 7.31%, 7.04%, 7.31%, and 4.05%, respectively). Note that the false rates from likelihood-ratio matching (i.e., 7.57% and 7.04%) not being smaller than those from closest-counterpart matching is due to the use of a larger maximum matching radius. Column 5: method that was used for matching catalogs.
same matching approach was used for both the CDF-N and CDF-S, with similar results (shown in Table 1) produced for each field.
2.3. Redshift Catalogs
We made use of both spectroscopic and photometric redshifts. We preferred high-quality spectroscopic redshifts if available (see Section4.6.2for more details); otherwise, we adopted pho-tometric redshifts (Rafferty et al.2010) derived with the Zurich Extragalactic Bayesian Redshift Analyzer (ZEBRA; Feldmann et al.2006), using the ultradeep multiwavelength data described in Section2.1. ZEBRA has features to correct systematic offsets in the photometry and construct new templates by modifying original templates based on the best fits between the photome-try and original templates. We producedzphotcatalogs for both
the CDF-N (using data from up to 18 filters) and CDF-S (using data from up to 42 filters). We note that our photometric redshifts have excellent quality considering dispersion and outliers (see Rafferty et al.2010; also see Section4.6.2). Luo et al. (2010)
No. 1, 2010 COLOR–MAGNITUDE RELATIONS OF ACTIVE AND NON-ACTIVE GALAXIES 371 derived photometric redshifts for the 462 X-ray sources in the
2 Ms CDF-S main source catalog in a similar way, but with a more sophisticated treatment of photometry; manual source deblending was performed and upper limits were set in all pho-tometric bands without detections. Therefore, phopho-tometric red-shifts from Luo et al. (2010) should on average have higher quality than our photometric redshifts and thus supersede our estimates if both estimates are available for a source (note that the two estimates are generally in good agreement with each other). We refer readers to Rafferty et al. (2010) and Luo et al. (2010) for the details onzphotderivation and a complete list of zspecreferences used.
3. SOURCE PROPERTIES
3.1. Rest-frame Absolute Magnitudes
Using the data described in Section 2.1 as well as up-per limits in theK and IRAC bands when appropriate,17 we computed rest-frame Johnson U, B, V absolute magnitudes (MU, MB, MV) for each galaxy. We adopted the approach of
template spectral energy distribution (SED) fitting to derive the absolute magnitudes, which was realized using ZEBRA. Com-pared with a linear (or log-linear) interpolation/extrapolation method, the template SED fitting reduces potential catastrophic failures, especially in cases of limited/incomplete spectral coverage.
First, we constructed a comprehensive set of galaxy and galaxy/AGN hybrid templates (see Rafferty et al. 2010 for details; also see Luo et al. 2010). Briefly, we used the 259 PEGASE galaxy templates that were employed by Grazian et al. (2006), which cover different galaxy types (elliptical, spiral, and starburst) and span a wide range of star formation history and intrinsic extinction. We also used the 10 AGN templates of Polletta et al. (2007) that include a variety of empirical quasar and Seyfert templates. To account for both the nuclear and host-galaxy emission, we constructed a series of hybrid templates between the representative AGN templates and galaxy templates (e.g., Salvato et al.2009). We chose five typical AGN templates (encompassing Type 1, Type 2, QSO 1, and QSO 2) and 16 typical PEGASE galaxy templates (encompassing elliptical, spiral, and starburst) for the construction of hybrid templates. For each pair of AGN and galaxy templates, the templates were normalized by the total integrated fluxes, and four hybrids with varying galaxy/AGN ratios (90:10, 75:25, 50:50, 25:75) were produced (note that the ratio of 10:90 is very similar to a 0:100 ratio, i.e., the original AGN templates, and thus was not included). Thus, we have a total of 330 galaxy/ AGN hybrid templates (i.e., 330=5×16×4 + 10); the number of final templates is 259 + 330=589.
Second, we ran ZEBRA in maximum-likelihood mode to identify the best-fit template and compute absolute magnitudes for each source, with the input of photometry and redshift. For moderate-luminosity AGNs that are best fit by hybrid templates, we used only galaxy-component SEDs to estimate their host physical properties (e.g., absolute magnitudes). The difference between these property estimates and those derived using hybrid template SEDs (i.e., galaxy-component plus AGN-component)
17 For each of theKand IRAC bands, a uniform upper limit is applied if there is no detection at this specific band for a source. We find that the utilization of upper limits significantly helps constrain the best-fit template for sources with limited spectral coverage, and thus produces better estimates of physical properties (e.g., rest-frame absolute magnitudes, stellar masses, and SFRs) for these sources.
is either negligible or small because the optical and near-infrared emission from moderate-luminosity active galaxies is dominated by host starlight (see Section4.6.3for details). Note that the absolute magnitudes output by ZEBRA are given in the AB system. In order to facilitate comparison with other works, these absolute AB magnitudes were converted into Vega magnitudes.
We find that our absolute magnitudes are in good agreement with those presented by Lehmer et al. (2008) for the overlap-ping sources, who adopted the approach of convolving photo-metrically derived SEDs with JohnsonU, B, V filter curves and directly computing rest-frame absolute magnitudes through in-terpolations and/or extrapolations, rather than our approach of template SED fitting. When compared to Lehmer et al. (2008), for sources in the CDF-N (CDF-S), the median ratio between the two sets of absolute magnitudes is≈1.0 (≈1.0) and there is a random scatter of0.2 mag (0.3 mag; the median luminosity ratio is≈1.0 and random scatter is≈0.1 dex for both CDFs), which may be due to the fact that slightly different photometry and photometric redshifts were used.
3.2. Stellar Masses
We estimated a set of stellar masses at various bands (Mλ,)
for each source using the following tight correlations between rest-frame optical colors and stellar mass-to-light ratios,
log(Mλ,/M)=log(Lλ/Lλ,) +bλ(MB−MV) +aλ−0.10,
(1) whereλ=B,V,R,I,J,H, andKband, respectively. Equation (1) was prescribed in Table B1 of Zibetti et al. (2009) where the values of the coefficients (aλ andbλ) can be found. The
normalization in Equation (1) has been adjusted by−0.10 dex to account for our adopted Kroupa (2001) initial mass function (IMF). We further used the relationLλ/Lλ, =2.512Mλ,−Mλ
for the mass estimation. We note that Table B1 of Zibetti et al. (2009) is a direct update of Table 7 of Bell et al. (2003) and was derived using a technique that constructs spatially resolved maps of stellar-mass surface density in local galaxies based on optical and NIR imaging, where the latest stellar population synthesis models were incorporated. We chose to use Table B1 of Zibetti et al. (2009) rather than Table 7 of Bell et al. (2003) because we find, when using the prescription in Zibetti et al. (2009), that (1) for the same color (e.g.,B−Vin Equation (1)), the stellar-mass estimates derived at different bands are in better agreement with each other, in terms of both scaling and tightness; (2) for different colors (i.e.,B−VandB−R; the set of the coefficients, aλandbλ, for theB−Rcolor can also be found in Table B1 of
Zibetti et al.2009),18 the stellar-mass estimates derived at the
same band are in better agreement with each other, in terms of scaling.
Studies have shown thatK-band galaxy luminosities are 5–10 times less sensitive to dust and stellar-population effects than optical luminosities (e.g., Bell & de Jong2000), which allows accurate stellar-mass estimations for galaxies. Therefore, for each source, we consistently adopted the stellar mass derived with the reddest absolute magnitude as the final mass estimate, applying the condition that the source must actually have a
18 We also estimated another set of stellar masses at various bands for each source using theB−Rcolor, again according to Table B1 of Zibetti et al. (2009). We find that the agreement between the two sets of stellar-mass estimates is good, so we adopted theB−Vcolor, i.e., Equation (1), for the stellar-mass estimates, given the fact that the rest-frameV-band coverage is better than the rest-frameR-band coverage for the sources.
corresponding rest-frame detection (i.e.,MK, has the highest
priority and is adopted if a source has a rest-frame K-band detection). Upper limits in theKand IRAC bands used in the template SED fitting process (see Section3.1) were not counted for the purpose of determination of reddest rest-frame coverage, although they do help avoid unrealistically large mass estimates for the sources with limited spectral coverage.
For sources in the CDF-S, we compared our stellar-mass estimates with those presented by Borch et al. (2006) and find general agreement between methods, with a median ratio of
≈0.84 between our and their estimates and0.4 dex random scatter, which is adequate for our purposes in this work.19 We speculate that the offset of mass scale may arise from the subtle differences in the IMF and the random scatter may mostly be due to the fact that we are using different photometric redshifts from those used by Borch et al. (2006).
3.3. Star Formation Rates
We estimated the SFR of each source following Equation (1) in Bell et al. (2005):
SFR(Myr−1)=9.8×10⁻¹¹(LUV/L+LIR/L), (2) where the solar bolometric luminosityL=3.9×1033erg s−1.
The dust-uncorrected ultraviolet luminosityLUVwas computed
followingLUV =3.3νlν(2800
◦
A) (see Section 3.2 of Bell et al.
2005), wherelν(2800
◦
A) is the rest-frame 2800A monochro-◦ matic luminosity that was estimated using the best-fit tem-plate SEDs derived in Section 3.1. For the estimation of the 8–1000μm infrared luminosityLIR, we employed an IDL
rou-tine “chary_elbaz_24um.pro”20 provided by Chary & Elbaz
(2001), which incorporates a library of 105 template SEDs that reproduce the observed 24μm luminosity–LIRcorrelations for local galaxies. We utilized observed MIPS 24μm fluxes (or upper limits) and redshifts to deriveLIR (or upper limits
onLIR). Papovich et al. (2007) found that SFRs derived with Equation (2) (i.e., SFRUV+24μm) are overestimated for luminous
IR galaxies, compared to the estimates of SFRUV+24,70,160μm
that also consider longer-wavelength MIPS bands (i.e., 70 and 160μm). They corrected the overestimates using an empirical second-order polynomial that fits the correlation between log (SFRUV+24,70,160μm) and log (SFRUV+24μm). We therefore
ap-plied the correction derived by Papovich et al. (2007) to our SFRUV+24μmestimates that are250Myr−1. A few percent
of the sources were corrected downward, with a multiplicative correction factor ranging from∼0.3 to 1.0 (the median correc-tion factor is∼0.8).
For sources with MIPS 24μm detections in the CDF-N (CDF-S), we find good agreement between our SFR values and those derived by Lehmer et al. (2008), with a median ratio of≈1.0 (≈1.0) between our and their SFRs, and0.2 (0.3) dex ran-dom scatter. For sources without MIPS 24μm detections in the CDF-N (CDF-S), we find≈100% (≈100%) of our upper limits on SFR are consistent with those presented by Lehmer et al. (2008). As a further check, we also computed SFRUV+70μm
(i.e., using observed MIPS 70μm fluxes to deriveLIR; an IDL routine “chary_elbaz.pro”20was used) for a subsample of 475
19 We note that estimates of stellar mass using photometry are generally accurate to within a factor of≈3–5. We refer readers to other works for detailed discussion of the complexity and uncertainty of stellar-mass estimates (e.g., Bundy et al.2006; Gallazzi & Bell2009; Muzzin et al.2009; Zibetti et al.2009).
20 Seehttp://david.elbaz3.free.fr/astro_codes/chary_elbaz.html.
sources in the CDF-S base catalog that have both MIPS 24μm and 70μm detections, and compared with their corresponding SFRUV+24μmvalues. We find good agreement between these two
sets of SFR estimates; the median ratio between SFRUV+70μm
and SFRUV+24μmis≈1.07, with a random scatter of0.4 dex
and no systematic deviations. This agreement further demon-strates that our SFRUV+24μmestimates are reliable and adequate
for our purposes in this work.
3.4. AGN Identification
For the 2 Ms CDF point-source catalogs, we used four primary criteria that rely upon distinct AGN physical properties to identify AGN candidates. The techniques of AGN identification used here are detailed in, e.g., Bauer et al. (2004) and Lehmer et al. (2008). Here, we only describe these techniques briefly. We note that a source can be identified as an AGN through multiple criteria.
1. X-ray luminosity:the intrinsic X-ray luminosity (LX; quoted
in the 0.5–8 keV band throughout this paper) was estimated using the following equation:
L0.5–8 keV =4π dL2f0.5–8 keV,int(1 +z)Γ−2, (3)
where dL is the luminosity distance, f0.5–8 keV,int is the
intrinsic (i.e., absorption-corrected) flux, and Γ is the power-law photon index of the X-ray spectrum. We derived f0.5–8 keV,intfollowing these procedures: (a) using XSPEC
(Arnaud1996), we modeled the X-ray emission with an absorbed power-law model (both Galactic and intrinsic absorption), which is defined aszpow×wabs×zwabsin XSPEC. The photon index was fixed toΓ = 1.8 (typical for intrinsic AGN spectra) for each source and the redshifts of the zpow and zwabs components were fixed to that of the source. We additionally fixed the Galactic column density toNH =1.6×1020 cm−2 for the CDF-N and to
NH =8.8×1019cm−2for the CDF-S (Stark et al.1992).
(b) We used the above absorbed power-law model to find the intrinsic column density that reproduces the observed band ratio, which is defined as the ratio of count rates between the hard (2–8 keV) and soft (0.5–2 keV) bands. (c) We removed both Galactic and intrinsic absorption to obtain the intrinsic flux. We find ourf0.5–8 keV,intestimates
to be in good agreement with those derived from spectral fitting utilizing ACIS Extract21 (F. Bauer et al. 2010, in preparation), in terms of correlation and dispersion. Local X-ray observations show that purely star-forming non-AGN galaxies usually do not have intrinsic LX
3×1042 erg s−1. We thus classify a source with L
X
3 ×1042 erg s−1 as an AGN (i.e., a luminous AGN). We note that there could be potential intruders such as high-redshift strongly star-forming sources (e.g., submil-limeter galaxies, SMGs) that have a substantial amount of X-ray emission mainly from active stellar populations (e.g., Alexander et al.2005a). However, theLX-to-SFR ratio of
these star-forming galaxies is typically lower than that of AGNs (see Criterion (3) below), which can be used as a discriminator to differentiate these non-AGN galaxies from AGNs. Indeed, we find that over≈92% of the 2 Ms CDF AGNs identified with Criterion (1) were also identi-fied with theLX-to-SFR ratio criterion (i.e., Criterion (3)),
21 Seehttp://www.astro.psu.edu/xray/docs/TARA/ae_users_guide.htmlfor details on ACIS Extract (Broos et al.2010).
No. 1, 2010 COLOR–MAGNITUDE RELATIONS OF ACTIVE AND NON-ACTIVE GALAXIES 373 which suggests that contamination by high-redshift
star-forming galaxies with Criterion (1) is not significant in our case.
2. X-ray hardness: one signature of moderately to highly obscured (NH 1022 cm−2) AGNs is their hard X-ray
spectra. If a source has an effective photon index of
Γeff1.0, we flag it as an AGN (i.e., an obscured AGN).
3. X-ray-to-SFR correlation: AGNs often show significant X-ray luminosity excesses over what is expected based on the LX–SFR correlation. We modified the LX–SFR
correlation shown in Persic & Rephaeli (2007) to L0.5–8 keV/SFR=1.06×1040erg s−1(Myr−1)−1, taking
into account the fact that we computed SFRs using Equa-tion (2). If a source hasL0.5–8 keV/SFR3 times that from
the aboveLX–SFR correlation, which corresponds to a
fac-tor of2.5 times the rms scatter of the Persic & Rephaeli
LX–SFR correlation, we classify it as an AGN.
4. X-ray-to-optical flux ratio:the X-ray-to-optical flux ratio log(f0.5–8 keV,int/fR) = −1 is regarded as a useful AGN/
galaxy discriminator. We mark a source as an AGN if it satisfies log(f0.5–8 keV,int/fR)>−1.
4. SAMPLE CONSTRUCTION
We constructed a parent sample within the 2 Ms CDFs that consists of 207 X-ray selected moderate-luminosity AGNs and a population of 12,329 galaxies that the AGNs were drawn from. We then extracted four samples, including both stellar-mass and luminosity selected samples, from this parent sample for various purposes. The details of sample construction are described below.
4.1. Source-selection Areas
We restricted our source selection to the centralrencircled=8
radius areas around the respective average aim points of the 2 Ms CDFs that are weighted by exposure time (for the CDF-N: αJ2000.0 = 12h36m45s.7, δJ2000.0 = +62o1358; for
the CDF-S: αJ2000.0 = 03h32m28s.8, δJ2000.0 = −27o4823),
and we also required GOODS-N/GOODS-S coverage with
Hubble Space Telescope(HST) of sources (only≈15% of the central rencircled = 8 areas do not have GOODS coverage).
The corresponding total selected area is≈314 arcmin2(≈155
arcmin2for the CDF-N and≈159 arcmin2for the CDF-S). The
reasons for this areal choice are as follows: (1) the central CDF areas provide the deepest X-ray coverage to date, with sensitivity limits of2.3×10−16erg cm−2 s−1for the 0.5–8 keV band. Such deep X-ray data can reduce the bias that shallower X-ray surveys have against finding AGNs in less-massive hosts (e.g., Merloni & Heinz 2008). X-ray surveys have been extremely efficient in defining reliable AGN samples; the 2 Ms CDFs have reached an AGN density of ≈7200 deg−2 (e.g., Bauer et al. 2004). (2) More accurate X-ray positions for sources in the central areas lead to more reliable matching between X-ray and faint optical sources (see Section2.2). (3) The redshift success rate (i.e., availability of spectroscopic redshifts,zspec) is
relatively high due to intensive spectroscopic investment in these areas. Furthermore, the quality of photometric redshifts (zphot)
has been greatly improved utilizing the superb multiwavelength data available. (4) The deep multiwavelength coverage within the GOODS areas (e.g., ultradeepHSTobservations provide the best optical photometry and images for analysis) allows for the construction of well-sampled rest-frame SEDs that are key to estimations ofzphotand physical properties.
For the CDF-N, there are 11,951 galaxies (253 AGNs) located within the northern rencircled = 8 area and having GOODS
coverage; for the CDF-S, there are 21,749 galaxies (250 AGNs) located within the southern rencircled = 8 area and having
GOODS coverage.22
4.2. Filter-number Cut
To ensure the reliability of the observed source SEDs, we discarded sources that have detections in less than five filters. Consequently, the above galaxy numbers of 11,951 and 21,749 are reduced to 11,949 (≈0.02% loss) and 21,376 (≈1.72% loss), respectively. We do not expect this filter-number cut to introduce any significant bias because only very small fractions of sources were dropped and dropped sources are typically very faint (and will be excluded later anyway; see themR 26 cut
in Section4.3). We note that the numbers of AGNs in the CDF-N and CDF-S are not affected by this cut (still 253 and 250, respectively).
4.3. Redshift Cut and Magnitude Cut
In addition to our areal choice and filter-number cut, we limited our sample selection to a redshift range of 0< z 4. We further applied anR-band magnitude cut ofmR26 for the
source selection, which ensures that the sources in our sample have high-quality photometry and photometric redshifts, and are only subject to minimal cross-matching failures. Complexity in the application of a uniform cut ofmR 26 arose from the fact
that differentR-band filters were used for the CDF-N (the Subaru
Rbroadband filter) and CDF-S (the COMBO-17 and MUSYC
Rbroadband filters) observations. We converted the two CDF-S R-band magnitudes to the Subaru R-band magnitude using aK-correction package (kcorrect.v4_1_423; Blanton & Roweis
2007), which convolves the photometrically derived SED (see Section2.1for the photometry catalogs used) of a source with the above threeR-band filter curves and computes the difference (ΔmR) between the derivedR-band magnitudes. Typically,ΔmR
is small (|ΔmR|0.15) with a median value of≈0.02. After
applying the redshift and magnitude cuts, our sample consists of 401 AGNs and 19,202 galaxies.
4.4. Stellar-mass Cut and/or Luminosity Cut
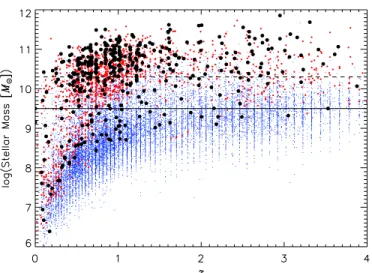
Stellar mass is likely the most fundamental observable pa-rameter for understanding the properties of galaxies. Using stellar-mass-selected samples to study galaxy evolution has some advantages over using either color- or luminosity-selected samples, e.g., avoiding biases associated with sample selec-tions (see Section6for details). Figure1shows stellar mass as a function of redshift for our sample of 401 AGNs and their 19,202 parent galaxies (see Section4.3). According to Figure1, our sample of blue (red) galaxies is roughly complete above 109.5M
(1010.3M) fromz≈0 toz≈4 (red and blue
galax-ies are separated using Equation (4) in Section5.1.1). The com-pleteness limit of 109.5M (1010.3M) is confirmed using the technique presented in Section 5.1 of Meneux et al. (2008) that constructs the mass completeness limit as a function of redshift
22 Note that the total galaxy number in the respective centralr
encircled=8 area and having GOODS coverage significantly differs between the north and south base catalogs, i.e., 11,951 versus 21,749, which is mainly due to the fact that the south base catalog was constructed in a different way from the north, and it includes a large number of faint sources (e.g.,mR>26) because the GOODS-S MUSIC catalog has a set of fainter optical and near-infrared detection limits than the north base catalog.
Figure 1.Stellar mass as a function of redshift for the sample that consists of 401 AGNs and their 19,202 parent galaxies (see Section4.3). AGNs are shown as black large filled circles; red/blue galaxies are shown as red circles/blue dots (red and blue galaxies are separated using Equation (4) in Section5.1.1). The solid (dashed) line indicates the stellar-mass cut of 109.5M
(1010.3M ), above which blue (red) galaxies in Sample A are roughly complete (see Section4.6). The apparent redshift quantization reflects the logarithmic redshift steps we adopted for deriving the photometric redshifts.
(A color version of this figure is available in the online journal.)
based on the properties (i.e., rest-frame absolute magnitude, redshift, and stellar mass) of galaxies in a sample. We therefore applied a stellar-mass cut of109.5Mto our sample.
To make direct comparisons with previous CMD studies that typically made use of luminosity limited samples, we also kept sources that satisfy a luminosity cut ofMV −19 (i.e., we
included both stellar-mass and luminosity selected samples in our parent sample; see Section4.6.1). Therefore, there are 12,329 galaxies (375 AGNs) in our sample, which have either M109.5MorMV −19.
4.5. X-ray Luminosity Cut and Removal of Broad-line AGNs
We further chose to restrict the luminosity range of AGNs to 41.9 log(LX/(erg s−1)) 43.7 (Silverman et al. 2008b).
The choice of the lower and upper luminosity limits was made to remove the contamination of any non-AGN galax-ies having significant X-ray emission, to minimize potential luminosity-dependent effects, and to ensure that the optical and near-infrared emission is primarily due to host galaxies (see Section 2.2 of Silverman et al. 2008b for details; also see Section4.6.3). There are 215 AGNs (out of 375; see Section4.4) that satisfy this X-ray luminosity cut: 215 = 375−89−71, where 89 AGNs have log(LX/(erg s−1))<41.9 and 71 AGNs
have log(LX/(erg s−1))>43.7. We note that all of the 89 AGNs
with log(LX/(erg s−1))<41.9 dropped havez1.0, which is
not the redshift range of primary interest for this study. Further-more, we have verified that our basic results do not change with these 89 AGNs included.
Even with all the above source-filtering procedures, a few broad-line AGNs (BLAGNs) can still survive in our sample that are optically bright and significantly contribute to the optical emission; we cannot obtain reliable stellar-mass constraints for these sources. We thus used the identifications of BLAGNs in the CDFs (Barger et al.2003; Szokoly et al.2004) to remove the BLAGNs remaining in our sample. After this screening, there are 207 AGNs remaining in our sample (i.e., eight BLAGNs were dropped).
Table 2
Summary of Parent Sample Construction
Criteria Galaxies Galaxies AGNs AGNs (CDF-N) (CDF-S) (CDF-N) (CDF-S) 1.rencircled=8, GOODS coverage 11951 21749 253 250
2.5 filters 11949 21376 253 250 3. 0< z4,mR26 8588 10614 230 171 4.M109.5MorMV −19 5738 6591 214 161 5. 1041.9L X1043.7 · · · 116 99 6. Not a BLAGN · · · 115 92 Parent Sample 5738 6591 115 92 4.6. Sample Properties 4.6.1. Sample Definitions
Using the above criteria (rencircled=8, having GOODS
cover-age, having no less than five filters, 0< z4,mR 26,M
109.5MorMV −19, 41.9log(LX/(erg s−1))43.7, and
not being a BLAGN; the latter two criteria are applied only to AGNs), we constructed a parent sample that consists of 207 X-ray-selected AGNs, which was drawn from a population of 12,329 galaxies. Table 2 shows a summary of parent sample construction.
We extracted four samples (A, B, C, and D) from the parent sample that are appropriate for various purposes. Table3shows some basic information about these four samples. In Sample A (0 < z 4 and M 109.5M), blue galaxies with
M109.5Mare roughly complete fromz≈0 to 4, whereas
the completeness of red galaxies is not as high (see Figure1). We used Sample A mainly for the examination of possible galaxy color bimodality up to high redshifts (see Section5.1) because Sample A, consisting of a sufficient number of blue and red galaxies, is suitable for this purpose. There are only a few AGNs with 3 < z 4 in Sample A. We thus focused on a redshift subrange of 0< z3 in Sample A for studying both AGNs and their hosts, using Sample B (0< z3 andM109.5M) and
Sample C (0< z3 andM1010.3M) that are two subsets
of Sample A. We note that the mass cut of 1010.3M
in Sample
C is the mass above which both AGN hosts and non-AGN galaxies have similar distributions of rest-frame U−V color (see Section5.3). In Sample B, only blue galaxies are roughly complete; while in Sample C, both blue and red galaxies are roughly complete (see Figure1). Therefore, these two samples were often used together to examine the effects of sample incompleteness on various results (see Sections 5.2and5.3). Sample D (0< z3 andMV −19) was used to represent
luminosity-limited samples that have typically been adopted in previous CMD studies; the CMD results obtained with Sample D were compared with those from mass-limited samples (i.e., Samples A, B, and C, which are the main focus of this work). In the remainder of Section4.6, we describe the properties of Sample A, which includes both Samples B and C.
4.6.2. Quality of Photometric Redshifts
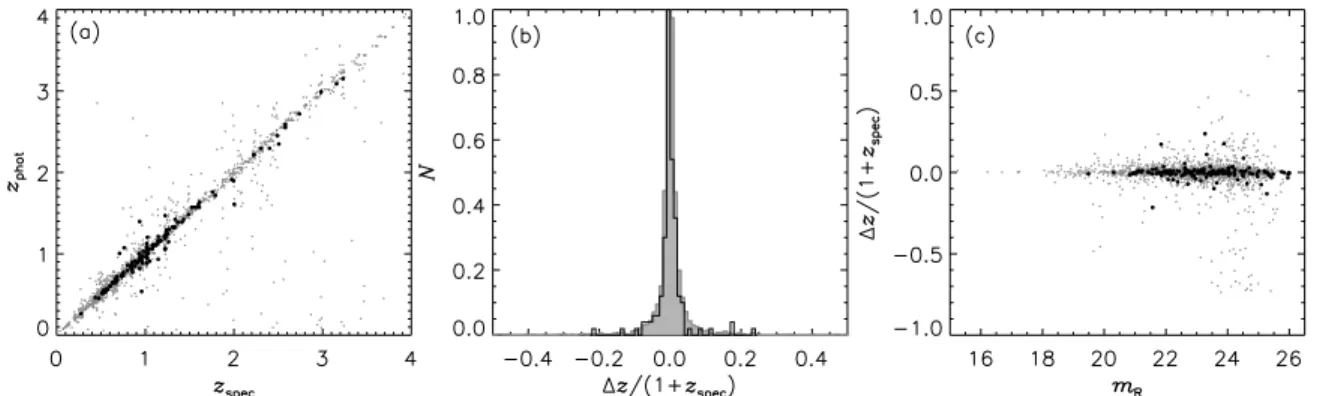
We assessed the zphot quality for Sample A (see Figure 2) by using a number of quantities produced by a comparison of the photometric and spectroscopic redshifts of the sample: the normalized median absolute deviation (σNMAD = 1.48×
median[|(Δz−median(Δz))/(1 +zspec)|]), the average absolute
scatter (AAS=mean[|Δz/(1 +zspec)|]), and the percentages of
outliers (P0.2(0.1) outlier) with|Δz|/(1 +zspec)>0.2(0.1), where Δz=zphot−zspec. For the AGNs, we find thatσNMAD=0.0154,
No. 1, 2010 COLOR–MAGNITUDE RELATIONS OF ACTIVE AND NON-ACTIVE GALAXIES 375
Figure 2.Plots ofzphotquality checks for Sample A, with AGNs shown as filled circles/solid histogram and non-AGN galaxies shown as gray dots/gray histogram. (a)zphotvs.zspec. (b) Normalized histograms ofΔz/(1 +zspec). The histograms largely overlap each other because AGNs and non-AGN galaxies have photometric redshifts of similar quality. (c)Δz/(1 +zspec) as a function ofR-band magnitudemR.
Table 3
Galaxy and AGN Samples Drawn from Parent Sample
Sample Condition No. of Galaxies No. of AGNs Main Purpose Sample A 0< z4,M109.5M 4941 188 Color bimodality
Sample B 0< z3,M109.5M 4357 185 CMD, color dependence, AGN fraction, etc. Sample C 0< z3,M1010.3M 1468 139 CMD, color dependence, AGN fraction, etc. Sample D 0< z3,MV −19 11119 202 CMD, color dependence, AGN fraction, etc. AAS=0.0214,P0.2 outlier =1.35%, andP0.1 outlier =4.05%;
for the galaxies, we find thatσNMAD=0.0153, AAS=0.0323, P0.2 outlier = 2.54%, and P0.1 outlier = 5.51%. We owe such
a good quality of zphot to the large CDF multiwavelength
observational investments and continuous efforts of improving zphotestimation techniques (see, e.g., Luo et al.2010; Rafferty
et al.2010, and references therein). However, as cautioned by Luo et al. (2010) and Rafferty et al. (2010), the spectroscopic subsample is likely to have significantly better photometric redshifts than the full sample due to two reasons: (1) the sources in the spectroscopic subsample are generally brighter and therefore not entirely representative of the full sample and (2) the template-improvement step (see Section2.3) used in the zphot derivation optimizes the templates for the spectroscopic
subsample and thus introduces a bias that is favorable to the spectroscopic subsample.24
We do not expect the photometric redshift uncertainties to introduce a systematic bias in the estimation of source prop-erties (e.g., rest-frame absolute magnitudes) because there is no systematic offset between photometric redshifts and spectro-scopic redshifts and the residuals between photometric redshifts and spectroscopic redshifts are approximately symmetric (see Figure2). Table4 showszspecfractions of the sources within different redshift ranges in Sample A, which indicates that the zspec fractions for AGNs are quite high and those for galaxies are reasonably high, especially at low redshifts.
4.6.3. AGN Contamination
The X-ray luminosity cut of 41.9 log(LX) 43.7
(see Section 4.5) was adopted to minimize potential AGN contamination of optical and near-infrared emission from host
24 In order to assess the actual quality of our photometric redshifts, we repeated a divided-sample test several times: we ran template-improvement mode with≈3/4 of the sources in the spectroscopic subsample that were randomly selected and then applied the obtained improved templates to the unselected≈1/4 of the sources to test for quality. The tests suggest that the percentage of outliers for the non-trained sources is larger than that for the trained sources:P0.2 outlier≈6.5% (≈14.9%) for the non-trained galaxies (AGNs).
Table 4
zspecFractions for Different Redshift Bins in Sample A
Redshift No. of Galaxies (% ofzspec) No. of AGNs (% ofzspec)
0< z1 1626 (68.7%) 83 (94.0%) 1< z2 1570 (36.5%) 85 (71.8%) 2< z3 1161 (15.0%) 17 (47.1%) 3< z4 584 (10.6%) 3 (33.3%) 0< z3 4357 (42.8%) 185 (79.5%) 0< z4 4941 (39.0%) 188 (78.7%)
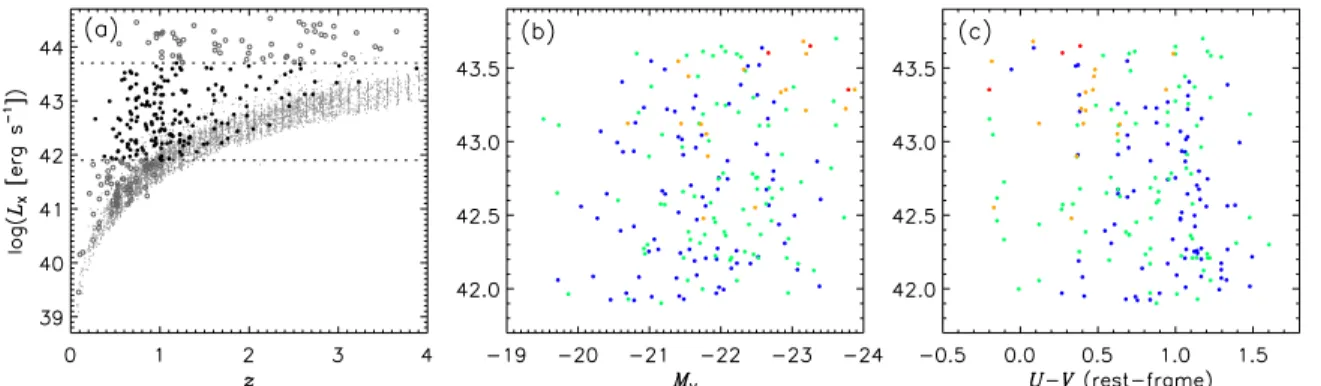
galaxies. Below we present four additional arguments to show that the optical and near-infrared emission from the 188 active galaxies in Sample A is dominated by host starlight and not strongly influenced by the AGNs. (1) Of these 188 AGNs, 186 (≈99%) have best-fit SED templates with the optical and near-infrared emission dominated by galaxy starlight. (2) Figure3shows 0.5–8 keV luminosities of these 188 AGNs as a function of redshift, V-band absolute magnitude, and rest-frame U−V color (i.e., MU −MV), respectively. According
to Figures3(b) and3(c), there is no clear correlation between X-ray luminosity and eitherMVorU−V. This is consistent with
the X-ray and optical emission not being produced by the same process, suggesting that the optical emission is not likely to be dominated by the AGN component. (3) Following Silverman et al. (2008b), we determined conservative upper limits on the AGN contribution to the total (galaxy+AGN) optical emission using the HSTACS V606- and z850-band images (rescaled to
0.03 pixel−1) provided by GOODS. About a dozen AGNs were not included in the analysis due to their proximity to the ACS field edge. We measured optical counts in circular apertures of two different sizes (r=3 and 25 pixels, i.e.,r=0.09 and 0.75, respectively) located at the centroid of the optical emission. r = 0.09 (r =0.75) covers a physical scale of 0.378–0.763 (3.147–6.354) kpc for these AGNs with z ≈ 0.276–3.785. Figures4(a) and4(b) show the histograms of the ratio of counts between these two apertures for the AGN hosts for the two ACS bands, respectively. We note that these ratios provide a firm upper limit to the AGN contribution since we did not remove
Figure 3.(a) 0.5–8 keV luminosity as a function of redshift for Sample A (see Section4.6). Filled circles indicate AGNs and small gray dots indicate non-AGN galaxies with their upper limits derived from corresponding sensitivity maps. The spread of a factor of≈3 in the upper limits at a given redshift reflects the sensitivity variation with off-axis angle, i.e., a smaller off-axis angle corresponds to a higher sensitivity. The two dashed lines show the X-ray luminosity cut of 41.9log(LX/(erg s−1))43.7. For comparison, AGNs that lie outside the luminosity range of 41.9log(LX/(erg s−1))43.7 are shown as gray circles. (b) 0.5–8 keV luminosity as a function ofMVfor the AGNs in Sample A. (c) 0.5–8 keV luminosity as a function of rest-frameU−Vcolor for the AGNs in Sample A.
AGNs in panels (b) and (c) are color-coded such that the blue (green, orange, red) color represents 0< z1 (1< z2, 2< z3, 3< z4). No apparent correlation is seen in panel (b) or (c), demonstrating that the optical emission of these AGN hosts should not be dominated by the active nuclei.
(A color version of this figure is available in the online journal.)
stellar emission within the small aperture. For theV606band (z850
band), the mean ratio of counts of these AGNs is 0.142 (0.139), and 84.2% (87.2%) of them have a ratio less than 0.25, which indicate that the optical emission is not dominated by the AGN component. Note also that these AGN hosts have count ratios similar to the parent population of galaxies. (4) According to Figures4(c) and4(d), there is no apparent correlation between X-ray luminosity and the ratio of counts for the AGN hosts, which supports the conclusion that the optical emission is not dominated by the AGN component. Generally speaking, galaxy surface brightness dims with increasing redshift and the contrast ratio between a nuclear point source and its host galaxy increases toward higher redshifts. This could potentially impact our conclusion (for high-redshift AGNs) that the optical emission is not dominated by the AGN component. However, as shown in Figures4(c) and4(d), this does not appear to be an issue with AGNs in Sample A because the ratio of counts does not tend to be larger for sources with larger redshifts.
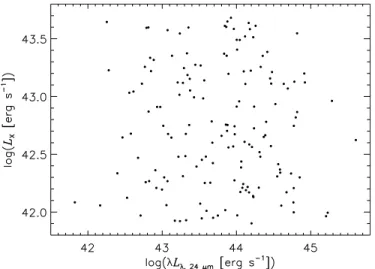
Figure 5 shows X-ray luminosity as a function of MIPS λLλ,24μmfor the 157 AGNs in Sample A that have MIPS 24μm
detections. There is no apparent correlation between LX and
λLλ,24μm for these AGNs, which is consistent with the X-ray
and 24 μm emission not being produced by the same process, suggesting that, typically, these AGNs do not significantly affect the observed 24 μm fluxes that are used to compute the SFRs.
4.6.4. Sample Overview
Table5presents relevant data and Figure6shows histograms of several physical properties for the sources in Sample A. In Sample A,≈95% (≈98%) of the sources have rest-frameK -band (I-band) coverage or beyond, which ensures the reliability of our stellar-mass estimates (see Section 3.2). As seen in Figure6(c), it is apparent that AGN hosts are generally more massive than non-AGN galaxies.
In Sample A,≈23% (≈16%) of the galaxies (AGNs) have no MIPS 24μm detection and were given upper limits on SFR. At 0< z1 none of the sources without MIPS 24μm detections has an upper limit on SFR greater than 10M yr−1, and at 1< z2 (2< z3) only two of the galaxies without MIPS 24μm detections have upper limits on SFR greater than 20 (30)Myr−1; these indicate that Sample A is roughly complete above SFR≈10 (20, 30)M yr−1 at 0< z1 (1< z2, 2< z3).
Figure 4.AGN contribution to the total (galaxy+AGN) optical emission in the
V606 band andz850band (see Section4.5) for Sample A. The ratio of counts is computed by measuring optical counts in circular apertures of two different sizes (r =3 and 25 pixels, i.e.,r =0.09 and 0.75, respectively) located at the centroid of the optical emission. These ratios should provide a firm upper limit to the AGN contribution since we did not remove stellar emission within the small aperture. (a) and (b) histograms of the ratio of counts of the AGN hosts (solid histograms) and non-AGN galaxies (dotted histograms), where the non-AGN galaxy numbers have been scaled to match those of the AGN hosts. The majority of the AGN hosts have75% of their total optical emission (in theV606andz850bands) from outside ofr=0.09 and have count ratios similar to the parent population of galaxies. (c) and (d) X-ray luminosity vs. ratio of counts for the AGN hosts in theV606band andz850band. There is no clear correlation between X-ray luminosity and the ratio of counts for the AGN hosts, which supports the conclusion that the optical emission is not dominated by the AGN component. We note that there are a few AGN hosts that have a ratio of counts greater than 0.5, which should not be a problem because their optical images appear normal and the ratio of counts only represents an upper limit of AGN contribution to the total optical emission. AGNs in panels (c) and (d) are color-coded in the same way as those in Figures3(b) and3(c).
(A color version of this figure is available in the online journal.)
Figure3(a) shows 0.5–8 keV luminosities of AGNs in Sample A as a function of redshift. According to Figure3(a), AGNs in Sample A are complete up toz≈1.5, whereas the completeness drops toward higher redshifts; above log(LX)≈43.0, AGNs in
No. 1 , 2010 COLOR–MA GNITUDE RELA TIONS OF A CTIVE AND NON-A CTIVE GALAXIES 377 Table 5
Relevant Data for the Sources in Sample A
No. R.A.J2000.0 Decl.J2000.0 z mR MU MB MV log (MB/V /R/I /J /H /K,/M) Fmass SFR (Myr−1) XID log[LX/(erg s−1)]
(1) (2) (3) (4) (5) (6) (7) (8) (9) (10) (11) (12) (13) 1 189.37823 62.18428 2.486 25.33 −21.73 −21.68 −22.01 (10.12, 10.13, 10.11, 10.08, 9.95, 9.89, 9.91) 7 8.7 0 −42.85 2 189.37852 62.18563 0.681 22.13 −20.30 −20.09 −20.53 (9.74, 9.75, 9.76, 9.80, 9.71, 9.69, 9.63) 7 −1.8 0 −41.46 3 189.38080 62.18413 1.169 24.49 −20.38 −20.39 −20.80 (9.78, 9.79, 9.77, 9.74, 9.63, 9.59, 9.61) 7 6.0 0 −42.02 4 189.26192 62.18623 +0.559 22.20 −19.77 −20.01 −20.80 (10.49, 10.50, 10.53, 10.56, 10.46, 10.43, 10.39) 7 6.0 0 −41.03 5 189.26080 62.18484 +1.014 23.72 −20.50 −19.94 −20.42 (9.76, 9.76, 9.79, 9.85, 9.77, 9.75, 9.70) 7 3.5 0 −41.67 Notes.The full table contains 4941 entries. Column 1: source sequence number. Columns 2 and 3: J2000 R.A. and decl. of the optical counterpart (in degrees), respectively. Column 4: spectroscopic redshift (with a plus sign) or photometric redshift (without a plus sign). Column 5: apparentR-band magnitude (AB mags). Columns 6–8: rest-frame absolute JohnsonU-,B-, andV-band magnitude (Vega mags), respectively. Column 9: stellar-mass estimate derived at theB,V,R,I,J,H, andKband (irregardless of whether there is corresponding rest-frame coverage of a source), respectively. For the 4941 sources in Sample A, the median of (MB/V /R/I /J /H ,)/MK,is≈(1.46, 1.49, 1.48, 1.51, 1.19, 1.08), respectively. Column 10: flag of reddest rest-frame coverage of a source. This flag shows which stellar-mass estimate is adopted as the final estimate for a source (see Section3.2).Fmass=(1,2,3,4,5,6,7) means thatMB/V /R/I /J /H /K,is adopted for a source, respectively. Column 11: SFR (positive value) or upper limit on ıSFR (negative value). Column 12: X-ray ID from Alexander et al. (2003) for the CDF-N AGNs (XID>0) and Luo et al. (2008) for the CDF-S AGNs (XID<0), respectively (XID=0 for non-AGN galaxies). Four CDF-N AGNs have XID>503 and are from the CDF-N supplementary optically brightChandrasource catalog; their corresponding XIDs in this supplementary catalog are XID−503. Two CDF-S AGNs have 462<XID548 (XID>548) and are from the supplementary CDF-S plus E-CDF-SChandrasource catalog (the CDF-S supplementary optically brightChandrasource catalog); their corresponding XIDs in this supplementary catalog are XID−462 (XID−548). Column 13: intrinsic 0.5–8 keV X-ray luminosity (positive value; for AGNs) or upper limit on intrinsic 0.5–8 keV X-ray luminosity (negative value; for non-AGN galaxies).
Figure 5.X-ray luminosity as a function of MIPSλLλ,24μmfor the 157 AGNs in Sample A that have MIPS 24μm detections. There is no apparent correlation betweenLXandλLλ,24μm, which suggests that these AGNs do not significantly affect the observed 24μm fluxes that are used to compute the SFRs. Sample A are roughly complete out to z ≈ 3. We note that the incompleteness of X-ray AGNs at high redshifts does not affect AGN fraction calculations using the method detailed in Section5.2.1.
5. RESULTS
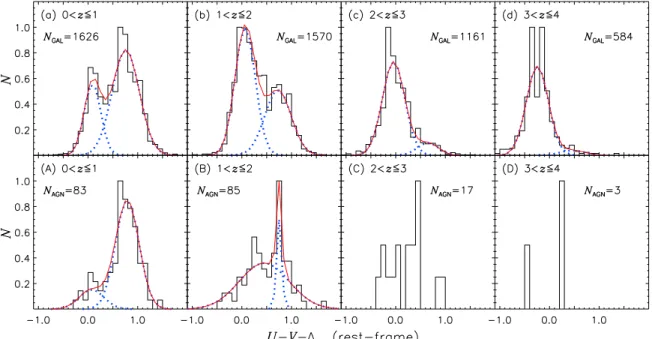
We chose to use the rest-frameU−Vcolor (i.e.,MU −MV)
throughout this section because this color straddles the 4000A◦ break of the continuum and better tracks the age and metallicity variations of the stellar populations in galaxies than theU−B
(i.e.,MU−MB) color (e.g., Bell et al.2004). We have confirmed
that the same basic results can be obtained by using the rest-frameU−Bcolor.
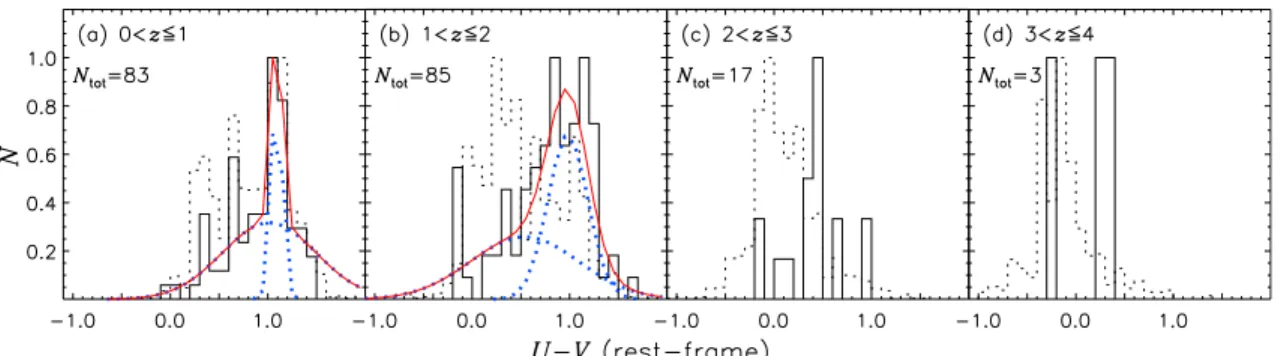
5.1. Color Bimodality
In this subsection, we examine whether there is color bimodal-ity (i.e., separation of the red sequence and the blue cloud) for non-AGN galaxies and AGN hosts in Sample A.
5.1.1. Color Bimodality: Non-AGN Galaxies
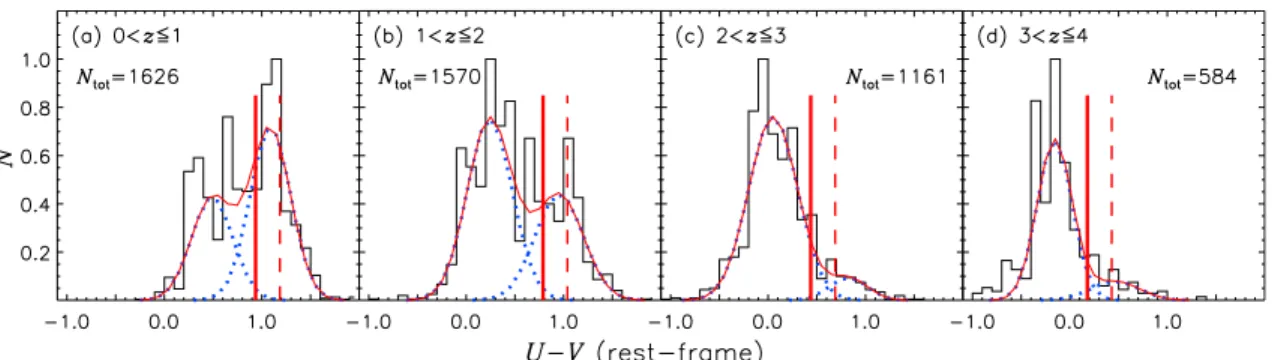
Figure7shows histograms of rest-frameU−Vcolor for non-AGN galaxies in Sample A, which spans a broad range of about
−1.0U−V 2.0. The histograms were made with a set of redshift bins ofΔz=1.0 overz=0–4. The choice ofΔz=1.0 facilitates examination of possible color evolution over cosmic time, avoids likely dilution of potential bimodal color behaviors when a wide range of redshift is considered (e.g.,Δz =2.0), and avoids poor statistics due to low source counts in a narrow redshift bin (e.g.,Δz=0.2).
We find that, in all four redshift ranges, the histogram of
U−V color for non-AGN galaxies can acceptably be fitted (usingχ2fitting) by two Gaussian components each in the form ofN =GNexp(−[(X−GC)/GW]2/2), whereX=U−V,GN
is a normalization factor, andGC(GW) is the centroid (width)
of the Gaussian component.25The best-fit Gaussian parameters
25 Based on previous works that established galaxy color bimodality, we applied an additional constraint of 0.1GW0.5 to the Gaussian fits, i.e., we required that the width of the Gaussian component not be too small or too large. We did not apply this additional constraint when examining possible color bimodality for AGN hosts because there is no established color bimodality for AGN hosts.
Figure 6.Histograms of physical properties for Sample A, with AGNs shown as solid lines and non-AGN galaxies as dotted lines: (a) redshift; (b)R-band magnitude; (c) stellar mass; (d) 0.5–8 keV X-ray luminosity; (e) effective photon index. The number of non-AGN galaxies has been rescaled to match that of AGNs in each plot. The histogram of SFR is not shown due to the existence of upper limits on SFR (see Section3.3).
can be found in Table6. We note that a bimodal signature of the galaxy color distribution seems to be present in all four redshift ranges, although only a weak redward tail can be seen in the highest range (see Figure7). We then tested for bimodality of the galaxy color distribution using the KMM mixture-modeling algorithm (e.g., Ashman et al.1994). This algorithm indicates bimodal color distributions with high statistical significance in all four redshift ranges shown in Figure7, with the derived KMM
P-values all being equal to zero (see Table6for theP-values and corresponding mean values of two potential sub-populations). However, we caution that the above seemingly established color bimodality is based on an assumption of Gaussian-distributed populations, which is unlikely to be the true distribution.
To assess further the validity of the claim of color bimodality, we imposed three additional necessary conditions (i.e., these three conditions must be satisfied in order for a bimodality claim): (1) the quantity|GC1−GC2|/
G2W1+G2W2should be equal or greater than 0.707 (i.e.,√2/2), where the value of 0.707 is obtained when|GC1−GC2| =GW1=GW2. This quantity is a measure of separation between the centroids of two components. (2) The quantityGN1/GN2should be in a range roughly from 0.1
to 10; i.e., one component should not be negligible compared to the other. (3) The requirement of a two-Gaussian-component fit (rather than a single-Gaussian-component fit) is statistically significant. To address Condition (3), we calculated the F -statistic and its associated probability given “new” and “old” values of χ2 and degrees of freedom (i.e., values derived from two-Gaussian-component fits versus those derived from single-Gaussian-component fits). A low probability from theF