Explicit Spatial Scattering for Load Balancing
in Conservatively Synchronized
Parallel Discrete-Event Simulations
Sunil Thulasidasan
Shiva Prasad Kasiviswanathan
Stephan Eidenbenz
Phillip Romero
Los Alamos National Laboratory
{
sunil,kasivisw,eidenben,phil
}
@lanl.gov
Abstract—We re-examine the problem of load balancing in conservatively synchronized parallel, discrete-event sim-ulations executed on high-performance computing clusters, focusing on simulations where computational and messag-ing load tend to be spatially clustered. Such domains are frequently characterized by the presence of geographic “hot-spots” – regions that generate significantly more simulation events than others. Examples of such domains include simulation of urban regions, transportation net-works and netnet-works where interaction between entities is often constrained by physical proximity.
Noting that in conservatively synchronized parallel sim-ulations, the speed of execution of the simulation is de-termined by the slowest ( i.e most heavily loaded) simula-tion process, we study different partisimula-tioning strategies in achieving equitable processor-load distribution in domains with spatially clustered load. In particular, we study the effectiveness of partitioning via spatial scattering to achieve optimal load balance. In this partitioning technique, nearby entities are explicitly assigned to different processors, thereby scattering the load across the cluster. This is motivated by two observations, namely, (i) since load is spatially clustered, spatial scattering should, intuitively, spread the load across the compute cluster, and (ii) in parallel simulations, equitable distribution of CPU load is a greater determinant of execution speed than message passing overhead. Through large-scale simulation experi-ments – both of abstracted and real simulation models – we observe that scatter partitioning, even with its greatly increased messaging overhead, significantly outperforms more conventional spatial partitioning techniques that seek to reduce messaging overhead.
Further, even if hot-spots change over the course of the simulation, if the underlying feature of spatial clustering is retained, load continues to be balanced with spatial scat-tering leading us to the observation that spatial scatscat-tering can often obviate the need for dynamic load balancing.
I. INTRODUCTION
In parallel computing, achieving an equitable distri-bution of load across available computing resources is a significant challenge and often necessitated on high performance computing platforms, where idle processors represent a huge waste of computational power. The
problem of unbalanced load is especially egregious in conservatively synchronized parallel simulation systems, where causality constraints dictate that the simulation clock of any two processes not differ by more than a given time factor (called the look-ahead) [6]. Thus, a processor with relatively large event load, whose simula-tion clock advances at a much slower rate, can severely degrade the performance of the entire simulation.
The load distribution in a parallel simulation is in-herently an outcome of the partitioning strategy used to assign simulation entities to processors. Most of the research into the issue of load balancing and partitioning in parallel simulations has been approached from the perspective of dynamic load balancing. An algorithm based on process migration – a challenging task in itself – for dynamic load balancing for conservative parallel simulations is described in [2]. Another dynamic load balancing algorithm based on spatial partitioning for a simulation employing optimistic synchronization is described in [4] and [5], which involves the movement of spatial data between neighboring processes. A scheme using PVM [1] for parallel discrete event simulations is described in [8]. General partitioning and data decom-position strategies for parallel processing are explored in [3] but the authors do not specifically consider parallel simulation applications.
Dynamic load-balancing, in general, presents signifi-cant implementation challenges in parallel simulations, due to the complexity of migrating a simulation object to a different process. In this paper, we explore static partitioning strategies for load balancing in parallel sim-ulations, concerning ourselves specifically to problems where (i) conservatively synchronized parallel simulation is used, and (ii) the problem domains exhibit spatial
clustering of load. Such domains are frequently
charac-terized by the presence of geographic “hot-spots” i.e. re-gions that generate significantly more computational and messaging load than other regions. Examples of such
do-mains include simulation of urban regions, transportation networks, epidemiological and biological networks and generally, networks where interaction between entities is often constrained by physical proximity.
The main partitioning technique described in this paper – spatial scattering, where nearby entities are explicitly assigned to different processors with the aim of scattering the load across the processors – is motivated by two observations, namely, (i) in many domains, load tends to be spatially clustered and spatial scattering should, therefore, spread the load across the compute cluster, and (ii) in parallel simulations, equitable distri-bution of CPU load is often a greater determinant of execution speed than message passing overhead.
An analysis of the scatter partitioning technique, based on observations that are similar to the ones that motivated this work, was originally presented in [7]. In that model (based on the authors’ experiences with one-dimensional fluid-flow computations and other numerically intensive problem domains), work-loads of nearby regions also exhibit strong correlation, and the conclusions reached are similar to ours. The cost of increased communication (which is very architecture dependent) that result from a scatter-based decomposition of processor workloads were not not part of that model; thus, our work is a val-idation of the results of [7] on present-day architectures with high-speed interconnects.
Through large-scale parallel simulation experiments – both of abstracted and real simulation models – on HPC clusters, we observe that scatter partitioning – even with its greatly increased messaging overhead – often significantly outperforms more conventional spatial partitioning techniques that seek to reduce messaging overhead. Further, even if hot-spots change over the course of the simulation, if the underlying feature of spa-tial clustering is retained, load continues to be balanced, which leads us to the observation that spatial scattering can often obviate the need for dynamic load balancing. In what follows, we first present a method to generate an abstracted model of a network with spatially clustered entity and load distribution. Next we present experimen-tal results from distributed simulation experiments on the abstract model using different partition strategies, comparing the performance of scatter partitioning with other algorithms. Finally we evaluate load-balancing and scaling results using scatter on a real application simulator – a scalable, parallel transportation simulator that uses real road networks and realistic traffic patterns.
II. MODELINGSIMULATIONAPPLICATIONS WITH
SPATIALLOADCLUSTERING
In this section, we describe an abstracted simulation model that we use to compare different partitioning schemes. Our model allows us to capture real world features like the presence of dense regions with large load profiles. We first construct a graph G = (V, E), which we call the simulation graph; the vertices in the graph, which are points in a plane lying within a bounding box, are also the load centers that generate the computation and messaging load. Messages are sent between vertices inG.
a) Vertex creation process: We start with a
bound-ing box B (a square in our case) and discretize B
into 100 equally sized square cells {c1, . . . , c100}. The
population of each cell (i.e., the number of vertices in each cell) is generated according to a distribution D
(in our experiments D is either normal, uniform, or exponential). We set the mean of the distribution as
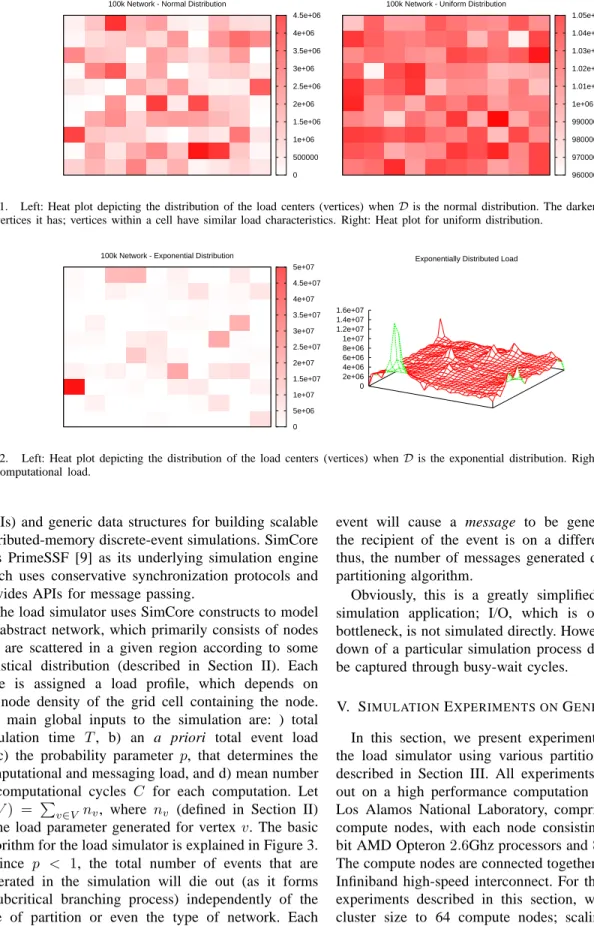
10,000(in the case of normal distribution the standard deviation is1/10of the mean ). Letsi, chosen fromD, be the size of the cell ci (where 1 ≤ i ≤ 100). Then for each cell ci, we assign si random vertices that are distributed within the given cell. Figures 1 and 2 show the spread of the vertices in the bounding box when the distributionD is normal, uniform, and exponential, respectively.
b) Edge creation process: Once the vertices are
created, we create edges in G. For our purpose, edges represent channels of communication between vertices in the graph i.e each vertex only communicates with another vertex with whom it shares an edge. Since one of the features of networks that exhibit spatial clustering is short edges, during the edge creation phase, an edge is much more likely to be assigned between vertices that are close to each other. Let v be a vertex in G. Let
1≤α≤2 be a parameter. Define,
D(v) = X u∈V
d(u, v)−α
whered(u, v)is the Euclidean distance betweenuandv. We pick an edge(v, u)in the graphGwith probability
d(v, u)−α/D(v). This guarantees that most of the edges
within the graph are small. In our experiments, we set
α= 2.
c) Computational load generation procedure: We
generate a load demand for each vertex in the graph as follows: for a cell ci with si vertices lying inside it, the mean of the load (normally distributed within the cell) is si and the standard deviation si/10. For every vertex v ∈ V we do the following: if cj is the cell
that contains v (i.e., the coordinates ofv lie within the boundary of cj), then we pick a random number nv
from a normal distribution with mean sj and standard deviationsj/10. The load on v is then proportional to
nv(the exact mechanism for generating load is described in Section IV). The right part of Figure 2 shows the spatial distribution of computational load when D is exponentially distributed.
The load of a vertex dictates the number of cycles spent by the processor to which v has been assigned. Additional computational load might be generated for each vertex due to messages it receives (see below).
d) Message load generation procedure: The
pre-vious three steps are executed in the network creation phase, and are input to the simulation. Message gener-ation occurs during the simulgener-ation as follows: initially each vertex v schedules mv messages for itself, mv
being dependent on the load demand for that vertex generated in the previous step. When a vertex u re-ceives a message it does the following: with probability
p, vertex u generates another message and sends this message to one of its neighbors picked randomly from its neighbor-list, and with probability1−pit executes a busy-wait cycle to emulate computational load. We refer to p as the message forwarding probability, and is an input parameter in our experiments.
III. PARTITIONINGSTRATEGIES
As noted before, in parallel discrete-event simulation with conservative synchronization schemes, the differ-ence between the simulation clocks of any two logical processes is constrained by the look-ahead time. Thus, a simulation process with a relatively high computation load, whose simulation clock progresses at a slower rate, slows down the entire system; essentially the speed of simulation execution is determined by the slowest process.
The computational load on a simulation process is determined by the partitioning scheme used to assign simulation objects to processors. In this section, we explore different strategies for partitioning the simula-tion workload on a high performance cluster. The ideal partitioning algorithm achieves perfectly balanced com-putational load while also keeping message overhead to a minimum. For networks with spatially clustered load, we explore the effectiveness of four different partitioning algorithms in this paper.
(1) Geographic Partitioning with Balanced Entity Load: In networks with spatially clustered load,
mes-sage trajectories are also spatially constrained. Thus, most of the messages are exchanged between entities that lie close to each other. A partition algorithm that
minimizes messaging overhead would assign entities that are geographically close to the same processor. A simple geographic partitioning scheme would divide the simulated region into a grid, and assign every entity that falls into a grid cell to the same processor. Since the network is not uniformly distributed in terms of node density (as is the case with exponential and normally distributed networks seen earlier), a naive geographic partitioning would end up with highly unbalanced load. To mitigate this effect, we perform a geometric sweep assigning equal number of entities to each grid cell; the resulting partition will consist of non-uniform rectangular grid cells.
(2) Geographic Partitioning with Balanced Compu-tational Load: CompuCompu-tational load distribution can
also be highly uneven in certain networks, especially networks with exponential properties. In such case, a geographic partitioning with balanced entities can result in unbalanced computation load. An alternative approach to balancing entity number is to balance the estimated computational load across processors during a geographical sweep. While this is fairly easy to do when one has a priori knowledge about load, as is the case in our abstracted model, in real applications this is often a difficult task. Load profiles can vary significantly during the course of the simulation, and complicated network effects can come into play al-tering the estimated load contribution of a network entity.
(3) Scatter Partitioning: Scatter partition exploits the
property of spatial clustering of load by explicitly assigning entities that lie close to each other to
dif-ferent processors i.e., entities are scattered across the
cluster. Since entities that are close to each other have similar load characteristics, by scattering the entities one achieves the effect of scattering the load across the cluster. The obvious drawback to this approach is the additional messaging and synchronization overhead. However, one of our observations in this paper is that, often, for a large-scale parallel simulations on high performance clusters with fast interconnects, the computation time dominates message passing over-head. As we shall see in the following sections, the additional overhead from message passing is more than compensated for by balanced load.
IV. DISTRIBUTEDSIMULATIONS OFABSTRACT
MODEL
To simulate our abstracted network and load model, we implemented a parallel, discrete event load simulator. For this, we used a generic C++ framework called Sim-Core that provides application programming interfaces
100k Network - Normal Distribution 0 500000 1e+06 1.5e+06 2e+06 2.5e+06 3e+06 3.5e+06 4e+06 4.5e+06
100k Network - Uniform Distribution "100k.uni.heat_matrix.10x10" matrix 960000 970000 980000 990000 1e+06 1.01e+06 1.02e+06 1.03e+06 1.04e+06 1.05e+06
Fig. 1. Left: Heat plot depicting the distribution of the load centers (vertices) whenDis the normal distribution. The darker a cell, the more
the vertices it has; vertices within a cell have similar load characteristics. Right: Heat plot for uniform distribution.
100k Network - Exponential Distribution
0 5e+06 1e+07 1.5e+07 2e+07 2.5e+07 3e+07 3.5e+07 4e+07 4.5e+07 5e+07
Exponentially Distributed Load
0 2e+06 4e+06 6e+06 8e+06 1e+07 1.2e+07 1.4e+07 1.6e+07
Fig. 2. Left: Heat plot depicting the distribution of the load centers (vertices) whenDis the exponential distribution. Right: Distribution of
the computational load.
(APIs) and generic data structures for building scalable distributed-memory discrete-event simulations. SimCore uses PrimeSSF [9] as its underlying simulation engine which uses conservative synchronization protocols and provides APIs for message passing.
The load simulator uses SimCore constructs to model the abstract network, which primarily consists of nodes that are scattered in a given region according to some statistical distribution (described in Section II). Each node is assigned a load profile, which depends on the node density of the grid cell containing the node. The main global inputs to the simulation are: ) total simulation time T, b) an a priori total event load
L, c) the probability parameter p, that determines the computational and messaging load, and d) mean number of computational cycles C for each computation. Let
N(V) = Pv∈V nv, where nv (defined in Section II)
is the load parameter generated for vertexv. The basic algorithm for the load simulator is explained in Figure 3. Since p < 1, the total number of events that are generated in the simulation will die out (as it forms a subcritical branching process) independently of the type of partition or even the type of network. Each
event will cause a message to be generated only if the recipient of the event is on a different processor; thus, the number of messages generated depend on the partitioning algorithm.
Obviously, this is a greatly simplified model of a simulation application; I/O, which is often a major bottleneck, is not simulated directly. However, the slow-down of a particular simulation process due to I/O can be captured through busy-wait cycles.
V. SIMULATIONEXPERIMENTS ONGENERALMODEL
In this section, we present experimental results for the load simulator using various partitioning schemes described in Section III. All experiments were carried out on a high performance computation cluster at the Los Alamos National Laboratory, comprising of 1290 compute nodes, with each node consisting of two 64-bit AMD Opteron2.6Ghz processors and 8GB memory. The compute nodes are connected together by a Voltaire Infiniband high-speed interconnect. For the partitioning experiments described in this section, we limited the cluster size to 64 compute nodes; scaling results on
LOADSIMULATORALGORITHM
1) Each vertexv schedules(nv/N(V))×Levents for itself. Note that sum of all events is L. 2) Upon receiving an event, a nodeu:
a) With probabilityp, sends an event (message) to a neighboring node, or
b) With probability1−p, simulates a computational cycle. Computational cycles are implemented by a simple busy-wait loop; the number of iterations are geometrically distributed with meanC.
Fig. 3. Load Simulator Algorithm
larger cluster sizes for real simulation applications are described in Section VI.
We simulated a 100,000 node network for different spatial distributions – exponential, normal and uniform – with an average connectivity degree of five. For the input parameters (see previous section), we setT = 100,
L= 107
, andC= 108
. We test scenarios with different messaging overheads by varying the value ofpto be one of0.1,0.5, or0.9.
Figure 4 shows the execution time and the number of messages passed in the load simulator under the various partitioning schemes for the different types of networks, when the messaging probability is 0.9. Even in this scenario with the most number of inter process messages, scatter outperforms geographical partitioning (with balanced entities) by almost an order of magnitude, despite the message overhead being twice that of the geographical partitioning schemes.
For subsequent scenarios (Figures 5) when the mes-sage passing probability is decreased to 0.5, scatter has even better relative performance, even though the abso-lute execution time increases because of the increased number of busy-wait cycles (computational load). The results shown here are for the exponential distributed network; similar results were observed in the normal and uniformly distributed networks.
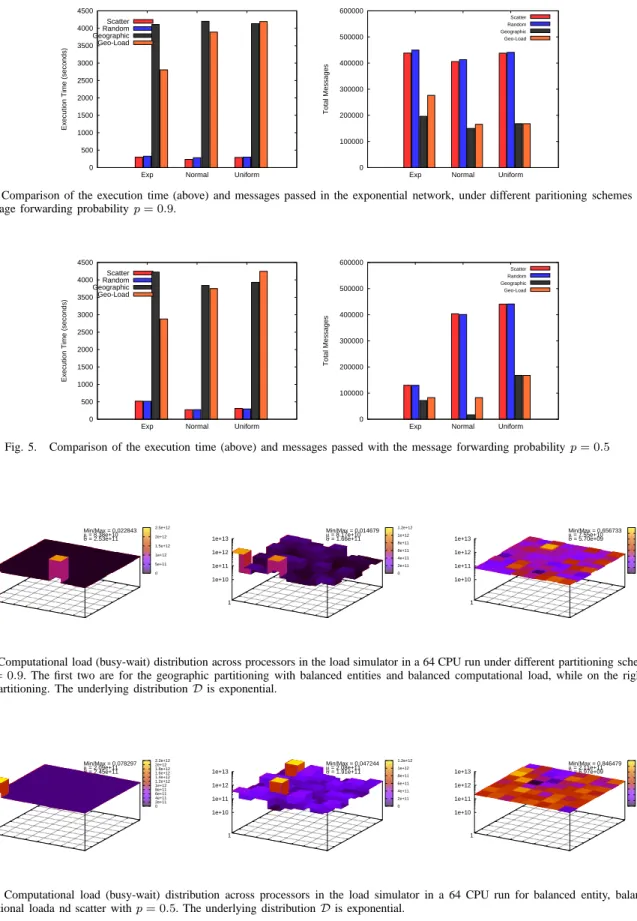
Figures 6 and 7 illustrate the underlying reason for the superior performance of scatter in comparison to the ge-ographical partitioning schemes. Each 3D bar represents the computational load (in terms of busy wait cycles) on one processor in the 64-processor cluster in the exponential network case, forp= 0.9andp= 0.5. Not surprisingly, the worst performing scheme (geographic with balanced entities) is also the most unbalanced (the latter being the cause for the former), while the plots for scatter partitioning are more or less flat, indicating a well balanced load across the cluster. The Min/Max load ratio depicted in these figures is a useful metric for fairness comparison, since the speed of execution in a synchronized simulation is determined by the slowest process; it follows that a low Min/Max ratio will severely
degrade performance, with ideal ratio being1. VI. PERFORMANCE ONREALAPPLICATIONS
In this section, we present results for the different partitioning algorithms for a real application simulator. FastTrans [11], [12] is a scalable, parallel transporta-tion microsimulator for real-world road networks that can simulate and route millions of vehicles signifi-cantly faster than real time. FastTrans combines parallel, discrete-event simulation (using conservative synchro-nization) with a queue-based approach to traffic mod-eling to accelerate road network simulations. Vehicular trips and activities are generated using the detailed and realistic activity modeling capability of the Urban Population Mobility modeling tools that was developed as part of the TRANSIMS [10] project at the Los Alamos National Laboratory. For the results presented in this section, we simulated a portion of the road network in the North East region of the United States, covering most of the urban regions of New York, and parts of New Jersey and Connecticut; the network graphs consists of approximately half million nodes, 1.1 million links and over 25 million vehicular trips. A more detailed description of FastTransis given in [11], [12].
Figure 8 depicts a heat map of the road network in the New York region, with areas in red being the busiest points in the network, and areas in blue being regions with low traffic volume. Spatial clustering of load is a conspicuous feature of the road network, with urban downtowns having much higher activity than other regions; simulated activity decreases significantly as one moves away from the core regions. Further, vehicle trajectories, are by nature, spatially constrained. Thus, the overwhelming majority of messages (which are used to represent vehicles in FastTrans) are exchanged between neighboring network elements. The spatial load clustering and localized messaging nature of FastTrans make this a good candidate to test the effectiveness of scatter partitioning, in comparison to the other schemes. All partitioning experiments described in this section were conducted on a high performance computing cluster
0 500 1000 1500 2000 2500 3000 3500 4000 4500
Exp Normal Uniform
Execution Time (seconds)
Scatter Random Geographic Geo-Load 0 100000 200000 300000 400000 500000 600000
Exp Normal Uniform
Total Messages
Scatter Random Geographic Geo-Load
Fig. 4. Comparison of the execution time (above) and messages passed in the exponential network, under different paritioning schemes with
the message forwarding probabilityp= 0.9.
0 500 1000 1500 2000 2500 3000 3500 4000 4500
Exp Normal Uniform
Execution Time (seconds)
Scatter Random Geographic Geo-Load 0 100000 200000 300000 400000 500000 600000
Exp Normal Uniform
Total Messages
Scatter Random Geographic Geo-Load
Fig. 5. Comparison of the execution time (above) and messages passed with the message forwarding probabilityp= 0.5
Min/Max = 0.022843 µ = 8.38e+10 σ = 2.53e+11 1 1e+10 1e+11 1e+12 1e+13 0 5e+11 1e+12 1.5e+12 2e+12 2.5e+12 Min/Max = 0.014679 µ = 8.17e+10 σ = 1.66e+11 1 1e+10 1e+11 1e+12 1e+13 0 2e+11 4e+11 6e+11 8e+11 1e+12 1.2e+12 Min/Max = 0.656733 µ = 7.55e+10 σ = 5.70e+09 1 1e+10 1e+11 1e+12 1e+13 6e+10 6.5e+10 7e+10 7.5e+10 8e+10 8.5e+10 9e+10 9.5e+10 1e+11
Fig. 6. Computational load (busy-wait) distribution across processors in the load simulator in a 64 CPU run under different partitioning schemes
withp= 0.9. The first two are for the geographic partitioning with balanced entities and balanced computational load, while on the right is
scatter partitioning. The underlying distributionDis exponential.
Min/Max = 0.078297 µ = 2.09e+11 σ = 2.45e+11 1 1e+10 1e+11 1e+12 1e+13 0 2e+11 4e+11 6e+11 8e+11 1e+12 1.2e+12 1.4e+12 1.6e+12 1.8e+12 2e+12 2.2e+12 Min/Max = 0.047244 µ = 2.08e+11 σ = 1.91e+11 1 1e+10 1e+11 1e+12 1e+13 0 2e+11 4e+11 6e+11 8e+11 1e+12 1.2e+12 Min/Max = 0.846479 µ = 2.11e+11 σ = 6.97e+09 1 1e+10 1e+11 1e+12 1e+13 1.9e+11 1.95e+11 2e+11 2.05e+11 2.1e+11 2.15e+11 2.2e+11 2.25e+11 2.3e+11
Fig. 7. Computational load (busy-wait) distribution across processors in the load simulator in a 64 CPU run for balanced entity, balanced
Fig. 8. Figure illustrating distribution of event load in the New York region.
Fig. 9. Figure illustrating assignment
of entities under geographic partitioning scheme with balanced entities. All entities in one colored box are assigned to the same processor.
Fig. 10. A zoomed in figure illustrating as-signment of entities under scatter partition-ing scheme. Nearby entities are assigned different colors (processors)
0 500 1000 1500 2000 512 256 128 64 32
Execution Time (Minutes)
Number of CPUs Scatter Geographic with Balanced Entity Distribution Geographic Geographic with Balanced Routing Load Geographic with Balanced Event Load
Fig. 11. Comparison of execution times of FastTrans (as a function of #CPUs) under different partitioning schemes.
5e+08 1e+09 1.5e+09 2e+09 2.5e+09 3e+09 3.5e+09 512 256 128 64 32
Total Messages Passed
Number of CPUs Scatter Geographic with Balanced Entity Distribution Geographic Geographic with Balanced Routing Load Geographic with Balanced Event Load
Fig. 12. Comparison of the number of
messages passed in FastTrans (as a func-tion of #CPUs) under different partifunc-tioning schemes.
Fig. 13. Comparison of fairness of
com-putation load in FastTrans under different partitioning schemes.
at Los Alamos National Laboratory for different proces-sor configurations, ranging from 32 to 512processors. Figure 11 illustrates the basic performance of the various partitioning schemes in terms of execution speed. Geo-graphic partitioning with balanced entities performs the worst, while scatter partitioning is the fastest, outper-forming geographic partitioning with balanced entities by about an order of magnitude. Interestingly, perfor-mance in terms of message-passing overhead is almost the reverse of execution time – the number of inter-process messages being passed in scatter partitioning is an order of magnitude higher than geographic.
The fairness of load distribution is shown in Fig-ures 14 through 16. These figFig-ures illustrate the com-putational load on each processor in the 256processor set-up, with load being defined as a weighted sum of event and routing load. Each bar represents the load on one CPU over the entire simulation. The best-performing partitioning scheme (scatter) clearly outperforms the other schemes. The fairness of the partitioning schemes, calculated as the ratio of the minimum to maximum
pro-cessor load for a given experiment (with the ideal ratio being 1) is a useful metric, since the speed of execution time in a synchronized simulation is determined by the slowest process. Figure 13 compares this ratio for the various partitioning schemes; note how these correlate with speed of execution.
A. A Note on Dynamic Load Balancing
Achieving an equitable distribution of load across a cluster is a significant challenge as well as a necessity for computationally intensive tasks, especially in high performance clusters where idle processors represent a huge waste of computational power. A partition algo-rithm can exploit knowledge of the problem domain, and assign a priori load profiles to entities in the network, but as we have seen, these do not always translate into a balanced run-time load distribution. Further, complicated network effects and highly dynamic scenarios can result in significant geographical migrations of load. For ex-ample, in the case of a transportation network, the event and routing load profile may differ significantly in a
2e+07 2.2e+07 2.4e+07 2.6e+07 2.8e+07 3e+07 3.2e+07 Min/Max = 0.9985 µ = 2.52e+07 σ = 1.86e+06 0 2e+07 4e+07 6e+07 8e+07 1e+08
Fig. 14. Computational load distribution of
FastTrans in a256CPU run under scatter
partitioning. Each bar represents the load on one CPU. 0 5e+07 1e+08 Min/Max = 0.00026 µ = 2.49e+07 σ = 3.55e+07 0 2e+07 4e+07 6e+07 8e+07 1e+08
Fig. 15. Computational load distribution
in FastTrans in a256CPU run under
geo-graphic partitioning with balanced entities.
0 2e+07 4e+07 6e+07 Min/Max = 0.0995 µ = 2.52e+07 σ = 7.7e+06 0 2e+07 4e+07 6e+07 8e+07 1e+08
Fig. 16. Computational load distribution
in FastTrans in a256CPU run under
geo-graphic partitioning with balanced load.
simulation of a disaster scenario than from the simulation of a normal day. However if the load patterns continue to exhibit spatial clustering (as is often the case), it is fairly intuitive to see that scatter partitioning would continue to achieve a balanced load profile, thus largely obviating the need for dynamic load balancing. Generally, for problem domains that exhibit spatial clustering of load, scatter partitioning is a simple and highly effective approach.
VII. CONCLUSION
In this paper we presented a partitioning technique for achieving balanced computational load in distributed simulations of networks that exhibit spatial load clus-tering. Such domains include transportation networks, epidemiological networks and other networks where geographical proximity constrains interaction between entities, often leading to geographical hotspots. Through simplified models and a real application, we demon-strated the effectiveness of explicit spatial scattering for achieving near optimal load balance, and vastly improved execution times – even at the cost of increased messaging overhead – compared to more traditional topological par-titioning schemes. Directions for future research include validating the effectiveness of scatter partitioning for different types of simulation applications.
REFERENCES
[1] A.B. Al Geist, J. Dongarra, W. Jiang, R. Manchek, and V.
Sun-deram. PVM: Parallel virtual machine: a users’ guide and
tutorial for networked parallel computing. 1994.
[2] A. Boukerche and S.K. Das. Dynamic load balancing strategies for conservative parallel simulations. ACM SIGSIM Simulation
Digest, 27(1):20–28, 1997.
[3] Phyllis E. Crandall and Michael J. Quinn. A partitioning advisory system for networked data-parallel processing. In Concurrency:
Practice and Experience, pages 479–495, 1995.
[4] E. Deelman and B.K. Szymanski. Simulating spatially explicit problems on high performance architectures. JPDC, 62(3):446– 467, 2002.
[5] Ewa Deelman and Boleslaw K. Szymanski. Dynamic load bal-ancing in parallel discrete event simulation for spatially explicit problems. In Workshop on Parallel and Distributed Simulation, pages 46–53, 1998.
[6] Richard M. Fujimoto. Parallel discrete event simulation.
Com-mun. ACM, 33(10):30–53, 1990.
[7] D. Nicol and J. Saltz. An analysis of scatter decomposition. IEEE
Transactions on Computers, 39(11), 1990.
[8] A.N. Pears and N. Thong. A dynamic load balancing architecture for PDES using PVM on clusters. Recent Advances in Parallel
Virtual Machine and Message Passing Interface, pages 166–173,
2001.
[9] PRIME. Parallel Real-time Immersive network Modeling
Envi-ronment. Available at http://prime.mines.edu/.
[10] L Smith, R Beckman, D Anson, K Nagel, and M E Williams.
Transims: Transportation analysis and simulation system. In
Proceedings of the Fifth National Conference on Transportation Planning Methods, Seattle,Washington, 1995.
[11] S. Thulasidasan and S. Eidenbenz. Accelerating traffic
mi-crosimulations: A parallel discrete-event queue-based approach for speed and scale. In Proceedings of the Winter Simulation
Conference, 2009.
[12] S. Thulasidasan, S. Kasiviswanathan, S. Eidenbenz, E. Galli, S. Mniszewski, and P. Romero. Designing systems for large-scale, discrete-event simulations: Experiences with the fasttrans parallel microsimulator. In HiPC, 2009.