Similarities for Cross-Domain Recommendation
Quan Do1, Wei Liu1, and Fang Chen2
1 Advanced Analytics Institute, University of Technology Sydney, Sydney, Australia
{Quan.Do,Wei.Liu}@uts.edu.au,
2
Analytics Research Group, Data61
Commonwealth Scientific and Industrial Research Organisation (CSIRO), Australia [email protected],
Abstract. Recommender System has become one of the most impor-tant techniques for businesses today. Improving its performance requires a thorough understanding of latent similarities among users and items. This issue is addressable given recent abundance of datasets across do-mains. However, the question of how to utilize this cross-domain rich information to improve recommendation performance is still an open problem. In this paper, we propose a cross-domain recommender as the first algorithm utilizing both explicit and implicit similarities between datasets across sources for performance improvement. Validated on real-world datasets, our proposed idea outperforms the current cross-domain recommendation methods by more than 2 times. Yet, the more interesting observation is that both explicit and implicit similarities between datasets help to better suggest unknown information from cross-domain sources. Keywords: Cross-Domain learning; Recommendation System; Matrix Factorization
1
Introduction
Recommender systems have been received increasing attention and popularity from many products and services providers. Two approaches have been widely used for building recommender systems: content based [10] and collaborative filtering (CF) based [7]. A content based approach focuses on users’ profile or items’ information for making prediction whereas a CF method bases on latent similarities among users and items for recommending items for particular users. This paper focuses on improving CF based approaches.
As CF based methods rely on latent similarities among users and items for making recommendation, they require to have sufficient ratings to achieve a reliable result. There are two scenarios that may occur. Firstly, newly estab-lished services may take time to acquire enough ratings. Secondly, even they have enough ratings for making reliable recommendations, how can recommen-dation performance be improved using external data sources? Solving these two problems is our main focus.
X(1) X(2) U(1) U(2) [V(0)|V(1)]T [V(0)|V(2)]T user of domain 1 item item user of domain 2
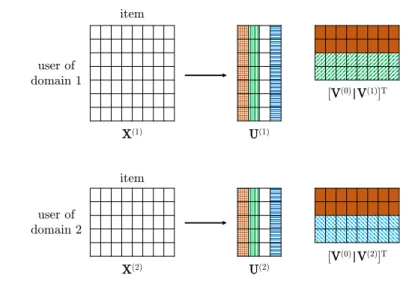
Fig. 1.Our Cross-Domain Recommender model.X(1)matchesX(2)in their item mode.
Our proposed cross-domain factorization decomposesX(1) into U(1), [V(0)|V(1)] and
X(2)intoU(2), [V(0)|V(2)] whereV(0)is a common part in coupled mode of bothX(1)
andX(2)while V(1)andV(2) are domain specific parts. Note that we also propose to utilize the columns of non-coupled U(1) andU(2) such that clusters of similar users (denoted by the same color patterns in their columns) in them are as close as possible.
The above issues are addressable given recent innovations on Internet and social media that have made many datasets publicly available [2, 9, 11, 5]. It is therefore easy to find a correlated dataset from another domain. For example, New South Wales (NSW) state’s crime statistics report can find NSW’s demog-raphy closely related. These correlations across domains possess explicit similar-ities, e.g., NSW crime report and NSW demography contain information of the same local areas, which are conventionally used to coupled analyze them [12, 1]. Nevertheless, datasets across domains also have implicit similarities, for example demography and crime behavior may have similar hidden patterns. Both similar-ities, if utilized properly, can provide rich insights to improve recommendation performance on the above mentioned two scenarios.
Formally, suppose we have rating matricesX(1) andX(2)from two different domains with only a few entries observed. SupposeX(1) andX(2) are explicitly coupled in one dimension, i.e., one mode ofX(1) and one mode ofX(2) are cou-pled. This is a reasonable assumption as many datasets across domains possess this characteristic. For instance,X(1)contains population profiles of a country’s cities and X(2) includes those cities’ crime reports; X(1) and X(2) are coupled in their first mode (city mode). By joint analyzing cross-domainX(1) andX(2), we want to learn ratings from observedX(1) and X(2) to predict their missing entries with high accuracy. In other words, our question is how to utilize the ratings in a domain to help predicting unknowns in another one and vice versa.
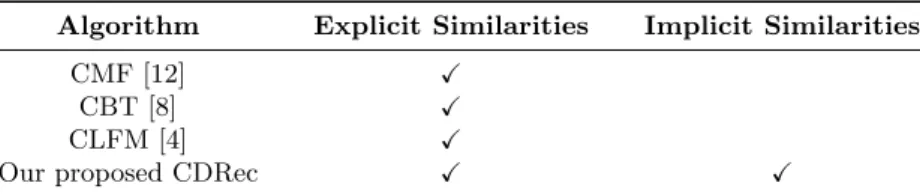
Table 1.Collaborative factors used by different algorithms for cross-domain recom-mendation. Our proposed method is the only one that utilizes both similarities.
Algorithm Explicit Similarities Implicit Similarities
CMF [12] X
CBT [8] X
CLFM [4] X
Our proposed CDRec X X
Existing algorithms were trying to solve the above problem by using ex-plicit similarities to collaborate between datasets. Collective Matrix Factoriza-tion (CMF) [12] and its extensions [1] suggested both datasets would have the same factor in their coupled mode. In this case, the low rank common factor captures the explicit similarities between datasets across domains. Gao et al. [4] and Li et al. [8] assumed cross-domain datasets would share explicit latent rating patterns. The ratings’ similarities were then used to collaborate between them. Nevertheless, just only explicit is not enough to really improve the accuracy.
We propose a Cross-Domain Recommender (CDRec) as the first method that analyzes both explicit and implicit similarities. One of our key hypothesis, extended from CMF where both datasets have the same factor in their cou-pled mode, is that two datasets across domains also possess their own specific patterns. Our idea is to find a way to combine these unique patterns into the common factor. One plausible solution is to allow the coupled factors to have both common and domain-specific parts. Figure 1 illustrates an example of com-monV(0) and uniqueV(1),V(2) in coupled factors.
In addition, our another key hypothesis for implicit similarities, extended from the concept of factorization as a clustering method [3], is that non-coupled factors share common clusters. For example, in Figure 1, even though users in
X(1)andX(2)are different, their behaviors may be grouped by latent similarities. Because of that, we want to align common clusters inU(1)andU(2)to be closer. One reasonable solution is to regularize the centroids of common clusters inU(1) andU(2). This solution matches the fundamental concept of CF in which similar users rate similarly.
In short, our main contributions are:
1)Preserving common and specific parts in the coupled factor (sub-section 4.1): We extend existing common coupled factor by introducing specific parts (e.g., factorVin Figure 1.) These common and specific parts better cap-ture the true explicit characteristics of datasets across domains.
2)Aligning non-coupled factors’ similarities(subsection 4.2): We present a method to utilize implicit similarities. CDRec is the first factorization method utilizing both explicit and implicit similarities for cross domain recommender systems’ performance improvement (Figure 1).
3)Proposing an algorithm that solves optimization problem (subsec-tion 4.3): We optimize the process of utilizing both similarities following Alter-nating Least Squared (ALS) (Algorithm 1). Our empirical results on real-world
datasets suggest our proposed algorithm the best choice for cross-domain rec-ommendation (section 5).
2
Notations
We denote matrices by boldface capitals, e.g.,X;Iis the identity matrix. Bold-face lowercases are for vectors, i.e.,uis a column vector anduTis a row vector. A boldface capital and lowercase with indices in its subscript are used for an entry of a matrix and a vector, respectively. Transpose ofXis denoted byXT.
3
Related work
Joint analyzing cross-domain datasets has attracted huge research effort to ex-tract more meaningful insights. Many methods were proposed for making accu-rate recommendations. Some popular algorithms are being discussed below. Collective Matrix Factorization (CMF) To deal with two datasets coupled in one of their modes, Singh et al. [12] and later Acar et al. [1] assumed two datasets had a common low rank subspace in their coupled dimension. Suppose
X1 andX2 are joint in their first mode, the authors modeled this CMF with a coupled loss function: L =kX1−UVT1k2+kX2−UVT2k2 where common U represents explicit similarities between two datasets.
CodeBook Transer (CBT) Targeting on improving recommendation on one domain by utilizing latent rating patterns from another domain, Li et al. [8] suggested one as a source domain Xsrc and the other one as a target domain
Xtgt. Then theXsrcwas decomposed into tri-factor:Xsrc≈UsrcSsrcVsrcT . Rating patterns (Ssrc) were used as the CodeBook to be transfered fromXsrc to Xtgt. Thus,XtgtbecameXtgt≈UtgtSsrcVtgtT . This explicit knowledge transfered from the source improved the accuracy of recommendation in the target domain. Cluster-Level Latent Factor Model (CLFM) The assumption that two datasets from different domains have the same rating patterns is unrealistic in practice. They may share some common patterns while possess their own characteristics. This motivated Gao et al. [4] to propose CLFM for cross-domain recommendation. In specific, the authors partitioned the rating patterns across domains into common and domain-specific parts:
X1≈U1[S0|S1]VT1 X2≈U2[S0|S2]VT2
whereS0∈RR1∗Cis the common patterns andS1, S2∈RR1∗(R2−C)are domain-specific parts; C is the number of common columns.
This model allows CLFM to learn the only shared latent spaceS0, having two advantages. Firstly, asS0captures the similar rating patterns across domains, it
helps to overcome the sparsity of each datasets. Secondly, domain-specificS1and
S2contain domains’ discriminant characteristics. As a result, diversity of ratings in each domain is still preserved, improving recommendation performance.
4
Our proposed Cross-Domain Recommender (CDRec)
We propose a model that utilizes both explicit and implicit similarities between datasets across domains. Without loss of generality, assume X(1) andX(2) are coupled in their second mode, i.e. X(1) is a rating matrix from I users for J items and X(2) is another rating matrix from K users for the same J items. We follow the CMF model [12] to extract low rank user factors and item ones:X(1)≈U(1)VTandX(2)≈U(2)VT. Nevertheless, we make two key extensions:
4.1 Preserving common and domain-specific parts in V
As X(1) and X(2) come from different domains, it is implausible to suggest them to have the same V. They are highly correlated in a sense that they have something in common, yet also possess their own domain-specific parts. We, therefore, propose to include both common and domain-specific parts inV
factors in the coupled loss function: minL= X(1)−U(1) V(0)|V(1)T 2 + X(2)−U(2) V(0)|V(2)T 2 whereV(0) ∈
RJ∗Cis the common part andV(1),V(2)∈
RJ∗(R−C) are domain-specific parts; C is the number of common columns.
Figure 1 illustrates an example of common V(0) and unique V(1), V(2) in coupled factors. CommonV(0)and domain-specificV(1)andV(2)better capture the characteristics of datasets across domains.
4.2 Utilizing implicit similarities in U(1) and U(2)
Besides explicit similarities in coupled mode as in subsection 4.1, cross-domain datasets also correlate in non-coupled mode. Following the concept of factoriza-tion as a clustering method [3], user groups inX(1)andX(2)are captured inU(1) andU(2). Although users inX(1)and those inX(2)are different, their behaviors or preferences can be grouped together. This idea is the fundamental concept of CF where users rated similarly in observed items will also rate similarly for unobserved items. As a result, we suggest common clusters among columns of
U(1) andU(2)to be closer. One reasonable solution is to regularize the centroids of clusters across U(1) andU(2).
minL= X(1)−U(1) V(0)|V(1)T 2 + X(2)−U(2) V(0)|V(2)T 2 + u(1)c T−u(2)c T 2 where u(1)c T and u(2)c T
denotes row vectors of columns’ centroids in U(1) and
Moreover, we also employ weightedλ-regularization [13] to our model below to prevent overfitting. minL= X(1)−U(1)V(0)|V(1)T 2 + X(2)−U(2)V(0)|V(2)T 2 + u(1)c T −u(2)c T 2 +λθ (1)
whereθ is the L2 regularization term such that
θ=kU(1)k2+kU(2)k2+kV(0)k2+kV(1)k2+kV(2)k2
4.3 Optimization
Even though (1) is a non-convex function with respect to all parameters, it is convex with respect to any of them when the others are fixed. Thus, we apply Alternating Least Square (ALS) algorithm [6] to alternately optimize the function with respect to one factor while fixing the others as in Algorithm 1. Moreover, to achieve efficiency, we perform our model optimization on each row ofUandVfactors instead of full matrix computation. So we can rewrite (1) as
minL= I,J X i,j X(1)i,j −u(1)i T " v(0)j v(1)j # 2 + K,J X k,j X(2)k,j −u(2)k T " v(0)j v(2)j # 2 +u(1)c T −u(2)c T 2 +λθ (2) Solving U(1) and U(2) Letv(01)j = " v(0)j v(1)j # andv(02)j = " v(0)j v(2)j # , then (2) becomes L= I,J X i,j X(1)i,j −u(1)i Tv(01)j 2 + K,J X k,j X(2)k,j−u(2)k Tv(02)j 2 +u(1)c −u(2)c 2 +λθ
Optimalu(1)i Tcan be achieved by setting the derivative ofLwith respect to
u(1)i Tto zero. δL δu(1)i T =−2 J X j X(1)i,j −u(1)i Tv(01)j v(01)j T+ 2λu(1)i T+ 2 u(1)i T−bT =−2x(1)i,∗TV(01)+ 2u(1)i TV(01)TV(01)+ 2λu(1)i T+ 2u(1)i T−2bT where bT = u(1) c T +u(2)c T
−u(1)i T and x(1)i,∗T is a row vector of all observed
Let δL
δu(1)i T = 0, we can achieve the update rule for u
(1) i T : u(1)i T= V(01)TV(01)+ (λ+ 1)I −1 x(1)i,∗ T V(01)+bT (3)
Similarly, optimalu(2)k T can be derived by:
u(2)k T= V(02)TV(02)+ (λ+ 1)I −1 x(2)k,∗TV(02)+bT (4) where bT = u(1)c T +u(2)c T
−u(2)k T and x(2)k,∗T is a row vector of all observed
x(2)k,j, ∀j∈J.Iis the identity matrix.
Solving common V(0) Let u(1)i T = u(10)i |u(11)i T and u(2)k T = u(20)k |u(22)k T where u(10)i T, u(20)k T ∈ R1∗Candu(11)i T,u(22)k T∈R1∗R−C, then (1) can be rewritten as:
L= I,J X i,j Xi,j(1)−u(10)i Tvj(0)−u(11)i Tv(1)j 2 + K,J X k,j X(2)k,j −u(02)k Tv(0)j −u(22)k Tv(2)j 2 +u(1)c −u(2)c 2 +λθ
Analogy to solvingU(1) and U(2), optimal v(0)
j can be achieved by setting the derivative ofL with respect tovj(0) to zero.
δL δv(0)j =−2 I X i Y(1)i,j −u(10)i Tvj(0) u(10)i −2 K X k Y(2)k,j −u(20)k Tvj(0) u(20)k + 2λv(0)j =−2U(1)Ty(1)∗,j + 2U (1)T U(1)v(0)j −2U (2)T y(2)∗,j + 2U (2)T U(2)v(0)j + 2λv (0) j
The update rule forvj(0) can be derived as:
v(0)j = U(1)TU(1)+U(2)TU(2)+λI −1 U(1)Ty(1)∗,j +U (2)T y(2)∗,j (5)
Solving domain-specific V(1) and V(2)
δL δv(0)j =−2U (1)T y(1)∗,j + 2U (1)T U(1)v(1)j + 2λv(1)j = 0
Then the update rule forv(1)j can be derived as:
v(1)j =
U(1)TU(1)+λI
−1
U(1)Ty(1)∗,j (6) In a similar way, the update rule forvj(2) can be achieved by:
v(2)j =
U(2)TU(2)+λI
−1
Algorithm 1: CDRec Input : X(1),X(2),E
Output: U(1),V(0),V(1),U(2),V(2) 1 Randomly initialize all factors 2 InitializeLby a small number 3 repeat
4 PreL=L
5 SolveU(1)while fixing all other factor by minimizing (3) 6 SolveU(2)while fixing all other factor by minimizing (4)
7 Solve commonV(0) while fixing all other factor by minimizing (5) 8 Solve domain-specificV(1) while fixing all other factor by minimizing (6) 9 Solve domain-specificV(2) while fixing all other factor by minimizing (7)
10 ComputeLfollowing (1) 11 until(PrePreL−LL <E)
5
Performance Evaluation
To evaluate our proposed idea, we compare CDRec3with existing algorithms on how well they utilize observed ratings to recommend unknown information. This section summaries our experiments’ settings and their results.
5.1 Data for the experiments
Two publicly available datasets: census data from Australian Bureau of Statistics (ABS) on different states4and crime statistics from Bureau of Crime Statistics and Research (BOCSAR)5are used for our evaluation. Table 2 summarizes these datasets’ distribution.
Australian Bureau of Statistics (ABS) publishes a comprehensive data about people and families for all Australia geographic areas. This ABS dataset has population and family profile within 154 New South Wales (NSW) state’ areas, so-called “local government areas” (LGA), and within 81 Victoria (VIC) state’ LGAs. We form these into a matrixX(1)of (LGA, population and family profile) of 154 by 7889 for NSW and a matrixX(2)of 81 by 7889 for VIC. We randomly select 10% of the data in our experiment and use about its 80% for training and 20% for testing.
BOCSAR’s crime data reports criminal incidents. There are 62 specific of-fences within 154 LGAs of New South Wales. The counting unit is the rate of criminal incidents per 100 population. We randomly select 10% of the data and
3 CDRec’s source code is available athttps://github.com/quanie/CDRec 4
ABS:http://www.abs.gov.au/websitedbs/censushome.nsf/home/datapacks
5 BOCSAR: http://www.bocsar.nsw.gov.au/Pages/bocsar_crime_stats/bocsar_
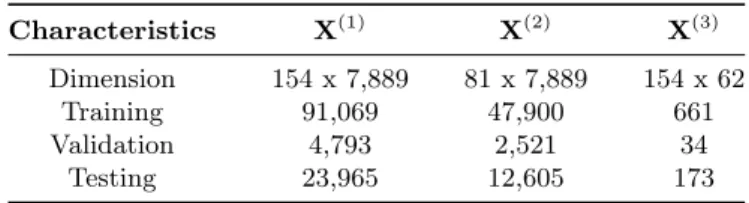
Table 2.Dimension and number of known entries for training, validation and testing of census data on New South Wales (NSW)(X(1)) and Victoria (VIC) (X(2)) states as well as crime data of NSW (X(3)).
Characteristics X(1) X(2) X(3)
Dimension 154 x 7,889 81 x 7,889 154 x 62
Training 91,069 47,900 661
Validation 4,793 2,521 34
Testing 23,965 12,605 173
include them in a matrixX(3)of (LGA, offences) of 154 by 62. Among this 10%, we use 80% for training and the rest for testing.
5.2 Baselines and metric for evaluation
We compare our proposed CDRec with existing cross-domain factorization algo-rithms: CMF [12], CBT [8] and CLFM [4] that leverage explicit similarities. Our goal is to assess how well these algorithms suggest unknown information based on the observed cross-domain ratings. For this purpose, we compare them with a popular Root Mean Squared Error (RMSE) metric.
5.3 Experimental setting
Two scenarios are thoroughly tested with the following settings:
Case #1. States’ demographic similarities in latent sense can help to collaboratively suggest unknown information in these states
We useX(1) andX(2) which are from different LGAs in NSW and VIC states. Nevertheless, their demography may share some common characteristics. We would like to assess how well both explicit similarities in demography dimension and implicit ones in LGA dimension can help to collaboratively suggest unknown information in both NSW and VIC.
Case #2. LGAs’ demographic similarities in latent sense can help to collaboratively suggest unknown crime information
In this case, we cross factorize NSW’s demographyX(1)matrix and NSW’s crime
X(3) matrix. Both X(1) andX(3) explicitly have the same LGAs. Nevertheless, their hidden similarities in demography and crime rate can also help to improve recommendation performance. We want to assess how these explicit as well as implicit similarities can help to collaboratively suggest unknown crime rate.
Other than that, all algorithms stop when changes are less than 10−5which indicates convergence. In all algorithms, rank of the decomposition is set from 5 to 19. Each algorithm was run 5 times and we report their results’ mean and standard deviation in the next subsection.
Table 3. Tested RMSE on ABS NSW and ABS VIC data with different algorithms. Best results for each rank are in bold.
Dataset Rank CMF CBT CLFM CDRec
ABS NSW 5 0.0226±0.0026 0.0839±0.0002 0.0838±0.0002 0.0132±0.0002 7 0.0222±0.0009 0.0836±0.0004 0.0842±0.0006 0.0131±0.0003 9 0.0241±0.0011 0.0841±0.0002 0.0848±0.0009 0.0143±0.0004 11 0.0265±0.0026 0.0846±0.0007 0.0841±0.0007 0.0143±0.0003 13 0.0237±0.0024 0.0851±0.0002 0.0850±0.0005 0.0151±0.0004 15 0.0229±0.0029 0.0853±0.0005 0.0847±0.0005 0.0150±0.0000 ABS VIC 5 0.0364±0.0031 0.0844±0.0003 0.0845±0.0004 0.0266±0.0030 7 0.0428±0.0020 0.0845±0.0004 0.0849±0.0004 0.0239±0.0025 9 0.0476±0.0040 0.0852±0.0003 0.0848±0.0003 0.0221±0.0019 11 0.0501±0.0029 0.0858±0.0005 0.0851±0.0007 0.0242±0.0015 13 0.0489±0.0032 0.0860±0.0003 0.0852±0.0003 0.0227±0.0015 15 0.0514±0.0041 0.0862±0.0002 0.0854±0.0006 0.0215±0.0005 5.4 Empirical results
Table 3 shows RMSE performance of all models on ABS data for New South Wales and Victoria states. Both CBT and CLFM that assume two states’ demog-raphy similarities in latent sense clearly perform the worst. The results demon-strate that explicit similarities in latent sense does not help both CBT and CLFM to improve performance. CMF applies another approach to take advan-tages of explicit correlations between NSW state’s population and family profile and those of VIC state. As a result, CMF’s assumption on the same population and family profile factor between NSW and VIC helps improve CMF’s perfor-mance over CBT’s and CLFM’s almost 4 times in NSW data and 2 times in VIC data. Nevertheless, the prediction accuracy can be improved even more as illustrated with our proposed idea of explicit and implicit similarities discov-ery. Utilizing them help our proposed CDRec to achieve about 2 times higher accuracy compared with CMF.
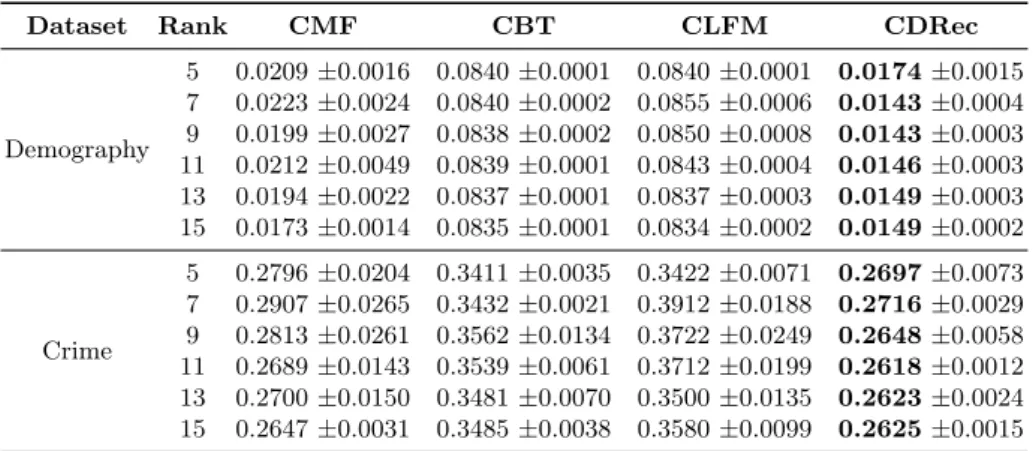
The advantages of both explicit and implicit similarities are further con-firmed in Table 4. In this case, they are applied to other cross domains: ABS NSW demography and NSW Crime. These datasets have explicit similarities in their LGA latent factors. At the same time, implicit similarities in demography profile and crime behaviors are also utilized to collaborate between datasets. Our proposed CDRec leveraging both of the similarities outperforms existing algorithms by achieving the lowest RMSEs.
We also show how CDRec works with different number of common column C parameter in Figure 2 and 3. When there is no explicit similarities (C=0), the accuracy of VIC (Figure 2b) produced by our proposed method is almost the same as CMF’s performance whereas that of Crime (Figure 3a) is much worse than CMF’s one. Nevertheless, as C is larger, both explicit and implicit similar-ities help to further improve recommendation performance of them. Specifically, CDRec achieves the best result with C=6 in Figure 2b and C=9 in Figure 3a.
Table 4.Tested RMSE on ABS NSW demography and BOCSAR NSW crime data with different algorithms. Best results for each rank are in bold.
Dataset Rank CMF CBT CLFM CDRec
Demography 5 0.0209±0.0016 0.0840±0.0001 0.0840±0.0001 0.0174±0.0015 7 0.0223±0.0024 0.0840±0.0002 0.0855±0.0006 0.0143±0.0004 9 0.0199±0.0027 0.0838±0.0002 0.0850±0.0008 0.0143±0.0003 11 0.0212±0.0049 0.0839±0.0001 0.0843±0.0004 0.0146±0.0003 13 0.0194±0.0022 0.0837±0.0001 0.0837±0.0003 0.0149±0.0003 15 0.0173±0.0014 0.0835±0.0001 0.0834±0.0002 0.0149±0.0002 Crime 5 0.2796±0.0204 0.3411±0.0035 0.3422±0.0071 0.2697±0.0073 7 0.2907±0.0265 0.3432±0.0021 0.3912±0.0188 0.2716±0.0029 9 0.2813±0.0261 0.3562±0.0134 0.3722±0.0249 0.2648±0.0058 11 0.2689±0.0143 0.3539±0.0061 0.3712±0.0199 0.2618±0.0012 13 0.2700±0.0150 0.3481±0.0070 0.3500±0.0135 0.2623±0.0024 15 0.2647±0.0031 0.3485±0.0038 0.3580±0.0099 0.2625±0.0015
Moreover, it is interesting to observe in both figures that RMSE of NSW demog-raphy reduces a bit to significantly improve that of VIC and NSW crime. This confirms both explicit and implicit similarities between cross-domain datasets can be collaborative used to improve both of their recommendation performance.
(a) (b)
Fig. 2. Tested RMSEs under different number of common column C in CDRec. a) Results on ABS NSW dataset; b) Results on ABS VIC dataset.
6
Conclusion
We have discovered both explicit and implicit similarities between datasets across domains. In this paper we propose a method to preserving common and specific parts in coupled factor as well as aligning non-coupled factors’ similarities. More-over, an algorithm that solves the optimization problem of this method is also introduced. The advantages of our ideas, validated with real-world datasets, sug-gest combining both explicit and implicit similarities is the best way to improve cross-domain recommendation.
(a) (b)
Fig. 3.Tested RMSEs under different C in CDRec. a) Results on ABS NSW demog-raphy; b) Results on BOCSAR NSW Crime. At C=9, RMSE of NSW demography reduces a little to further improve the accuracy of predicting crime information.
References
[1] Acar, E., Kolda, T.G., Dunlavy, D.M.: All-at-once optimization for coupled matrix and tensor factorizations. arXiv preprint arXiv:1105.3422 (2011)
[2] Chen, W., Hsu, W., Lee, M.L.: Making recommendations from multiple domains. In: Proceedings of the 19th ACM SIGKDD International Conference on Knowl-edge Discovery and Data Mining (KDD) (2013)
[3] Ding, C., Li, T., Peng, W., Park, H.: Orthogonal nonnegative matrix tri-factorizations for clustering. In: Proceedings of the 12th ACM SIGKDD Inter-national Conference on Knowledge Discovery and Data Mining (KDD) (2006) [4] Gao, S., Luo, H., Chen, D., Li, S., Gallinari, P., Guo, J.: Cross-domain
recommen-dation via cluster-level latent factor model. In: Machine Learning and Knowledge Discovery in Databases: European Conference, (ECML PKDD) (2013)
[5] Jiang, M., Cui, P., Chen, X., Wang, F., Zhu, W., Yang, S.: Social recommendation with cross-domain transferable knowledge. IEEE TKDE (2015)
[6] Kolda, T.G., Bader, B.W.: Tensor decompositions and applications. SIAM Review (2009)
[7] Koren, Y., Bell, R.: Advances in collaborative filtering. In: Recommender Systems Handbook (2011)
[8] Li, B., Yang, Q., Xue, X.: Can movies and books collaborate?: Cross-domain col-laborative filtering for sparsity reduction. In: Proceedings of the 21st International Jont Conference on Artifical Intelligence (IJCAI) (2009)
[9] Li, C.Y., Lin, S.D.: Matching users and items across domains to improve the recommendation quality. In: Proceedings of the 20th ACM SIGKDD International Conference on Knowledge Discovery and Data Mining (KDD) (2014)
[10] Lops, P., de Gemmis, M., Semeraro, G.: Content-based recommender systems: State of the art and trends. In: Recommender Systems Handbook (2011) [11] Pan, W., Xiang, E., Liu, N., Yang, Q.: Transfer learning in collaborative filtering
for sparsity reduction. In: AAAI Conference on Artificial Intelligence (2010) [12] Singh, A.P., Gordon, G.J.: Relational learning via collective matrix factorization.
In: ACM SIGKDD International Conference on Knowledge Discovery and Data Mining (KDD) (2008)
[13] Zhou, Y., Wilkinson, D., Schreiber, R., Pan, R.: Large-scale parallel collaborative filtering for the netflix prize. In: Proceedings of the 4th International Conference on Algorithmic Aspects in Information and Management (AAIM) (2008)