Enhanced Multiclass SVM with Thresholding Fusion
for Speech-based Emotion Classification
Na Yanga,∗, Jianbo Yuana, Yun Zhoua, Ilker Demirkolb, Zhiyao Duana, Wendi Heinzelmana, Melissa Sturge-Applec
aDepartment of Electrical and Computer Engineering, University of Rochester. Rochester,
NY, 14627, USA
bDepartment of Telematics Engineering, Universitat Polit`ecnica de Catalunya and with
i2Cat Foundation. C/ Jordi Girona 1-3, Barcelona, 08034, Spain
cDepartment of Clinical and Social Sciences in Psychology, University of Rochester.
Rochester, NY, 14627, USA
∗Corresponding author
Email addresses: [email protected](Na Yang),[email protected](Jianbo Yuan),[email protected](Yun Zhou),[email protected](Ilker Demirkol),[email protected](Zhiyao Duan),[email protected] (Wendi Heinzelman),[email protected](Melissa Sturge-Apple)
Abstract
As an essential approach to understanding human interactions, emotion classi-fication is a vital component of behavioral studies as well as being important in the design of context-aware systems. Recent studies have shown that speech contains rich information about emotion, and numerous speech-based emotion classification methods have been proposed. However, the classification perfor-mance is still short of what is desired for the algorithms to be used in real systems. We present an emotion classification system using several one-against-all support vector machines with a thresholding fusion mechanism to combine the individual outputs, which provides the functionality to effectively increase the emotion classification accuracy at the expense of rejecting some samples as unclassified. Results show that the proposed system outperforms three state-of-the-art methods and that the thresholding fusion mechanism can effectively improve the emotion classification, which is important for applications that require very high accuracy but do not require that all samples be classified. We evaluate the system performance for several challenging scenarios includ-ing speaker-independent tests, tests on noisy speech signals, and tests usinclud-ing non-professional acted recordings, in order to demonstrate the performance of the system and the effectiveness of the thresholding fusion mechanism in real scenarios.
Keywords: Emotion classification; support vector machine; thresholding fusion; noisy speech
1. Introduction
Emotions are a primary form of communication in humans and carry the potential to convey a wealth of information Scherer (2005). In particular, hu-man speech contains rich information for effectively conveying emotions and communicating wants, needs, and desires. The richness of human speech for understanding emotions within human interactions has motivated researchers to explore the area of emotion classification based on speech Black et al. (2013). Existing methodologies for assessing behavioral data for emotions are based largely upon using trained observational coders who manually decode different parameters in the speech signal according to some prescribed criteria Kerig and Baucom (2004). This is very time intensive and requires hours of training as well as meth-ods to ensure that coders are accurate and consistent with one another Bakeman (1997). Furthermore, such procedures are costly from a time and financial stand-point and have the potential to be subjective and error-prone. While prosodic features are easy to capture, and thus have been widely used in automatic emotion classification, mining useful emotion information solely from prosodic features is still a challenging task, and the classification accuracy is still not adequate Bitouk et al. (2010)Rachuri et al. (2010).
Therefore, improved emotion classification methods are needed, and a thor-ough analysis of the emotion classification accuracy under real scenarios is nec-essary, such as where modalities are captured in noisy environments. Speech has been used in conjunction with other modalities such as text Lee and Lee (2007)Bellegarda (2013)Goyal et al. (2010), body gestures, and facial expres-sions to build multi-modal models for emotion classification ¨Ozkul et al. (2012)Wu et al. (2013)Huisman et al. (2013), but in this paper we focus on emotion classification based solely on vocal features.
There are a variety of applications that use speech-based emotion classifica-tion. Ticket reservation systems employ emotion detection to recognize annoyed or frustrated customers and respond accordingly Ang et al. (2002). Call centers employ emotion classification to prioritize impatient customers Gupta and Rajput
(2007)Lee and Narayanan (2005). Warning systems have been developed to de-tect aggressive driving Al Machot et al. (2011) or to keep the driver alert Schuller et al. (2004). In the healthcare field, emotion classification is used by clinicians for assessment or treatment of patients with psychological disorders or conditions that create emotional difficulties, such as autism or depression Tacconi et al. (2008)Cowie et al. (2000). Speech-based emotion sensing technologies have been
implemented on mobile devices, such as smartphones, for behavioral studies Rachuri et al. (2010)Chang et al. (2011) or patient monitoring Yang et al. (2013). Emotion
attribute can also be used for speaker recognition Bao et al. (2007) or emo-tional speech synthesis Qin et al. (2006)Barra-Chicote et al. (2010)Steidl et al. (2012)Kawanami et al. (2003).
The emotion classification system used in this paper extracts the speech sig-nal’s fundamental frequency, energy and other speech features, and the widely employed Support Vector Machine (SVM) learner is used for One-Against-All (OAA) classification for each emotion. To improve the classification perfor-mance, we use the thresholding fusion mechanism proposed in Vapnik (1998), which fuses confidence scores from multiple OAA classifiers by comparing the highest confidence score with a pre-set threshold to determine whether to classify the sample or reject it. The goal in utilizing a thresholding fusion mechanism is to increase the accuracy of the classification system at the expense of unclassi-fied samples. In many of the applications for speech-based emotion classification described above, the cost of a mis-classification is high, and hence it is better to achieve high classification accuracy for those samples (e.g., 3 second segments of the speech) that are classified rather than trying to classify all samples.
Initial results using this system were presented in our previous work Yang et al. (2012), which, however, we subsequently found contained erroneous results due to an issue with the voice feature data that was used in the classification. In this work, we have corrected the problem and also changed the SVM kernel func-tion to be Radial Basis Funcfunc-tion (RBF), instead of the hybrid kernel proposed in Yang et al. (2012). We added Mel-Frequency Cepstral Coefficients (MFCCs) and speaking rate to the speech feature set. Additionally, feature selection and
over-sampled methods were used to further improve the classification perfor-mance. More thorough evaluations and discussions are presented in this work as well.
Our method achieves a decision-level correct classification rate of 80% for six emotions using the LDC dataset Liberman et al. (2002) spoken by actors and actresses, and 45% on a noisy dataset spoken by ordinary speakers using the UGA dataset Bri (2016). Our system outperforms a state-of-the-art method proposed in Rachuri et al. (2010), which achieves a decision-level correct classi-fication rate of 71% for classifying five emotions based on the same LDC dataset. Our system allows defining a confidence threshold level to improve the perfor-mance at the expense of rejecting more samples as unclassified. As an example, the decision-level correct classification rate can be increased to 93% and 56% when half of the samples are rejected as unclassified for the aforementioned LDC dataset and UGA dataset, respectively. This can be contrasted with results from a human user study presented in Eskimez et al. (2016), in which naive coders on Amazon Mechanical Turk were asked to classify the emotions in the LDC dataset. Results from this test show that naive human coders cannot improve their classification accuracy by rejecting samples where they are not confident in their decision. Hence, this proposed system can potentially replace humans in classifying emotions in scenarios where humans cannot be easily trained. The MATLAB code for our emotion classification system is available on the Univer-sity of Rochester Wireless Communications and Networking Group’s website Bri (2016).
The contributions of this work are:
• We build upon our preliminary work Yang et al. (2012) to construct a complete and effective speech-based emotion classification system, by em-ploying more features (e.g., MFCC and speaking rate) and adding three performance enhancement strategies (i.e., speaker normalization, train-ing ustrain-ing over-sampled datasets, and feature selection). We also conduct a thorough comparison with state-of-the-art methods and a systematic
analysis of system components in different scenarios (e.g., general tests and gender dependent tests).
• We employ the thresholding fusion mechanism proposed in Vapnik (1998) to further improve the emotion classification accuracy at the expense of rejecting some speech samples. We illustrate that this strategy will be beneficial in many practical situations.
• We investigate the emotion classification performance for real scenarios including speaker-independent tests, tests on noisy speech signals, and tests using a dataset with non-professional acted emotions.
The rest of the paper is organized as follows. Section 2 provides a brief survey of two components of a speech-based emotion classification system, i.e., speech features and classifiers. Section 3 describes our proposed emotion classifi-cation system, including the thresholding fusion method and three performance enhancement strategies. Section 4 explains the speech datasets and evaluation metrics used in this work. Extensive experimental results of the system using different databases and different scenarios are presented in Section 5. Finally, Section 6 concludes the paper.
2. Related work
A speech-based multiclass classification system consists of two components: a set of speech features to extract from the speech signals of the dataset and a classifier to classify the speech signals based on their extracted features. There-fore, we survey existing emotion classification techniques according to these two aspects.
2.1. Speech features
An important issue in the design of a speech-based emotion classification system is the extraction of suitable features that efficiently characterize different emotions and perform consistently, regardless of the speaker.
For speech analysis applications, such as emotion classification, speech recog-nition, and speaker recogrecog-nition, a number of speech features have been com-monly used. In the time domain, popular prosodic features are energy, speaking rate, duration, and zero crossing rate. In the frequency domain, spectral fea-tures represent vocal cord and vocal tract system characteristics. For example, the authors of Goudbeek et al. (2009) found that emotions with high arousal, such as anger and happiness, result in higher mean values of the first formant frequency in all vowels, whereas emotions with positive valence, such as happi-ness and pride, result in higher mean values for the second formant frequency. Some spectral features, such as Mel-Frequency Cepstral Coefficients (MFCCs) and Perceptual Linear Predictive (PLP) coefficients, are derived on the concept of logarithmically spaced filter banks matched to the human auditory system. Additionally, it is stated in O.W. et al. (2003) that fundamental frequency (F0)
and energy are closely related to emotion classification. Some other commonly used spectral features include energy slope, and Log Frequency Power Coeffi-cients (LFPC). The difference, delta, and acceleration values of these features are also used to capture the temporal dynamics of the speech signals.
For speech-based emotion classification studies in particular, different sets of features are used. The work proposed in Rachuri et al. (2010) uses Percep-tual Linear Predicative (PLP) coefficients as speech features. Speech features F0, intensity, first formant frequency, voice quality measures, and MFCCs are
used in Bitouk et al. (2010). A new speech feature called weighted frequency is proposed in Sethu et al. (2008), which is representative of the spectral region containing the most energy. Besides weighted frequency, the speech features used in Sethu et al. (2008) include zero crossing rate, F0, and energy.
Long-term spectro-temporal features are used for emotion classification in Wu et al. (2009). Some psychology and behavior studies also adopt speech features such as F0, energy, and speaking rate B¨anziger et al. (2014)Sauter et al. (2010)Scherer
2.2. Emotion classifiers
For multiclass emotion classification systems, commonly used generative classifiers include Naive Bayes and Gaussian Mixture Models (GMM) Rachuri et al. (2010)Sethu et al. (2008)Yun and Yoo (2012), for which the feature distribu-tions for each emotional state are modeled. An extended version of GMM for emotion classification was proposed by H. Tang et al. Tang et al. (2009) by introducing a boosting algorithm for a reliable and accurate estimation of the class-conditional GMM. Commonly used discriminative classifiers, which do not employ any probability density modeling, include Support Vector Machines (SVM) Bitouk et al. (2010)Ling et al. (2010)Zhang et al. (2013)Xia and Liu (2012), k-Nearest Neighbors (kNNs), Multi-layer Perceptron (MLP), and decision tree. Sequential classifiers, such as Hidden Markov Model (HMM) based classifiers, have been used as well due to the advantage of reflecting the temporal dynam-ics of the speech features by using the state transition probability Schuller et al. (2003).
3. Emotion classification system
In this section, we present our multiclass SVM system for speech-based emo-tion classificaemo-tion. In order to improve the classificaemo-tion performance, we use three enhancement strategies: speaker normalization, feature selection, and us-ing over-sampled datasets for OAA SVM trainus-ing. The effectiveness of usus-ing these strategies is investigated in Section 5.2. A thresholding fusion mecha-nism is also used, which provides the functionality to effectively increase the classification accuracy at the expense of rejecting some samples as unclassified.
3.1. Speech features
We divide each speech utterance into 60 ms segments with 10 ms time shifts, and only extract speech features for the voiced segments. The following de-scribes what features are used and how they are extracted:
• Fundamental frequency (F0): we use the noise-resilient BaNa F0
de-tection algorithm Ba et al. (2014) to extract theF0 values.
• Energy: we calculate the energy for each segment by taking the summa-tion of all the squared values of the samples’ amplitudes.
• Difference of F0 and difference of energy: the difference of F0 or
energy values between two neighboring segments. More fluctuations may indicate active emotions, such as happiness or anger.
• Frequency and bandwidth for the first four formants: we use the linear predictive coding method for formant calculation.
• Mel-frequency Cepstral Coefficients (MFCCs): we use the
VOICE-BOX toolkit voi to find the 12 MFCCs for each speech frame.
• Speaking rate: measured in the number of syllables per second. We use the method described in de Jong and Wempe (2007).
Since speaking rate is measured on each speech utterance, and the other features are measured on each 60-ms frame, we calculate five statistics: the mean, maximum, minimum, range, and standard deviation for each feature vector except speaking rate, resulting in 24×5 + 1 = 121 attributes that are sent to the classifier.
3.2. Speaker normalization
The characteristics of speech features differ from person to person, which increases the difficulties of speech-based emotion classification and speech recog-nition related research. For example, speaking with a higher tone, i.e., a higher F0, is often a sign of active emotions, such as happy or anger. However, some
speakers’ averageF0is higher than others’.
As we intend to analyze emotion independent of the speaker, speaker nor-malization is used as an enhancement strategy to reduce inter-speaker variability and increase the classification accuracy Schuller et al. (2007). Speaker normal-ization aims to narrow the difference in speech features between speakers, and
only retain the differences between emotion categories. Speaker normalization was first introduced by L. Lee and R. Rose Lee and Rose (1996) for frequency warping procedures. Later on, speaker normalization showed its benefits in the areas of both automatic speech recognition Shrawankar and Thakare (2013) and speech-based emotion classification Vlasenko et al. (2007).
The z-score normalization method Farr´us et al. (2007) has been widely used to eliminate the difference between speakers. We calculate the mean and stan-dard deviation of a specific feature across all frames of the utterances across all the emotions for each speaker individually. Then, each feature value is z-score normalized using the mean and standard deviation.
3.3. Feature selection using mutual information
Feature selection techniques have been used in emotion classification prob-lems to reduce irrelevant or highly correlated features Rong et al. (2009)Shafran (2005)Lee et al. (2002). Mutual information, as one of the techniques which is calculated between each feature and the class label, has been widely used since mutual information measures arbitrary dependencies between random variables, which makes it suitable for assessing the “information content” of features in complex classification tasks Roberto (1994). Therefore, mutual information is used on the speaker-normalized feature values to select the the most relevant features as well as to prevent the learner from overfitting. The MATLAB im-plementation of mutual information that we use here is from mut (2007).
3.4. OAA SVM multiclass emotion classification
We choose SVM as our classifier. Compared to generative models such as GMM, SVM has been shown to have better discrimination power Ling et al. (2010). Compared to other discriminative models such as linear regression, SVM can use kernel functions to deal with linearly inseparable data Hsu et al. (2003).
Two approaches are commonly used to construct a multi-class SVM classifier by combining results from a number of ordinary binary SVMs: One Against All
(OAA), which constructs one SVM per class to distinguish it from all the other classes, and One Against One (OAO), which constructs one SVM to distinguish each pair of classes. In this study, we choose the OAA approach for the sake of a better classification accuracy. There are two main approaches to combine these binary decisions from multiple OAA classification models, i.e., anding binary decisions Vapnik (1995), or choosing the class with the largest confidence value Vapnik (1998). We use the latter approach in this work to make sure that only one emotion is classified.
We use the default C parameter of the box constraint for the soft margin in the SVM. The Radial Basis Function (RBF) kernel is used, and the scaling factorσin the RBF kernel is optimized to be 5. Sequential minimal optimization (SMO) Platt (1999) is used for a faster training of SVM.
3.5. Over-sampled training set
Another performance enhancement strategy employed in our emotion clas-sification system is to use over-sampled datasets for OAA classifier training using the SMOTE method Chawla et al. (2002). For multiclass classification problems, there are three approaches to train each individual OAA SVM clas-sifier, i.e., using the raw uneven datasets, over-sampling the minority class, and under-sampling the majority class.
Take the ‘happy or not’ OAA classifier as an example. To train the classi-fier using the raw uneven dataset, all samples with happiness emotion are used as positive samples, and all samples from the other five emotions are used as negative samples. Studies show that the OAA class-boundary learned by imbal-anced datasets can be severely skewed towards the positive class. As a result, the false-negative rate can be excessively high Wu and Chang (2003).
To train the classifier using an over-sampled dataset using SMOTE Chawla et al. (2002),m−1 synthetic samples are generated around each minority class train-ing sample in the feature space, wheremdenotes the number of emotion classes. Since for the LDC dataset Liberman et al. (2002) we use in this paper, the num-bers of samples for different emotion classes are approximately the same, the
numbers of samples of the majority class and the minority class are approxi-mately the same after over-sampling, resulting in a balanced training set for the OAA SVM classifier.
To train the classifier using an under-sampled dataset, all samples with hap-piness emotion are used as positive samples, and the same number of randomly selected samples from the other five emotions are used as negative samples.
3.6. Thresholding fusion mechanism
We extend our emotion classification system by adding a thresholding fusion mechanism module Vapnik (1998). When the module is off, we always classify a sample to the class with the highest confidence value, as described in Section 3.4. When the module is on, however, we output the class label only when the highest confidence exceeds a certain threshold; otherwise, we reject classifying this sample.
This thresholding fusion mechanism essentially avoids classifying difficult samples in order to achieve high accuracy in the samples that are classified. This will make the system more robust in practice. As the system classifies emotion at the utterance level, oftentimes it is better to classify fewer utterances with a higher accuracy than classifying all utterances with many classification errors. Take the aggressive driver detection system as an example. The system should take interventions or issue warnings only if it is very confident that the driver is in a very emotional state. Similarly, in a behavioral study, it is more important to have reliable estimates of the participants’ emotional states during a few times rather than continuous estimation that is less accurate. Therefore, utilizing a rejection strategy is beneficial for many emotion classification systems.
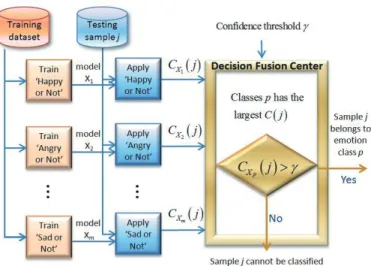
Figure 1 illustrates our emotion classification system. In the learning phase, for each utterance, the extracted speech features and the emotion labels are used to train each individual OAA SVM modelXi, wherei = 1,2,...,m, andm
denotes the number of emotion classes. In the testing phase, speech features of the testing utterance j are extracted and then sent to each trained model Xi, resulting in confidence value CXi(j), where j = 1,2,...,n, and n denotes
Figure 1: Our emotion classification approach using OAA SVM with thresholding fusion.
the number of testing utterances. Assuming that model Xp yields the
high-est confidence measure for utterancej, the confidence measureCXp(j) is then
compared against a user-controlled confidence thresholdγto decide whether to reject the sample as unclassified. We show in Section 5.3 that setting the confi-dence thresholdγto a higher value can result in a higher emotion classification accuracy. However, more instances are left as unclassified.
4. Datasets and evaluation metrics
Before we present the experimental evaluation of our emotion classification system, we explain the speech datasets and the evaluation metrics used in this work.
4.1. LDC and UGA datasets
To train our emotion classification system as well as to test its perfor-mance, we select two speech emotion analysis datasets, which are the LDC dataset Liberman et al. (2002) and the UGA dataset Bri (2016). A few samples of the speech utterances from the LDC and the UGA datasets are available on the University of Rochester Wireless Communications and Networking Group’s
T able 1: Comparison of our system and sev eral state-of-the-art emotion classification systems that also use the LDC dataset. System Dataset F eatures Classifier Sp eak er norm. Ov er-sampling F eature selec- tion F rame length Our system LDC F0 , F0 difference, energy , energy difference, frequencies and band-widths for F1 -F4 , sp eaking rate, MF CCs SVM Y es Y es Y es 60 ms Rac h uri et al. Rac h uri et al. (2010 ) LDC 32 p erceptual linear predictiv e co efficien ts (static and delta v al-ues) GMM No N/A No 30 ms Bitouk et al. Bitouk et al. (2010 ) LDC F0 , F0 delta, F1 , energy , en-ergy delta, jitter, shimmer, rel-ativ e sp ectral energy ab o v e 500 Hz, duration of v oiced segmen ts, MF CCs and duration o v er differ-en t phoneme regions SVM Y es No Y es 25 ms Seth u et al. Seth u et al. (2008 ) LDC zero crossing rate, energy , F0 , w eigh ted frequency GMM Y es N/A No 40 ms
website Bri (2016), to provide readers with a better understanding of these two datasets.
For English speech-based emotion analysis that our system is designed for, the LDC dataset Liberman et al. (2002) is one of the standard benchmark datasets Bitouk et al. (2010)Rachuri et al. (2010). The advantage of using this library is that the emotions generated by professionals are expressed more ex-plicitly compared to speech recorded by ordinary people. An alternative is to use speech material from movies Hoque et al. (2006) or recordings of everyday life. However, it is difficult to determine appropriate reference labels, since many natural utterances are emotionally ambiguous.
The LDC dataset includes a collection of speech files recorded by professional actors and actresses reading semantically neutral-meaning utterances such as dates and numbers spanning fourteen distinct emotion categories. Each utter-ance is between one and two seconds in length. Six emotions are selected in our emotion classification study as in Bitouk et al. (2010): disgust, happiness, sadness, anger, fear and neutral. There are three male speakers and four female speakers in the LDC database. About 15-25 utterances are spoken by each speaker for every emotion category, and there are 727 utterances in the LDC dataset in total.
The UGA dataset contains utterances spoken by students from the Univer-sity of Georgia. Similar with the LDC dataset, the utterances in the UGA dataset are also dates and numbers. The same six emotions are acted by each one of the 133 students, and 10,489 utterances are included in the UGA dataset in total. Though more data can be used to train the emotion classification system, the diverse ways of expressing emotions by different speakers raises a challenge to the system as well. Also, people who are not actors or actresses tend to convey their emotions in a more implicit way, which makes it more dif-ficult to classify emotions based only on speech. Additionally, the data is much noisier in the UGA dataset than it is in the LDC dataset.
4.2. Evaluation metrics
Since different state-of-the-art emotion classification systems use different performance evaluation metrics, to compare our system with these systems, we explain several evaluation metrics as follows.
We define the ratio of unclassified instances in the test set asrejection rate. We can vary the rejection rate by tuning the threshold parameterγfrom Fig. 1. To measure the average classification performance for all classified emotions after fusion, we define the metric ‘decision-level (DL) correct classification rate’ as: DL-%correct= m ∑ i=1 Dtpi N , (1)
where Dtpi denotes the number of decision-level true positive utterances for
emotioni,m denotes the number of emotion classes, andN denotes the total number of utterances.
To evaluate the emotion classification performance for each individual emo-tion, we use the metric ‘decision-level (DL) recall for emotioni’, which is defined as:
DL-recallEmotioni =
Dtpi
Dtpi+Df ni
, (2)
where, as defined in (1), Dtpi and Df ni denote the number of decision-level
true positive and false negative utterances, respectively, for emotioni.
The classifier-level (CL) accuracy is used to evaluate the performance for each individual OAA classifiers. Note that this value is not used for the final emotion classification, which is derived after fusing the OAA binary decisions. The ‘CL-accuracy’ for classifierXi, i.e., for the classification of an instance as
‘Emotionior Not’ is defined as:
CL-accuracyXi=
Ctpi+Ctni
N , (3)
whereCtpiandCtni denote the number of classifier-level true positive and true
negative utterances for emotioni, respectively. N denotes the total number of utterances.
5. Emotion classification performance
In order to analyze the performance of our OAA SVM-based thresholding fusion emotion classification system, we first compare the proposed full system with three state-of-the-art studies when no data is rejected. Then we show the effectiveness of using the three enhancement strategies through evaluations. Additionally, the performance improvement by using the thresholding fusion mechanism is presented for a general test and gender-dependent tests. Finally, the performance on more challenging scenarios is evaluated, including a speaker-independent test, a test on noisy speech samples, and a test on speech samples from ordinary speakers. Unless noted otherwise, for each individual testing scenario, we present our results using 80 selected features, a small feature set that still provides a relatively high emotion classification accuracy.
5.1. Comparison with state-of-the-art systems
We first compare the performance of our emotion classification system with three state-of-the-art emotion classification methods that were also evaluated using the LDC dataset. The LDC dataset is used for both the training and testing through seven rounds of cross-validations. A summary of the compar-ison of the systems is presented in Table 1. Unlike SVM, the GMM classifier used in Rachuri et al. (2010) and Sethu et al. (2008) is not a binary classifier. Therefore, no over-sampling is needed, and thus we leave the entries for these two reference system as N/A in Table 1.
We provide either decision-level emotion classification recall or classifier-level emotion classification accuracy depending on what metrics were provided by the reference systems.
5.1.1. Performance comparison for general test
The work in Rachuri et al. (2010) classifies five emotions: anger, sadness, neutral, happiness and fear. In Rachuri et al. (2010), similar narrow emotions in the LDC dataset are clustered to the above five broad emotion categories. For example, three narrow emotions, elation, happiness, and interest, are grouped
anger sadness disgust neutral happiness fear 0 10 20 30 40 50 60 70 80 90 100 Emotion categories D e ci si o n −l e ve l e mo ti o n cl a ssi fi ca ti o n re ca ll (% ) Proposed Referenced
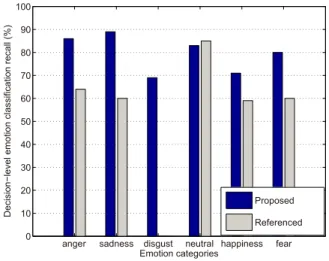
Figure 2: Decision-level emotion classification recall (%) for each individual emotion for our system without rejecting any samples and the method in Rachuri et al. (2010), using the LDC dataset. Speaker normalization, feature selection, and over-sampled training sets are used.
into a broad happiness emotion category. However, in our study, only sam-ples in the narrow happiness category are used for happiness. Decision-level recall values, as defined in (2), are used to evaluate the emotion classification performance for each emotion.
Figure 2 compares the decision-level recall for each individual emotion for our system with that obtained by the method in Rachuri et al. (2010). Since disgust is not among the emotion categories evaluated in Rachuri et al. (2010), we leave the result for disgust for the reference system blank in the figure. We can see that our system outperforms the method in Rachuri et al. (2010) for four emotions, i.e., anger, sadness, happiness, and fear.
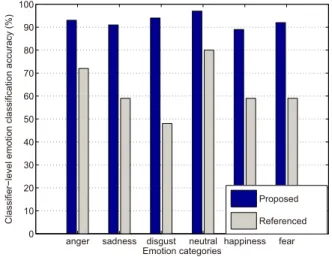
Another method, proposed in Bitouk et al. (2010), also classifies the same six emotions as our work using the LDC dataset. They use classifier-level (CL) accuracy, as defined in (3), to evaluate the performance for each OAA clas-sifier in their system. Hence, in Fig. 3, we compare the clasclas-sifier-level emo-tion classificaemo-tion accuracy for our system with that obtained by the method in Bitouk et al. (2010) for each individual emotion. From Bitouk et al. (2010),
anger sadness disgust neutral happiness fear 0 10 20 30 40 50 60 70 80 90 100 Emotion categories C la ssi fi e r−l e ve l e mo ti o n cl a ssi fi ca ti o n a ccu ra cy (% ) Proposed Referenced
Figure 3: Classifier-level emotion classification accuracy (%) for each individual emotion for our system without rejecting any samples and the method in Bitouk et al. (2010), using the LDC dataset. Speaker normalization, feature selection, and over-sampled training sets are used.
we use the results derived by using their best setting, i.e., ‘combined features’, which is class-level spectral features plus utterance-level prosodic features. We can see in Fig. 3 that the classifier-level accuracy for our system outperforms the results in Bitouk et al. (2010) for all individual OAA classifiers.
5.1.2. Performance comparison for speaker independent test
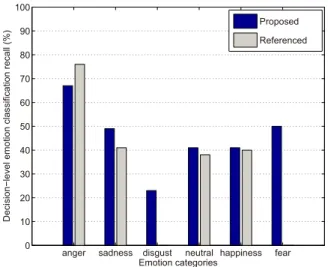
The authors in Sethu et al. (2008) classify five emotions: anger, sadness, neutral, happiness, and boredom using the LDC dataset. In Fig. 4, we compare the decision-level recall for each individual emotion for our system with that obtained by the method in Sethu et al. (2008). For Sethu et al. (2008), we use the results obtained by using their best feature set ‘ZEP+WF’ (including zero crossing rate, energy, pitch, and weighted frequency). Since disgust and fear are not among the emotion categories evaluated in Sethu et al. (2008), we leave the results for disgust and fear for the reference system blank in the figure. Comparing the results for the speaker-independent test in Fig. 4 with the results for the general test in Fig. 2, we can see that our system performance drops
anger sadness disgust neutral happiness fear 0 10 20 30 40 50 60 70 80 90 100 Emotion categories D e ci si o n −l e ve l e mo ti o n cl a ssi fi ca ti o n re ca ll (% ) Proposed Referenced
Figure 4: Decision-level emotion classification recall (%) for each individual emotion for our system without rejecting any samples and the method in Sethu et al. (2008) for the speaker-independent test using the LDC dataset. Speaker normalization, feature selection, and over-sampled training sets are used.
greatly when no data from the user has been used for training. Compared with the results derived by Sethu et al. (2008), our system provides higher decision-level recall values for sadness, neutral, and happiness, but lower decision-decision-level recall values for anger.
5.2. The effectiveness of three enhancement strategies
Our proposed system contains three performance enhancement strategies, i.e., speaker normalization, feature selection, and over-sampling the training set. In order to gain a better understanding of the system, it is important to analyze the effectiveness of each individual strategy on the final system performance. In this section, we evaluate the effectiveness of these three strategies. The LDC dataset is used for both the training and testing through seven rounds of cross-validations.
First, we compare the decision-level correct classification rates, as defined in (1) with and without speaker normalization when no data is rejected. All
features are used in this evaluation, and the training set is over-sampled us-ing SMOTE Chawla et al. (2002), as described in detail in Section 3.5. Due to the randomness in the synthetic sample generation process in the SMOTE algorithm, we generate the over-sampled training set for five different trials, and the performance is calculated by averaging these five trials. Results show that using speaker normalization achieves a decision-level correct classification rate of 81.0%, which is slightly higher than the result without using speaker normalization, which is 80.5%.
Second, we evaluate the benefit of using feature selection. We compare the emotion classification performance using the LDC dataset with a feature set chosen by mutual information and a referenced feature set with randomly selected features, respectively. Features are randomly selected five times for the referenced feature set, and the average results are calculated. An over-sampled dataset is used for training, as explained in Section 3.5, and speaker normalization is used.
Results show that using features selected by mutual information achieves about 5 percentage points higher classification rate than using randomly se-lected features when 20 features are sese-lected. This difference becomes smaller as the number of selected features decreases. However, using features selected by mutual information sometimes can achieve a lower classification rate than using randomly selected features. This is because the features are selected independently from each other, and features are selected only based on their mutual information to the class label. Thus “them best features are not the bestmfeatures” Peng et al. (2005). Therefore, using mutual information can-not guarantee that the optimal feature set, which provides the highest correct classification rate, is selected.
We calculate the correct classification rates using different numbers of se-lected features using the LDC dataset, when all samples are classified. We find that using 80 out of 121 selected features can already provide a relatively high emotion classification rate, while one third of the features are not used, which reduces the computational complexity of the SVM classification.
To investigate which features are the most relevant to emotion classification, we illustrate in Table 2 which features are selected as the total number of features changes. We can see that MFCCs account for the largest portion of the selected features. Additionally, almost all energy and F0 features are included in the
selected feature set. Formants and speaking rate features are the last ones included in the feature set as the total number of selected features increases.
Table 2: The number of selected features for different sizes of the feature set for the general test using the LDC dataset. The total number of features is 121. Speaker normalization and over-sampled training sets are used.
Number of se-lected features 20 40 60 80 100 121 F0and difference ofF0 7 8 9 9 9 10
Energy and dif-ference of energy
6 7 8 8 8 10
Formants 0 1 6 18 33 40
MFCCs 7 24 37 45 49 60
Speaking rate 0 0 0 0 1 1
Finally, we compare the correct classification rates when using the three sam-pling methods for generating the training set as presented in Section 3.5, using all the features and speaker normalization. Results show that using an over-sampled dataset for OAA classifier training achieves a slightly higher correct classification rate of 81.0%, than using the raw uneven dataset, which achieves a correct classification rate of 79.6%. Due to the reduced number of samples in the under-sampled training set, the under-sampling method achieves the lowest classification accuracy of 75.1%.
5.3. Performance evaluation using thresholding fusion
In order to determine how much benefit is gained by using thresholding fusion and thereby leaving some samples as unclassified, we performed several tests. First, we evaluate the performance as we increase the threshold and thus increase the number of rejected samples using the entire LDC dataset. Then,
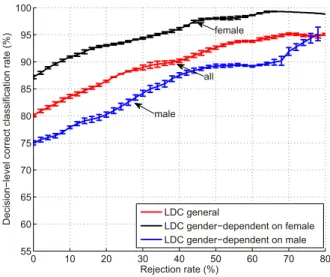
0 10 20 30 40 50 60 70 80 55 60 65 70 75 80 85 90 95 100 Rejection rate (%) D e ci si o n −l e ve l co rre ct cl a ssi fi ca ti o n ra te (% ) LDC general LDC gender−dependent on female LDC gender−dependent on male all female male
Figure 5: Decision-level correct classification rate vs. rejection rate for the general test and the gender-dependent tests using the LDC dataset with speaker normalization, feature selection, and over-sampled training sets.
we examine the impact of the thresholding fusion using gender-dependent tests, where only the female (or male) samples from the LDC dataset are used for training and testing.
5.3.1. General test
The LDC dataset is used for both the training and testing through seven rounds of cross-validations. Figure 5 shows the decision-level correct classifi-cation rate when we change the rejection rate by tuning the confidence score thresholdγ. 80 features are selected for this test. When most of the testing data is rejected, very few samples are left, and we cannot obtain a reliable classifica-tion performance. Thus, we do not show the decision-level correct classificaclassifica-tion rate when the rejection rate is above 80%.
As we can see from Fig. 5, the decision-level correct classification rate gen-erally increases as a higher confidence threshold is used, and hence, as more data is rejected. This number can be increased to 93% when 50% of the data is rejected. Therefore, using the thresholding fusion method can provide a more
reliable emotion classification at the expense of leaving some data unclassified. As discussed previously, this can be valuable for a number of applications that provide actions based on the classification outcome. For these applications, it is much more important that the classification is accurate than it is to classify every sample with a lower accuracy.
5.3.2. Gender-dependent tests
Speech features differ between male and female speakers. For example, the F0of speech varies from 40 Hz for low-pitched male voices to 600 Hz for children
or high-pitched female voices Huang et al. (2001). In order to illustrate how gender affects the emotion classification performance, we compare the results for gender-dependent tests with those for the previous general test that uses both male and female samples for both training and testing. For the gender-dependent tests, cross-validation is performed on all the samples for one gender for training and testing.
Figure 5 also shows the decision-level correct classification rate with different rejection rates for the gender-dependent tests on male and female speakers, respectively. Note that the features are selected only based on male or female speech utterances, and thus the top selected features are not the same.
The gender-dependent emotion classification performance for females is higher than that for males. Since the number of samples for female speakers is larger than that for male speakers in the LDC dataset, we have also tried using the same number of samples for both genders to train the model. Results are not shown in this paper, but similar conclusions are obtained that the gender-dependent test for females provides better results than those for males. Another important result that we can see from this data is that the thresholding fusion mechanism improves the performance for males significantly, which is important since the performance for males when the thresholding fusion module is off is much lower than for females.
5.3.3. Comparing with naive human coders
As shown in the above tests, our proposed system can increase the classi-fication accuracy by rejecting to classify utterances for which it is not confi-dent. However, it is not clear how well this system, which in many applications would replace human classification of the emotion, compares to a naive human coder performing the same emotion classification task. Therefore, in our work in Eskimez et al. (2016), we asked Amazon Mechanical Turk workers (Turkers) to listen to speech samples from the LDC dataset of emotions and classify them into six categories. There were 138 unique Turkers that classified 7,270 audio samples, with individual Turkers classifying between 10 and 100 audio samples. If we compare the Turkers accuracy in classifying the emotions when all sam-ples are classified with the accuracy when only those samsam-ples for which they were confident in their classification are considered, we see very little difference in the accuracy values. The Turkers’ accuracy increases from 60.4% when no samples are rejected to 60.6% when 20% of the samples are rejected. This tells us that humans are not able to accurately estimate their performance and reliability on the emotion classification task. Hence, we see that one clear advantage of an automatic emotion classification system over human coders is this ability to improve classification accuracy by rejecting to classify some samples. In appli-cations where not all samples must be classified and the cost of misclassification is high, this can be a valuable means to increase emotion classification accuracy.
5.4. Performance evaluation for more challenging scenarios
In this section, we analyze the performance of our system in more challenging scenarios, namely when the speaker is not included in the training set (speaker-independent test), when the speech data is noisy, and using data from the UGA dataset with non-professional acted emotions.
5.4.1. Speaker-independent test
Emotions are expressed in different ways by different speakers, and the speech features for different speakers vary as well. Thus, to get an idea of
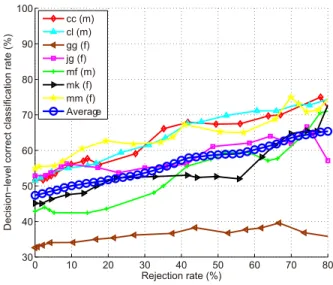
0 10 20 30 40 50 60 70 80 30 40 50 60 70 80 90 100 Rejection rate (%) D e ci si o n −l e ve l co rre ct cl a ssi fi ca ti o n ra te (% ) cc (m) cl (m) gg (f) jg (f) mf (m) mk (f) mm (f) Average
Figure 6: Decision-level correct classification rate vs. rejection rate for the speaker-independent test using the LDC dataset. Speaker normalization, feature selection, and over-sampled training sets are used.
how our system performs when it is used on a new speaker, we run a speaker-independent test, where data from the tested speaker is not used in the training phase.
For the speaker-independent tests, we use the same 80 features as the feature set used for the general test. Figure 6 shows the decision-level correct classifi-cation rate for the speaker-independent tests using the LDC dataset with the over-sampled training dataset and speaker normalization. The legend denotes the initials of the seven speakers, where the gender of the speakers is added after the initials as ‘m’ for male speakers and ‘f’ for female speakers. We also show the speaker-independent result averaged over all seven speakers.
As shown in Fig. 6, the decision-level correct classification rate increases from 47% when no data is rejected to 65% when 80% of the data is rejected. Compared with the general test results shown in Fig. 5, the decision-level correct classification rate drops by about 33 percentage points when no samples from the target speaker are included in the training set. This shows the need for
prior training with the subjects to achieve a good performance in our emotion classification system.
5.4.2. Test on noisy data
For emotion classification in real scenarios, noise is a factor that inevitably needs to be considered when we evaluate the system performance. We add babble and white noise to the LDC speech signals to generate a noisy dataset. The noise database we use is Varga et al. (1992). A moderate noise level, i.e., noisy data at 5 dB Signal-to-Noise Ratio (SNR), is used for testing.
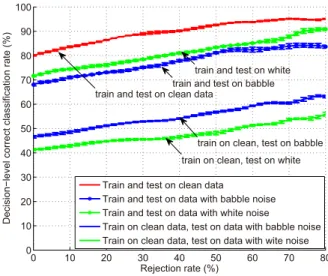
In order to classify emotions on noisy data, there are two approaches to train the system: using clean data or noisy data. In Fig. 7, we compare the results for both approaches with the results for training and testing on clean data. Results are shown for training on an over-sampled dataset using feature selection and speaker normalization. We can see that for emotion classification on noisy data, it is more effective to train the system using noisy data than using clean data. Although speaker normalization helps to combat the overall increase in energy for the noisy data, it does not help with features in the frequency domain. When trained with noisy data, the system can, on the other hand, learn the spectral features for noisy speech. Therefore, we can see from Fig. 7 that the decision-level correct classification rate does not drop too much for training and testing on noisy data.
5.4.3. Test on UGA data
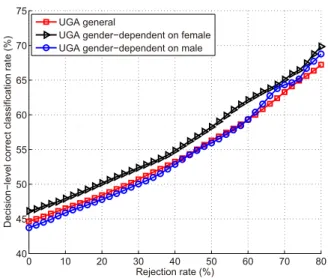
We also evaluate our emotion classification system on the UGA dataset Bri (2016), in which different emotions are acted by university students. As with the prior tests, cross-validation is performed using the UGA dataset, and the decision-level correct classification rates are shown in Fig. 8 for the general test and the gender-dependent tests. Speaker normalization, feature selection, and the over-sampled training sets are used.
Although the UGA dataset contains many more samples than the LDC dataset to train the system, the decision-level correct classification rate for the
0 10 20 30 40 50 60 70 80 0 10 20 30 40 50 60 70 80 90 100 Rejection rate (%) D e ci si o n −l e ve l co rre ct cl a ssi fi ca ti o n ra te (% )
Train and test on clean data
Train and test on data with babble noise Train and test on data with white noise
Train on clean data, test on data with babble noise Train on clean data, test on data with wite noise
train on clean, test on babble train on clean, test on white
train and test on white train and test on babble train and test on clean data
Figure 7: Decision-level correct classification rate vs. rejection rate for a general test on clean and noisy LDC data at 5 dB SNR. Speaker normalization, feature selection, and over-sampled training sets are used.
UGA dataset is decreased from 80% for the LDC dataset to 45% for the UGA dataset for general tests with no data rejected. This drop in performance is mainly due to the fact that the emotion expressed in the UGA data is not very strong and explicit, which makes it hard to effectively train the system. The decision-level correct classification rate increases from 45% to 56% when 50% of the data is rejected as unclassified. We can see that the decision-level correct classification rate is increased by 24.4% of 45% for the UGA dataset when the rejection rate increases from 0 to 50%. Compared with the decision-level correct classification rate for the LDC dataset shown in Fig. 5, in which this increase is only 16.2% of 80%, we find that the thresholding fusion mechanism may provide more benefit for more realistic scenarios.
Similar with the dependent results for the LDC dataset, the gender-dependent tests using the UGA dataset provide better results for female speakers than for male speakers. Also, since the UGA dataset contains 133 speakers, speaker normalization becomes important.
0 10 20 30 40 50 60 70 80 40 45 50 55 60 65 70 75 Rejection rate (%) D e ci si o n −l e ve l co rre ct cl a ssi fi ca ti o n ra te (% ) UGA general
UGA gender−dependent on female UGA gender−dependent on male
Figure 8: Decision-level correct classification rate vs. rejection rate for a general test and gender-dependent tests using the UGA dataset. Speaker normalization and feature selection are used.
6. Conclusions and future work
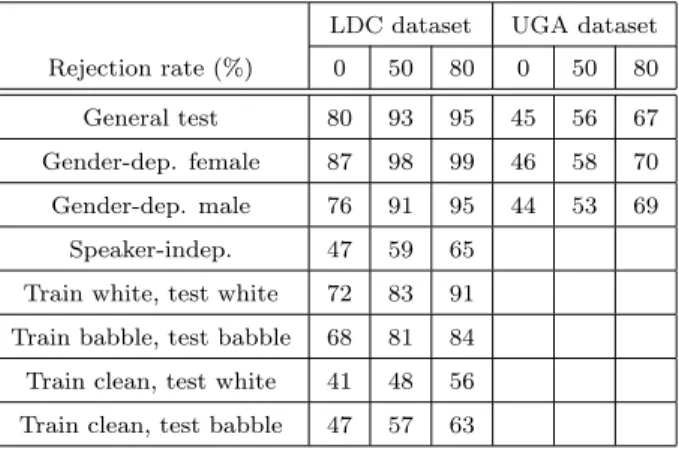
In this paper, we present a speech-based emotion classification system based on multi-class SVM and a thresholding fusion mechanism. A full analysis is provided for different test scenarios. A summary of the results are presented in Table 3.
Results show that our system outperforms several state-of-the-art methods. Also, the thresholding fusion mechanism is proven to effectively increase the emotion classification accuracy, and the increase is more prominent for non-professionally acted recordings. Naive human coders, on the other hand, do not show a significantly higher classification accuracy for their confident utterances versus unconfident ones, showing an advantage of the thresholding fusion mech-anism of the proposed computer system. In addition, the system performance drops for some more realistic and challenging situations, but the overall results are still acceptable. For emotion classification on noisy data, it is more effective to train the system using noisy data than using clean data.
Table 3: Summary of decision-level correct classification rates (%) for the LDC dataset and the UGA dataset at rejection rates of 0, 50%, and 80%. Speaker normalization, feature selection, and over-sampled training sets are used for both the LDC dataset and the UGA dataset.
LDC dataset UGA dataset
Rejection rate (%) 0 50 80 0 50 80
General test 80 93 95 45 56 67
Gender-dep. female 87 98 99 46 58 70 Gender-dep. male 76 91 95 44 53 69
Speaker-indep. 47 59 65 Train white, test white 72 83 91 Train babble, test babble 68 81 84 Train clean, test white 41 48 56 Train clean, test babble 47 57 63
For future work, we will explore other noise-resilient speech feature extrac-tion methods in addiextrac-tion toF0 detection using the BaNa algorithm. Also, we
are developing an Android implementation to extract the speech features used in this paper, which are then sent to an online server for emotion classification. Since the application only sends the statistics of the speech features to the server for processing instead of the entire speech utterance, the privacy of the user is better preserved and the bandwidth for transmission is reduced.
Acknowledgments
This research was supported by funding from the National Institute of Health NICHD (Grant R01 HD060789). We thank Dr. Jennifer Samp for obtaining the voice recordings from students at the University of Georgia. We also thank Sefik Emre Eskimez and Kenneth Imade for conducting the human user study using Amazon Mechanical Turk.
References
Implementation of extracting MFCCs included in the VOICEBOX toolkit. http://www.ee.ic.ac.uk/hp/staff/dmb/voicebox/voicebox.html.
MATLAB implementation of mutual information. http:// www.mathworks.com/matlabcentral/fileexchange/
14888-mutual-information-computation; 2007.
Wireless Communication and Networking Group, University of Rochester. http://www.ece.rochester.edu/projects/wcng/project_bridge.html; 2016.
Al Machot F, Mosa AH, Dabbour K, Fasih A, Schwarzlmuller C, Ali M, Kya-makya K. A novel real-time emotion detection system from audio streams based on Bayesian quadratic discriminate classifier for ADAS. In: Nonlinear Dynamics and Synchronization 16th Int’l Symposium on Theoretical Electri-cal Engineering, Joint 3rd Int’l Workshop on. 2011. .
Ang J, Dhillon R, Krupski A, Shriberg E, Stolcke A. Prosody-based automatic detection of annoyance and frustration in human-computer dialog. In: Pro-ceeings of International Conference on Spoken Language Processing. 2002. p. 2037–40.
Ba H, Yang N, Demirkol I, Heinzelman W. BaNa: A noise resilient fundamental frequency detection algorithm for speech and music. Audio, Speech, and Language Processing, IEEE/ACM Transactions on 2014;22(12):1833–48. Bakeman R. Behavioral observation and coding, Handbook of research methods
in social psychology. Cambridge University Press, 1997.
B¨anziger T, Patel S, Scherer KR. The role of perceived voice and speech char-acteristics in vocal emotion communication. Journal of nonverbal behavior 2014;38(1):31–52.
Bao H, Xu MX, Zheng TF. Emotion attribute projection for speaker recognition on emotional speech. In: Procceedings of Interspeech. 2007. p. 758–61. Barra-Chicote R, Yamagishi J, King S, Montero JM, Macias-Guarasa J.
Analy-sis of statistical parametric and unit selection speech syntheAnaly-sis systems applied to emotional speech. Speech Communication 2010;52(5):394–404.
Bellegarda JR. Data-driven analysis of emotion in text using latent affective folding and embedding. Computational Intelligence 2013;29(3):506–26. Bitouk D, Ragini V, Ani N. Class-level spectral features for emotion recognition.
Journal of Speech Communication 2010;52(7-8):613–25.
Black MP, Katsamanis A, Baucom BR, Lee CC, Lammert AC, Christensen A, Georgiou PG, Narayanan SS. Toward automating a human behavioral coding system for married couples’ interactions using speech acoustic features. Speech communication 2013;55(1):1–21.
Chang K, Fisher D, Canny J. AMMON: A speech analysis library for analyzing affect, stress, and mental health on mobile phones. In: 2nd International Workshop on Sensing Applications on Mobile Phones. 2011. .
Chawla NV, Bowyer KW, Hall LO, Kegelmeyer WP. SMOTE: Synthetic mi-nority over-sampling technique. Journal of Artificial Intelligence Research 2002;16(1):321–57.
Cowie R, Douglas-Cowie E, Savvidou S, McMahon E, Sawey M, Schr¨oder M. ‘FEELTRACE’: An instrument for recording perceived emotion in real time. In: ISCA Tutorial and Research Workshop (ITRW) on Speech and Emotion. 2000. .
Eskimez SE, Imade K, Yang N, Sturge-Appley M, Duan Z, Heinzelman W. Emotion classification: How does an automated system compare to naive human coders? In: Acoustics, Speech and Signal Processing, Proceedings of the IEEE International Conference on. 2016. .
Farr´us M, Ejarque P, Temko A, Hernando J. Histogram equalization in SVM multimodal person verification. In: Proceedings of IAPR/IEEE International Conference on Biometrics. 2007. .
Goudbeek M, Goldman JP, Scherer KR. Emotion dimensions and formant position. In: INTERSPEECH. 2009. p. 1575–8.
Goyal A, Riloff E, Daum´e III H, Gilbert N. Toward plot units: Automatic affect state analysis. In: Proceedings of HLT/NAACL Workshop on Computational Approaches to Analysis and Generation of Emotion in Text (CAET). 2010. . Gupta P, Rajput N. Two-stream emotion recognition for call center monitoring.
In: INTERSPEECH. 2007. p. 2241–4.
Hoque M, Yeasin M, Louwerse M. Robust recognition of emotion from speech. In: Intelligent Virtual Agents. Springer Berlin Heidelberg; volume 4133 of
Lecture Notes in Computer Science; 2006. p. 42–53.
Hsu CW, Chang CC, Lin CJ. A practical guide to support vector classification 2003;.
Huang X, Acero A, Hon HW. Spoken Language Processing. volume 15. Prentice Hall PTR New Jersey, 2001.
Huisman G, Van Hout M, van Dijk E, van der Geest T, Heylen D. Lemtool - measuring emotions in visual interfaces. In: Proceedings of the SIGCHI Conference on Human Factors in Computing Systems. 2013. .
de Jong NH, Wempe T. Automatic measurement of speech rate in spoken Dutch. ACLC Working Papers 2007;2(2):49–58.
Kawanami H, Iwami Y, Toda T, Saruwatari H, Shikano K. GMM-based voice conversion applied to emotional speech synthesis. In: Proceedings of Eu-rospeech. 2003. .
Kerig P, Baucom D. Couple Observational Coding Systems. Routledge, 2004. Lee C, Lee GG. Emotion recognition for affective user interfaces using natural
language dialogs. In: Procceedings of IEEE International Symposium on Robot and Human interactive Communication. 2007. p. 798–801.
Lee CM, Narayanan SS. Toward detecting emotions in spoken dialogs. Speech and Audio Processing, IEEE Transactions on 2005;13(2):293–303.
Lee CM, Narayanan SS, Pieraccini R. Combining acoustic and language infor-mation for emotion recognition. In: proceeding of 7th International Confer-ence on Spoken Language Processing. 2002. .
Lee L, Rose RC. Speaker normalization using efficient frequency warping pro-cedures. In: Acoustics, Speech, and Signal Processing (ICASSP), IEEE In-ternational Conference on. volume 1; 1996. p. 353–6.
Liberman M, Davis K, Grossman M, Martey N, Bell J. Emotional prosody speech and transcripts. Linguistic Data Consortium (LDC), Philadelphia 2002;.
Ling C, Dong M, Li H, Yu ZL, Chan P. Machine learning methods in the application of speech emotion recognition. Application of Machine Learning 2010;:1–19.
O.W. K, K. C, J. H, T. W. L. Emotion recognition by speech signals. In: EUROSPEECH. 2003. p. 125–8.
¨
Ozkul S, Bozkurt E, Asta S, Yemez Y, Erzin E. Multimodal analysis of upper-body gestures, facial expressions and speech. In: Procceedings of the 4th International Workshop on Corpora for Research on Emotion Sentiment and Social Signals. 2012. .
Peng H, Long F, Ding C. Feature selection based on mutual information: Cri-teria of max-dependency, max-relevance, and min-redundancy. IEEE Trans-actions on Pattern Analysis and Mchine Intelligence 2005;27(8):1226–38. Platt JC. Fast training of support vector machines using sequential minimal
optimization. Advances in Kernel Methods 1999;:185–208.
Qin L, Ling ZH, Wu YJ, Zhang BF, Wang RH. Hmm-based emotional speech synthesis using average emotion model. In: Procceedings of Chinese Spoken Language Processing. 2006. p. 233–40.
Rachuri KK, Musolesi M, Mascolo C, Rentfrow PJ, Longworth C, Aucinas A. EmotionSense: A mobile phones based adaptive platform for experimental social psychology research. In: Proceedings of the 12th ACM International Conference on Ubiquitous Computing. 2010. p. 281–90.
Roberto B. Using mutual information for selecting features in supervised neural net learning. IEEE Transactions on Neural Networks 1994;5(4):537–50. Rong J, Li G, Chen YPP. Acoustic feature selection for automatic
emo-tion recogniemo-tion from speech. Information Processing and Management 2009;45(3):315–28.
Sauter DA, Eisner F, Calder AJ, Scott SK. Perceptual cues in nonverbal vocal expressions of emotion 2010;63(11):2251–72.
Scherer KR. Vocal communication of emotion: A review of research paradigms. Speech Communication 2003;40(1-2):227–56.
Scherer KR. What are emotions? and how can they be measured? Social Science Information 2005;44(4):695–729.
Schuller B, Rigoll G, Lang M. Hidden markov model-based speech emotion recognition. In: Acoustics, Speech, and Signal Processing (ICASSP), IEEE International Conference on. volume 2; 2003. p. II–1.
Schuller B, Rigoll G, Lang M. Speech emotion recognition combining acoustic features and linguistic information in a hybrid support vector machine-belief network architecture. In: Acoustics, Speech, and Signal Processing (ICASSP), IEEE International Conference on. volume 1; 2004. p. I–577.
Schuller B, Vlasenko B, Minguez R, Rigoll G, Wendemuth A. Comparing one and two-stage acoustic modeling in the recognition of emotion in speech. In: Automatic Speech Recognition Understanding, IEEE Workshop on. 2007. p. 596–600.
Sethu V, Ambikairajah E, Epps J. Empirical mode decomposition based weighted frequency feature for speech-based emotion classification. In: Acous-tics, Speech and Signal Processing, IEEE International Conference on. 2008. p. 5017–20.
Shafran I. A comparison of classifiers for detecting emotion from speech. In: IEEE International Conference on Acoustics, Speech and Signal Processing. 2005. .
Shrawankar U, Thakare VM. Adverse conditions and ASR techniques for robust speech user interface. arXiv preprint arXiv:13035515 2013;.
Steidl S, Polzehl T, Bunnell HT, Dou Y, Muthukumar PK, Perry D, Prahallad K, Vaughn C, Black AW, Metze F. Emotion identification for evaluation of synthesized emotional speech. In: Procceedings of Speech Prosody. 2012. . Tacconi D, Mayora O, Lukowicz P, Arnrich B, Setz C, Troster G, Haring C.
Activity and emotion recognition to support early diagnosis of psychiatric diseases. In: Pervasive Computing Technologies for Healthcare (Pervasive-Health), Second International Conference on. 2008. p. 100–2.
Tang H, Chu SM, Hasegawa-Johnson M, Huang TS. Emotion recognition from speech via boosted Gaussian mixture models. In: Multimedia and Expo (ICME), IEEE International Conference on. 2009. p. 294–7.
Vapnik VN. The Nature of Statistical Learning Theory. Springer-Verlag New York, Inc., 1995.
Vapnik VN. Statistical Learning Theory. Wiley, 1998.
Varga AP, Steeneken HJM, Tomlinson M, Jones D. NOISEX-92 study on the effect of additive noise on automatic speech recognition. http://spib.ece. rice.edu/spib/data/signals/noise/; 1992.
Vlasenko B, Schuller B, Wendemuth A, Rigoll G. Combining frame and turn-level information for robust recognition of emotions within speech. In: IN-TERSPEECH. 2007. p. 2249–52.
Wu CH, Kung C, Lin JC, Wei WL. Two-level hierarchical alignment for semi-coupled hmm-based audiovisual emotion recognition with temporal course. IEEE Transactions on Multimedia 2013;15(8):1880 –95.
Wu G, Chang EY. Class-boundary alignment for imbalanced dataset learning. In: Workshop on Learning from Imbalanced Datasets II, ICML. 2003. p. 49– 56.
Wu S, Falk TH, Chan WY. Automatic recognition of speech emotion using long-term spectro-temporal features. In: Procceedings of the 16th International Conference on Digital Signal Processing. 2009. .
Xia R, Liu Y. Using i-vector space model for emotion recognition. In: Proc-ceedings of Interspeech. 2012. .
Yang N, Muraleedharan R, Kohl J, Demirkol I, Heinzelman W, Sturge-Apple M. Speech-based emotion classification using multiclass SVM with hybrid kernel and thresholding fusion. In: Spoken Language Technology Workshop (SLT), 2012 IEEE. 2012. p. 455 –60.
Yang Y, Fairbairn C, Cohn JF. Detecting depression severity from vocal prosody. Affective Computing, IEEE Transactions on 2013;4(2):142–50. Yun S, Yoo CD. Loss-scaled large-margin gaussian mixture models for speech
emotion classification. IEEE Transactions on Audio, Speech, and Language Processing 2012;20(2):585–98.
Zhang S, Zhao X, Lei B. Speech emotion recognition using an enhanced ker-nel isomap for human-robot interaction. International Journal of Advanced Robotic Systems 2013;10.