Correlation tests for high-dimensional data
using extended cross-data-matrix methodology
著者
Yata Kazuyoshi, Aoshima Makoto
journal or
publication title
Journal of multivariate analysis
volume
117
page range
313-331
year
2013-05
権利
(C) 2013 Elsevier Inc.
NOTICE: this is the author's version of a work
that was accepted for publication in Journal
of Multivariate Analysis. Changes resulting
from the publishing process, such as peer
review, editing, corrections, structural
formatting, and other quality control
mechanisms may not be reflected in this
document. Changes may have been made to this
work since it was submitted for publication. A
definitive version was subsequently published
in Journal of Multivariate Analysis, Vol.117,
Pages:313-331. doi:10.1016/j.jmva.2013.03.007.
URL
http://hdl.handle.net/2241/118867
Correlation tests for high-dimensional data using
extended cross-data-matrix methodology
Kazuyoshi Yataa, Makoto Aoshimaa,1,
aInstitute of Mathematics, University of Tsukuba, Ibaraki 305-8571, Japan
Abstract
In this paper, we consider tests of correlation when the sample size is much lower than the dimension. We propose a new estimation methodology called the extended cross-data-matrix methodology. By applying the method, we give a new test statistic for high-dimensional correlations. We show that the test statistic is asymptotically normal when p → ∞ and n → ∞. We propose a test procedure along with sample size determination to assure both prespecified size and power for testing high-dimensional correlations. We further develop a multiple testing procedure to control both family wise error rate and power. Finally, we demonstrate how the test procedures perform in actual data analyses by using two microarray data sets.
Keywords: Cross-data-matrix methodology; Graphical modeling; HDLSS; High-dimensional regression; Pathway analysis; Two-stage procedure.
1. Introduction
A common feature of high-dimensional data is that the data dimension is high, however, the sample size is relatively small. This is the so-called “HDLSS” or “large p, small n” data situation where p/n → ∞; here p
is the data dimension and n is the sample size. The asymptotic studies of this type of data are becoming increasingly relevant. In recent years, substantial work had been done on the asymptotic behavior of eigenvalues of the sample covariance matrix in the limit as p → ∞, see Johnstone [19]
Email address: [email protected](Makoto Aoshima)
and Paul [22] for Gaussian assumptions and Baik and Silverstein [6] for non-Gaussian but i.i.d. assumptions. Those literatures handled the cases whenp
andn increase at the same rate, i.e. p/n →c > 0. The asymptotic behaviors of high-dimensional, low-sample-size (HDLSS) data were studied by Ahn et al. [1], Hall et al. [16], and Yata and Aoshima [31] when p → ∞ while n is fixed. They explored conditions to give a geometric representation of HDLSS data. The HDLSS asymptotic study usually assumes either the normality as the population distribution or a ρ-mixing condition as the dependency of random variables in a sphered data matrix. See Jung and Marron [20]. Yata and Aoshima [29] succeeded in investigating the consistency properties of both eigenvalues and eigenvectors of the sample covariance matrix in more general settings including the case that all eigenvalues are in the range of sphericity. In addition, Yata and Aoshima [30] created the cross-data-matrix (CDM) methodology that provides effective inference on the eigenspace for HDLSS data. Recently, Chen and Qin [9] gave a two-sample test for dimensional data. Aoshima and Yata [2, 3] developed a variety of high-dimensional statistical inference based on the geometric representations and gave sample size determination to assure prespecified accuracy. In this paper, we consider tests of correlation coefficients for high-dimensional data and give sample size determination to assure prespecified accuracy.
Letx1(∗),x2(∗), ... be a sequence of i.i.d. p+ 1-variate data vectors, where
xj(∗) = (xTj, xj(∗))T with xj = (x1j, ..., xpj)T. Having recorded x1(∗), ...,xn(∗). We assume n ≥ 4. Here, xj has unknown mean vector, µ, and unknown
covariance matrix, Σ (≥ O), and xj(∗) has unknown mean vector, µ∗, and unknown variance, σ2
∗ ∈ (0,∞). Let θ = (µ∗, σ∗2,µ,Σ). We denote the
covariance vector between xj and xj(∗) by Covθ(xj, xj(∗)) = σ. We denote the correlation coefficient vector betweenxj andxj(∗)by Corrθ(xj, xj(∗)) =ρ. We consider testing the correlation between xj and xj(∗) by
H0 :ρ=0 vs. H1 :ρ̸=0. (1)
The test of the correlation is a very important tool of pathway analysis or graphical modeling for high-dimensional data. For example, Drton and Perl-man [11] and Wille et al. [27] considered pathway analysis or graphical mod-eling of microarray data by testing an individual correlation coefficient. On the other hand, Hero and Rajaratnam [17] considered correlation screening procedures for high-dimensional data by using a test of correlations. Zhong and Chen [32] considered tests of a regression coefficient vector on linear
regression models. Aoshima and Yata [2] created a test statistic for (1) by using the CDM methodology.
LetΣ=HΛHT, whereΛis a diagonal matrix of eigenvalues,λ1 ≥ · · · ≥
λp ≥ 0, and H is an orthogonal matrix of corresponding eigenvectors. We
assume that lim supp→∞tr(Σ)/p <∞. Let xj =HΛ1/2zj +µ, j = 1, ..., n.
Then, E(zj) = 0and Var(zj) =Ip, whereIp denotes the identity matrix of
dimension p. In this paper, we assume the following model:
xj =Γwj+µ, (2)
where Γ= (γ1, ...,γr) is a p×r matrix for some r >0 such that ΓΓT =Σ, and wj, j = 1, ..., n, are i.i.d. random vectors having E(wj) = 0 and
Var(wj) = Ir. See also Bai and Saranadasa [5] and Chen and Qin [9]. Note
that the model (2) includes the case that Γ =HΛ1/2 and wj =zj. As for
wj = (w1j, ..., wrj)T, we assume that
(A-i) The fourth moments ofwijs are uniformly bounded, andwij, i=
1, ..., r, are independent.
We assume the following assumption for Σ as necessary:
(A-ii) tr(Σ
4)
tr(Σ2)2 →0 as p→ ∞.
Remark 1. If all λis are bounded, (A-ii) is trivially true. For a spiked
model such as λi = aipαi (i = 1, ..., m) and λi = ci (i = m+ 1, ..., p) with
positive constants ais, cis and αis, (A-ii) is true under the conditions that
αi <1/2, i= 1, ..., mandm <∞. See Yata and Aoshima [30] for the details
of a spiked model. For Σ = c(ρ|i−j|q) with c (> 0), q (> 0) and ρ ∈ (0,1), (A-ii) holds. In addition, for the above cases, it holds that tr(Σ2) =O(p).
Let xj(∗) =c∗wj∗ + r ∑ i=1 ciwij +µ∗, (3)
where c∗ and cis are constants such that c2∗ +
∑r i=1c
2
i = σ∗2, and wj∗ is a
random variable such that E(wj∗) = 0, E(wj2∗) = 1, and E(wijwj∗) = 0 for
i = 1, ..., r. Note that ∑ri=1ciγi = σ and
∑r
i,i′cici′γiTγi′ = ||σ||2, where
|| · || denotes the Euclidean norm. Then, xj and xj(∗) (j = 1, ..., n) are uncorrelated when ∑ri=1ciγi = 0. In this paper, we assume the following
(A-iii) The fourth moment ofwj∗ is bounded, and wj∗ and wj are
inde-pendent.
If xj(∗) is Gaussian, (A-i) and (A-iii) hold.
Remark 2. Let wr+1j = wj∗ for each j. We consider the following
as-sumption: The fourth moments of wij, i = 1, ..., r + 1, are bounded, and
E(wα1 l1jw α2 l2j· · ·w αq lqj) = E(w α1 l1j)E(w α2 l2j)· · ·E(w αq lqj) for all l1 ̸= l2 ̸= · · · ̸= lq ∈
[1, r+ 1], where αis are integers within [0,4] such that
∑q
i=1αi ≤ 8. See Chen and Qin [9] and Zhong and Chen [32] for the assumption. Then, we can claim all the results in this paper under the assumption instead of (A-i) and (A-iii).
Throughout this paper, we write that
Sn = n ∑ j=1 (xj−xn)(xj −xn)T n−1 , Sn(∗)= n ∑ j=1 (xj(∗)−xn(∗))2 n−1 and sn(∗) = n ∑ j=1 (xj(∗)−xn(∗))(xj −xn) n−1 , (4) where xn =n−1 ∑n j=1xj and xn(∗) =n−1 ∑n
j=1xj(∗). When n > p, one may consider a multiple correlation coefficient by ρ = (σTΣ−1σ/σ2
∗)1/2. Then, a
test statistic of (1) is given by ρb= (sT n(∗)S−
1
n sn(∗)/Sn(∗))1/2. When xj(∗) is Gaussian, a certain transformation of ρbis distributed as an F-distribution. See, for example, Chapter 4 in Fujikoshi et al. [13]. However, in the HDLSS context wherep > n,ρbdoes not work since the inverse matrix ofSndoes not
exist. Several authors considered substituting some estimators such as the Moore-Penrose inverse matrix forS−n1. See Srivastave [25] for example. Yata and Aoshima [31] applied a method called the noise-reduction methodology
to estimatingΣ−1 and compared performance of estimators ofΣ−1. Refer to Sections 7 and 8 of Yata and Aoshima [31]. As for a test of independence for high-dimensional data, one may refer to Sz´ekely et al. [26] about distance correlation.
In this paper, we provide test procedures for correlations appeared in HDLSS data. In Section 2, we propose a new estimation method called the
extended cross-data-matrix methodology. By applying the method, we give a new test statistic for high-dimensional correlations. We show that the test statistic is asymptotically normal when p → ∞ and n → ∞. In Section 3,
we propose a test procedure along with sample size determination to assure both prespecified size and power for testing high-dimensional correlations. In Section 4, we develop a multiple testing procedure to control both family wise error rate and power. Finally, in Section 5, we demonstrate how the test procedures perform in actual data analyses by using two microarray data sets.
2. Test of high-dimensional correlations
Throughout this paper, we consider applying the following new estimation method called the extended cross-data-matrix (ECDM) methodology. The ECDM methodology is considered as an extension of the CDM methodology developed by Yata and Aoshima [30].
2.1. Extended cross-data-matrix (ECDM) methodology
Let n(1) = ⌈n/2⌉ and n(2) = n −n(1), where ⌈x⌉ denotes the smallest integer≥x. Now, we consider two setsVn(1)(k)andVn(2)(k)(k= 3, ...,2n−1) such that #(Vn(l)(k)) = n(l), l = 1,2, Vn(1)(k) ∩ Vn(2)(k) = ∅, Vn(1)(k) ∪
Vn(2)(k) ={1, ..., n} and
i∈Vn(1)(i+j) and j ∈Vn(2)(i+j) for i < j (≤n), (5) where #(S) denotes the number of elements in a set S. Then, we find the two sets as follows:
Vn(1)(k) = {{ ⌊k/2⌋ −n(1)+ 1, ...,⌊k/2⌋ } if ⌊k/2⌋ ≥n(1), { 1, ...,⌊k/2⌋}∪{⌊k/2⌋+n(2)+ 1, ..., n } otherwise and Vn(2)(k) = {{ ⌊k/2⌋+ 1, ...,⌊k/2⌋+n(2) } if ⌊k/2⌋ ≤n(1), { 1, ...,⌊k/2⌋ −n(1) } ∪{⌊k/2⌋+ 1, ..., n} otherwise
for k = 3, ...,2n−1, where ⌊x⌋ denotes the largest integer≤x. The ECDM methodology is a method to provide an unbiased estimator by usingVn(1)(i+j) and Vn(2)(i+j).
Let xn(1)(k) =n−(1)1 ∑ j∈Vn(1)(k) xj, xn(2)(k)=n−(2)1 ∑ j∈Vn(2)(k) xj, xn(1∗)(k) =n−(1)1 ∑ j∈Vn(1)(k) xj(∗), and xn(2∗)(k) =n−(2)1 ∑ j∈Vn(2)(k) xj(∗)
for k = 3, ...,2n −1. Note that Eθ{(xi(∗) −xn(1∗)(i+j))(xi −xn(1)(i+j))} =
n−(1)1(n(1)−1)σ and Eθ{(xj(∗)−xn(2∗)(i+j))(xj−xn(2)(i+j))}=n−(2)1(n(2)−1)σ for i < j(≤n). From (5), we emphasize the following facts:
(i) xi−xn(1)(i+j) and xj −xn(2)(i+j) are independent; (ii) xi(∗)−xn(1∗)(i+j) and xj(∗)−xn(2∗)(i+j) are independent for i < j (≤n). We propose an estimator of ||σ||2 by
b Tn,σ = 2un n(n−1) n ∑ i<j (xi−xn(1)(i+j))T(xj −xn(2)(i+j)) ×(xi(∗)−xn(1∗)(i+j))(xj(∗)−xn(2∗)(i+j)), (6) where un = n(1)n(2)/{(n(1)−1)(n(2) −1)}. Then, we note that Eθ(Tbn,σ) =
||σ||2. Let Var(w2
ij) =Mi,i= 1, ..., r. Letσ∗4 = (σ2∗)2. Under (A-i) to (A-iii),
from Lemma A.1 in Appendix, we have as p→ ∞and n → ∞ that Varθ(Tbn,σ) = {2σ4 ∗tr(Σ2) n2 + 4 n ( σ∗2σTΣσ+||σ||4 + r ∑ i=1 (Mi−2)c2i(σ Tγ i)2 )} {1 +o(1)}. (7)
Remark 3. Another unbiased estimator of ||σ||2 is b Tn,σ(AY) = 1 (n(1)−1)(n(2)−1) n(1) ∑ i=1 n ∑ j=n(1)+1 (xi−xn(1)(n+1))T(xj−xn(2)(n+1)) ×(xi(∗)−xn(1∗)(n+1))(xj(∗)−xn(2∗)(n+1))
that was given by Aoshima and Yata [2] when applying the CDM methodol-ogy. Then it holds as p→ ∞ and n → ∞ that Varθ(Tbn,σ(AY)) = [4σ∗4tr(Σ2)
/n2+ 4{σ2 ∗σTΣσ+||σ||4+ ∑r i=1(Mi−2)c 2 i(σTγi)2}/n]{1 +o(1)}under
(A-i) to (A-ii(A-i). Thus the asymptotic variance of Tbn,σ is smaller than that of
b
Tn,σ(AY). The ECDM methodology is not a resampling-based extension of the CDM methodology. The ECDM methodology considers the combination of cross data matrices so as to construct an unbiased estimator efficiently and enjoy desirable properties in non-Gaussian situations. See Section 2.5 for the details. As for a resampling-based extension, see Aoshima and Yata [4].
Remark 4. One can save the computational cost of Tbn,σ by substituting
previously calculated xn(i)(k)s and xn(i∗)(k)s in (6). Then, the computational cost of Tbn,σ is written by the order,O(n2p).
2.2. Asymptotic distribution of Tbn,σ
We assume the following extra assumption:
(A-iv) lim inf σ 2 ∗ √ tr(Σ2) n||σ||2 >0 as p→ ∞and n→ ∞ when ||σ|| 2 ̸= 0. Then, we have the following theorem.
Theorem 2.1. Assume (A-i) to (A-iv). It holds as p→ ∞and n→ ∞ that
b
Tn,σ− ||σ||2
√
Varθ(Tbn,σ)
⇒N(0,1), (8)
where “⇒” denotes the convergence in distribution and N(0,1) denotes a random variable distributed as the standard normal distribution.
If one cannot assume (A-iv), we have the following result.
Corollary 2.1. Assume (A-i) and (A-iii). Assume σ∗2√tr(Σ2)/(n||σ||2) =
o(1). Then, it holds as p→ ∞ and n → ∞ that
b
Tn,σ
We emphasize that the assertion in Theorem 2.1 is still claimed under the HDLSS setting where p/n→ ∞. From the facts that ∑ri=1c2i(σTγi)2 ≤
σ∗2σTΣσ ≤ σ∗2||σ||2λ1 ≤ σ∗2||σ||2tr(Σ4)1/4 and lim supn||σ||2/{σ2∗tr(Σ2)1/2}
< ∞ under (A-iv), we note that Varθ(Tbn,σ)/{2σ∗4tr(Σ2)/n2} = 1 +o(1) as
p→ ∞andn → ∞under (A-i) to (A-iv). SinceΣandσ∗2 are unknown, it is necessary to estimate tr(Σ2) and σ2
∗. By applying the ECDM methodology,
we propose an estimator of tr(Σ2) by Wn= 2un n(n−1) n ∑ i<j {(xi−xn(1)(i+j))T(xj−xn(2)(i+j))}2. (9)
We note that Eθ(Wn) = tr(Σ2). As for the variance of Wn, see Section 2.5.
Then, we have the following result.
Corollary 2.2. Assume (A-i) to (A-iv). It holds as p → ∞ and n → ∞
that b Tn,σ− ||σ||2 Sn(∗) √ 2Wn/n ⇒N(0,1).
Remark 5. From (7), under (A-i) to (A-iv), it holds asp→ ∞and n→ ∞
that Varθ(Tbn,σ) 2σ4 ∗tr(Σ2)/n2 = 1 + 2n { σ2∗σTΣσ+||σ||4+∑ri=1(Mi−2)c2i(σTγi)2 } σ4 ∗tr(Σ2) +o(1) = 1 +o(1).
Thus one may write (8) as b Tn,σ− ||σ||2 σ2 ∗ √ 2tr(Σ2)(1 +u)/n ⇒N(0,1), where u= 2n{σ2 ∗σTΣσ+||σ||4 + ∑r i=1(Mi−2)c2i(σTγi)2}/{σ4∗tr(Σ2)}.
Let us observe Corollary 2.2 in view of Remark 5. Now, we considered an easy example such as µ = 0, Σ = (0.3|i−j|1/3
), µ∗ = 0, σ2 ∗ = 1, Γ = HΛ1/2 and ρ = 0 (c1 = · · · = cr = 0, c∗ = 1) or ρ ̸= 0 (||σ||2 = ∑10 i=1λi/20; c1 = · · · = c10 = √
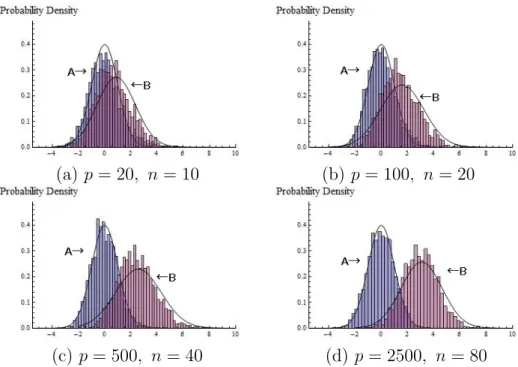
(a) p= 20, n= 10 (b) p= 100, n = 20
(c) p= 500, n= 40 (d) p= 2500, n= 80
Figure 1: The solid lines are probability densities ofA:N(0,1) andB:N(ω,1 +u). The histograms of Tbn,σ/{Sn(∗)
√
2Wn/n} for both the cases of ρ=0and ρ̸=0fit the solid
lines with increasing dimension and sample size: (a) (p, n) = (20,10), (b) (p, n) = (100,20), (c) (p, n) = (500,40), and (d) (p, n) = (2500,80).
r = p and ||σ||2 = ∑p
i=1c2iλi from Γ = HΛ1/2. We considered four cases:
(a) p = 20, n = 10, (b) p = 100, n = 20, (c) p = 500, n = 40, and (d) p = 2500, n = 80. Fig.1 (a), (b), (c) and (d) give the histograms of 2000 independent outcomes of Tbn,σ/{Sn(∗)
√
2Wn/n} both when ρ = 0
and ρ ̸= 0. Here, xj, j = 1, ..., n, were generated independently from a
pseudorandom normal distribution with mean vector zero and covariance matrixΣfor each case of (p, n) = (20,10), (100,20), (500,40) and (2500,80). Note that Mi = 2, i = 1, ..., p. Independent of xj, wj∗, j = 1, ..., n, were
generated independently from a pseudorandom standard normal distribution. Let ω = ||σ||2/(σ∗2√2tr(Σ2)/n). From Corollary 2.2 in view of Remark 5, we expected that Tbn,σ/(Sn(∗)
√
2Wn/n) is close to N(0,1) when ρ = 0 and
b
Tn,σ/(Sn(∗) √
2Wn/n) is close to N(ω,1 +u) when ρ ̸= 0. When p = 20
and p= 100, the histograms appear different from the probability densities especially when ρ ̸= 0. However, as expected, the histograms fit well the probability densities as p and n increase.
2.3. Test of correlations
We are interested in designing a test of (1) having size α, where α ∈
(0,1/2) is a prespecified constant. We test the hypothesis (1) by rejecting H0 ⇐⇒ b Tn,σ Sn(∗) √ 2Wn/n > zα, (10)
where zα is a constant such that P{N(0,1) > zα} = α. Then, we have the
following theorem.
Theorem 2.2. Under (A-i) to (A-iv), the test by (10) has that size=α+o(1) and power = Φ
( n||σ||2 σ2 ∗ √ 2tr(Σ2) −zα ) +o(1) (11)
as p→ ∞ and n→ ∞, where Φ(·) denotes the c.d.f. of N(0,1).
When (A-iv) is not met, we have the following result.
Corollary 2.3. Assume (A-i) to (A-iii). Assume σ2
∗
√
tr(Σ2)/(n||σ||2) =
o(1) when ρ̸=0. Then, the test by (10) has that
size=α+o(1) and power = 1 +o(1)
as p→ ∞ and n→ ∞.
Remark 6. From Remark 5, one may write the power in (11) as
power = Φ ( n||σ||2 σ2 ∗ √ 2tr(Σ2)(1 +u) − zα √ 1 +u ) +o(1), where u= 2n{σ2 ∗σTΣσ+||σ||4 + ∑r i=1(Mi−2)c 2 i(σTγi)2}/{σ4∗tr(Σ 2)}.
2.4. Moderate sample performances
In order to study the performance of the test by (10), we used computer simulations. We set α = 0.05. We generated xjs independently from a
pseudorandom normal distribution with mean vector zero and covariance matrix Σ. Independent of xjs, we generated wj∗s independently from a
pseudorandom normal distribution with zero mean and unit variance. We considered σ2
∗ = 1, Σ = (0.3|i−j|
1/3
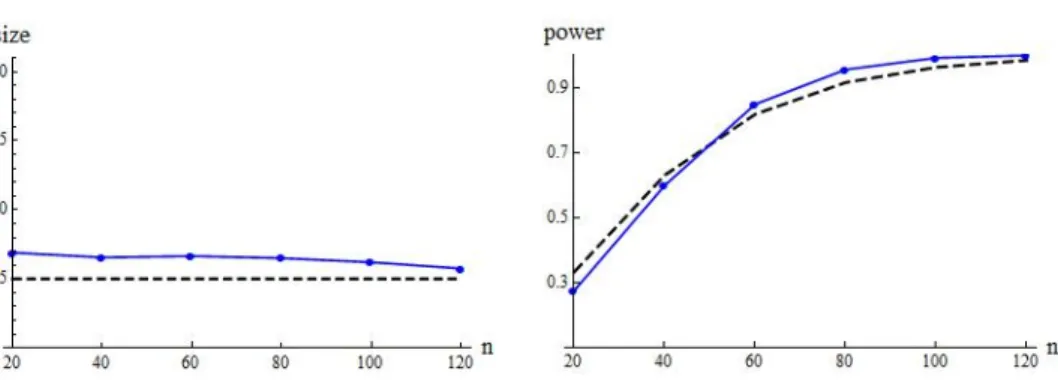
Figure 2: Whenp= 1000 and n= 20(20)120, the sizeα= 0.05 (broken line) andα(solid line) are displayed in the left panel. The power Φ[{2σ4
∗tr(Σ2)(1 +u)}−1/2n||σ||2−(1 +
u)−1/2z
α] (broken line) and 1−β (solid line) are displayed in the right panel.
Figure 3: Whenp= 2s(s= 5, ...,11) andn= 2⌈p1/2⌉, the sizeα= 0.05 (broken line) and α(solid line) are displayed in the left panel. The power Φ[{2σ∗4tr(Σ2)(1 +u)}−1/2n||σ||2−
(1 +u)−1/2zα] (broken line) and 1−β (solid line) are displayed in the right panel.
and ||σ||2 = ∑p
i=1c2iλi from Γ = HΛ1/2. We considered two cases: (i)
ρ = 0 (c1 = · · · = cp = 0, c∗ = 1) and (ii) ρ ̸= 0 (||σ||2 = λ5/2; c5 = √
1/2, c∗ =√1/2 and the other cis are 0). In Fig. 2, we set p= 1000 and
n = 20(20)120. In Fig. 3, we set p = 2s (s = 5, ...,11) and n = 2⌈p1/2⌉. The findings were obtained by averaging the outcomes from 4000 (=R, say) replications, where the first 2000 replications were generated for (i), and the last 2000 replications were generated for (ii).
Under a fixed scenario, suppose that the rth replication ends with a test result given by (10). We defined Pr = 1 (or 0) accordingly as H0 : ρ = 0 was falsely rejected (or not) and H1 : ρ ̸= 0 was falsely rejected (or not). We defined α = (R/2)−1∑R/2
r=1Pr to estimate the size and 1− β = 1− (R/2)−1∑R
of the simulation study was no more than 0.0112. Throughout, we observed that the test by (10) showed good performances as described in Theorem 2.2 (or Remark 6) as pand n increase.
2.5. Comparison of estimators for tr(Σ2)
From Lemma A.2 in Appendix, we have as p→ ∞and n → ∞ that Varθ ( W n tr(Σ2) ) = ( 4 n2 + 8tr(Σ4) + 4∑ri=1(Mi −2)(γTi Σγi)2 tr(Σ2)2n ) {1 +o(1)} under (A-i). Further, if xj is Gaussian, we have as p → ∞ and n →
∞ that Varθ{Wn/tr(Σ2)} = [4/n2 + 8tr(Σ4)/{tr(Σ2)2n}]{1 + o(1)}. Yata
[28] applied the CDM methodology due to Yata and Aoshima [30] to ob-taining an unbiased estimator of tr(Σ2) by tr(Sn(1)Sn(2)), where Sn(1) = (n(1) − 1)−1 ∑n(1) j=1(xj − xn(1)(n+1))(xj − xn(1)(n+1))T and Sn(2) = (n(2) − 1)−1∑n j=n(1)+1(xj−xn(2)(n+1))(xj−xn(2)(n+1)) T. Note thatE θ{tr(Sn(1)Sn(2))} = tr(Σ2). Then, it holds as p→ ∞ and n→ ∞ that
Varθ (tr(S n(1)Sn(2)) tr(Σ2) ) = ( 8 n2 + 8tr(Σ4) + 4∑ri=1(Mi−2)(γTi Σγi)2 tr(Σ2)2n ) {1 +o(1)}
under (A-i). Thus the asymptotic variance of Wn is smaller than that of
tr(Sn(1)Sn(2)). On the other hand, Bai and Saranadasa [5] and Srivastava [24] considered an estimator of tr(Σ2) byWn(BS) =c−n1{tr(S
2
n)−tr(Sn)2/(n−1)}
with cn = (n −2)(n+ 1)/(n −1)2 under the Gaussian assumption. They
showed that, when xj is Gaussian, it holds thatEθ(Wn(BS)) = tr(Σ2) and Varθ (W n(BS) tr(Σ2) ) = ( 4 n2 + 8tr(Σ4) tr(Σ2)2n ) {1 +o(1)}.
Thus the ECDM methodology is desirable in the sense that the asymp-totic variance of Wn is equivalent to that of Wn(BS) which specializes the Gaussian case. It should be noted that Wn(BS) is biased unless xj is
Gaus-sian. In addition, one cannot claim Varθ{Wn(BS)/tr(Σ2)} < ∞ unless the eighth moments of each variable in wj are uniformly bounded. Contrary
On the other hand, Zhong and Chen [32] considered an unbiased estima-tor of tr(Σ2) by Wn(Z) = {n(n − 1)}−1 ∑n i̸=j(x T ixj)2 − 2{n(n − 1)(n − 2)}−1∑ni̸=j̸=kxTi xjxTjxk+{n(n−1)(n−2)(n−3)}−1 ∑n i̸=j̸=k̸=lx T i xjxTkxl.
Note that the asymptotic variance ofWn(Z) is equivalent to that ofWnunder
(A-i). However, the computational cost of Wn(Z) is written by the order,
O(n4p). Contrary to that, the computational cost of Wn is O(n2p) by
sub-stituting previously calculated xn(i)(k)s in (9). In conclusion, the ECDM methodology is an efficient method to construct an unbiased estimator in non-Gaussian situations.
3. Sample size determination to control both size and power
We are interested in designing a test of (1) having size α and power no less than 1−β when||σ||2/{σ2
∗tr(Σ)} ≥∆L, whereα∈(0,1/2), β ∈(0,1/2)
and ∆L (> 0) are prespecified constants. We note that ||σ||2/{σ∗2tr(Σ)} ∈
[0,1]. We emphasize that ||σ||2/{σ∗2tr(Σ)} represents a contribution ofxj(∗) to xj. See Remark 8. We assume that ∆L = o{
√
tr(Σ2)/tr(Σ)} and lim infp→∞p∆L>0.
3.1. Sample size determination
We considern satisfying √ Varθ(Tbn,σ)≤ σ2 ∗tr(Σ)∆L zα+zβ when ||σ|| 2 σ2 ∗tr(Σ) ≤ ∆L
under (A-i) to (A-iii). Then, one would find the sample size such as
n ≥ (zα+zβ) ∆Ltr(Σ) √ 2tr(Σ2)+2(zα+zβ) 2 σ4 ∗∆2Ltr(Σ)2 ( σ∗2σTΣσ+||σ||4 + r ∑ i=1 (Mi−2)c2i(σ T γi)2 ) (=C, say). (12) We consider testing the hypothesis (1) by
rejecting H0 ⇐⇒Tbn,σ >
Sn(∗)tr(Sn)∆Lzα
zα+zβ
. (13)
Note that C → ∞, namely, n → ∞ as p → ∞ from the fact that ∆L =
Theorem 3.1. Under (A-i) to (A-iii), the test by (12)-(13) has that
lim sup
p→∞
size≤α and lim inf
p→∞ power≥1−β when
||σ||2
σ2
∗tr(Σ) ≥
∆L.
Remark 7. Note that (A-ii) implies √tr(Σ2)/tr(Σ) → 0 as p → ∞
from (A.5) in Appendix. Then, it holds as p → ∞ that C/p → 0 under lim supp→∞||σ||2/{σ2
∗∆Ltr(Σ)}<∞and lim infp→∞p∆L>0.
Remark 8. We consider a multivariate linear regression model such as
Y =XΥ+E.
Here, Y = [x1, ...,xn]T is ann×presponse matrix,X = [1,(x1(∗), ..., xn(∗))T] is an n ×2 fixed design matrix having 1 = (1, ...,1)T, and Υ is a 2 ×p
parameter matrix. The n rows of E are independent and identically dis-tributed as a p-variate distribution with mean vector zero and covariance matrix Σ. We assume that the fourth moments of each variable in E are uniformly bounded. A squared multiple correlation coefficient is given by
R2 = ||sn(∗)||2/{Sn(∗)tr(Sn)}, where sn(∗), Sn(∗) and Sn are defined in (4).
We assume that Sn(∗) → σ2∗ and sn(∗) → σ in probability as n → ∞. Note that tr(Sn)→tr(Σ) in probability as n→ ∞. Then, it holds asn→ ∞that
R2 → ||σ||2/{σ∗2tr(Σ)} in probability. Thus one can apply the correlation test procedure to a test whether R2 = 0 or R2 ̸= 0.
3.2. Two-stage procedure
Since C includes unknown parameters, it is necessary to estimate C in (12) with some pilot samples. However, it is very difficult to estimate σTΣσ
and ∑ri=1(Mi −1)c2i(σTγi)2. Hence, from the fact that
∑r i=1c 2 i(σTγi)2 σ4 ∗tr(Σ) ≤ σTΣσ σ2 ∗tr(Σ) ≤ λ1∆L≤tr(Σ4)1/4∆L =o{tr(Σ2)1/2∆L}
when ||σ||2/{σ∗2tr(Σ)} ≤∆L under (A-ii), we modify C as follows:
C = (zα+zβ) ∆Ltr(Σ) √ 2tr(Σ2){1 +o(1)}+ 2(zα+zβ)2 || σ||4 σ4 ∗∆2Ltr(Σ)2 (14) ≈ (zα+zβ) ∆Ltr(Σ) √ 2tr(Σ2) + 2η(zα+zβ)2 (=C⋆, say), (15)
where η ∈ [0,1] is a chosen constant. See Remark 9 for a choice of η. Note that C⋆/C → 1 as p → ∞ when ||σ||2/{σ∗2tr(Σ)} ≤ ∆L under
(A-ii). We propose a two-stage test procedure in order to estimate C⋆ assuring
the prespecified accuracy. We proceed with the following two steps: 1. Choosem (≥4) such as m C⋆ ≤ 1, C⋆ m2 →0 and C⋆ m tr(Σ4) tr(Σ2)2 →0 as p→ ∞. (16) Note that m satisfying m/C⋆ → c ∈ (0,1) as p → ∞ holds (16) under
(A-ii). Also, note that Varθ{tr(Sm)/tr(Σ)}=o(C⋆−1) and Varθ{Wm/tr(Σ2)}=
o(C−1
⋆ ) under (A-i)-(A-ii) and (16). Take pilot samples, xj(∗)= (xTj, xj(∗))T,
j = 1, ..., m. Then, calculate Sm and Wm according to (4) and (9). Define
the total sample size by
N = max { m, ⌈ (z α+zβ) ∆Ltr(Sm) √ 2Wm+ 2η(zα+zβ)2 ⌉} . (17)
2. If N = m, do not take any additional samples. If N > m, take additional samples,xj(∗), j =m+ 1, ..., N. By combining the initial samples and the additional samples, calculate SN(∗), SN and TbN,σ according to (4)
and (6). Under (A-i)-(A-iii), from the fact that C=C⋆−2η(zα+zβ)2 when
ρ=0, it holds that √ Varθ(TbC(⋆),σ) = {1−2η(zα+zβ)2/C(⋆)}σ∗2tr(Σ)∆L zα+zβ { 1 +o(1)} when ρ=0, whereC(⋆) =⌈C⋆⌉. Then, test the hypothesis (1) by
rejecting H0 ⇐⇒TbN,σ >
{1−2η(zα+zβ)2/N}SN(∗)tr(SN)∆Lzα
zα+zβ
. (18) We have the following theorem.
Theorem 3.2. Under (A-i) to (A-iii), the test by (18) with (16)-(17) has that
lim
p→∞size=α and lim infp→∞ power ≥1−β when
||σ||2
σ2
∗tr(Σ) ≥
Remark 9. When the lower bound is attained, namely||σ||2 =σ2
∗tr(Σ)∆L,
we claim from (14) that {σ∗2tr(Σ)∆L /(zα+zβ)}/{Varθ(TbC(⋆),σ)}
1/2 ={1 +
o(1)}C(⋆)/C ={1 +o(1)}/{1 + 2(1−η)(zα+zβ)2/C(⋆)} →1 under (A-i) to (A-iii). Let ζ = 2(zα+zβ)2/C(⋆). Then, from Theorem 2.1 and (18), it holds that {1−ηζ}σ2 ∗tr(Σ)∆Lzα (zα+zβ){Varθ(TbC(⋆),σ)} 1/2 − ||σ||2 {Varθ(TbC(⋆),σ)} 1/2 = {1−ηζ}zα−zα−zβ 1 + (1−η)ζ {1 +o(1)}= −zβ(1 +ηζzα/zβ) 1 + (1−η)ζ {1 +o(1)} → −zβ when ||σ||2 =σ2
∗tr(Σ)∆L. Thus one may choose η such that 1 +ηζzα/zβ =
1 + (1−η)ζ, that is η=zβ/(zα+zβ).
Remark 10. It holds asp→ ∞ thatN/C⋆ = 1 +op(1) andC⋆/p→0; that
is in the HDLSS situation in the sense that N/p=op(1).
Remark 11. One can claim that√tr(Σ2)/tr(Σ)≥p−1/2, where the equality holds only when λ1 = · · · = λp. For the cases in Remark 1, it holds that
√
tr(Σ2)/tr(Σ) = O(p−1/2). Thus for those cases, one may choose a pilot sample size by m = max { 4, ⌈(z α+zβ) √ 2 ∆L√p + 2η(zα+zβ)2 ⌉} .
Then, (16) holds under (A-ii).
Remark 12. One may choose m (≥4) such asm/C⋆ >1. Then, the
asser-tion in Theorem 3.2 is still claimed. However, it may cause over-sampling in the sense that N/C⋆ >1 w.p.1.
3.3. Moderate sample performances
In order to study the performance of the two-stage test procedure given by (18) with (16)-(17), we used computer simulations. We fixed ∆L = 5/p.
Our goal was to construct a test having size α= 0.05 and power no less than 1−β = 0.9 when||σ||2/{σ2
∗tr(Σ)} ≥∆L. We considered a non-Gaussian case
by setting r = p, Γ =HΛ1/2 and wij = (8/10)1/2vij in (2), where vij, i =
1, ..., p (j = 1,2, ...) are independently distributed as t-distribution with 10 degrees of freedom. Note that E(wij) = 0, E(w2ij) = 1, and (A-i) holds.
Independent ofvijs, we generatedvj∗s independently from the pseudorandom
t-distribution with 10 degrees of freedom. We set wj∗ = (8/10)1/2vj∗ (j =
1,2, ...) so as to satisfy (A-iii). We considered σ2∗ = 1 and Σ=B(ρ|i−j|1/3)B
having ρ∈(0,1) and
B= diag(√0.5 + 1/(p+ 1),√0.5 + 2/(p+ 1), ...,√0.5 +p/(p+ 1)).
Note that tr(Σ) = p. We set m = ⌈C⋆/2⌉. We considered two choices of η
as η=zβ/(zα+zβ) from Remark 9 and η= 1. We considered the following
four cases when p = 500 and 1000: (a) ρ = 0.3 and η = zβ/(zα+zβ); (b)
ρ = 0.3 and η = 1; (c) ρ = 0.5 and η = zβ/(zα+zβ); and (d) ρ = 0.5 and
η = 1.
In Table 1, we summarized the findings obtained by averaging the out-comes from 4000 (= R, say) replications, where the first 2000 replications were generated for ρ = 0 by setting as c1 = · · · = cp = 0 and c∗ = 1 in
(3), and the last 2000 replications were generated for ρ ̸= 0 by setting as
cg =
√
5/λg,c∗ =
√ 1−c2
g and the othercis are 0 (i.e., ||σ||2 =c2gλg = 5 and
||σ||2/{σ2
∗tr(Σ)}= 5/p) in (3). Here, we setg = 5 forρ= 0.3 andg = 10 for
ρ = 0.5. Under a fixed scenario, suppose that the rth replication ends with
N =nr observations given by (17) and the test result given by (18). We
de-finedPr = 1 (or 0) accordingly asH0 : ρ=0was falsely rejected (or not) and
H1 : ρ̸=0was falsely rejected (or not). We definedα= (R/2)−1 ∑R/2
r=1Prto
estimate the size and 1−β = 1−(R/2)−1∑Rr=R/2+1Prto estimate the power
when||σ||2/{σ∗2tr(Σ)}= ∆L, while their estimated standard errors,s(α) and
s(β), were given by s2(α) = (R/2)−1α(1−α) and s2(β) = (R/2)−1β(1−β). We also defined n =R−1∑R
r=1nr and Var(n) = (R−1)−1
∑R
r=1(nr−n)2.
When ρ = 0.3, we observed that the test by (18) with (16)-(17) pro-vides good performances. Especially, the test having η =zβ/(zα+zβ) gave
adequate performances about the target rates, α = 0.05 and β = 0.1. On the other hand, the test having η = 1 satisfied the target rates excessively by taking samples more than needs. When ρ = 0.5, we observed that the test having η =zβ/(zα+zβ) gave error rates a little upper than the target
rates. Note that, for p= 1000, tr(Σ4)/tr(Σ2)2 = 0.094 when ρ= 0.5, while tr(Σ4)/tr(Σ2)2 = 0.011 when ρ = 0.3. The slightly low accuracy may be attributed to a slow convergence in (A-ii) when ρ= 0.5. On the other hand, the test having η = 1 gave good performances even when ρ= 0.5.
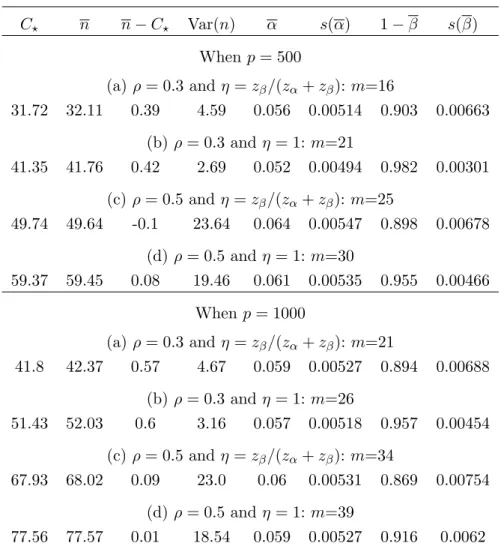
Table 1: Required sample size, and the size and power by (18) with (16)-(17). C⋆ n n−C⋆ Var(n) α s(α) 1−β s(β) Whenp= 500 (a) ρ= 0.3 andη =zβ/(zα+zβ):m=16 31.72 32.11 0.39 4.59 0.056 0.00514 0.903 0.00663 (b)ρ= 0.3 andη = 1:m=21 41.35 41.76 0.42 2.69 0.052 0.00494 0.982 0.00301 (c)ρ= 0.5 and η=zβ/(zα+zβ):m=25 49.74 49.64 -0.1 23.64 0.064 0.00547 0.898 0.00678 (d)ρ= 0.5 andη = 1:m=30 59.37 59.45 0.08 19.46 0.061 0.00535 0.955 0.00466 When p= 1000 (a) ρ= 0.3 andη =zβ/(zα+zβ):m=21 41.8 42.37 0.57 4.67 0.059 0.00527 0.894 0.00688 (b)ρ= 0.3 andη = 1:m=26 51.43 52.03 0.6 3.16 0.057 0.00518 0.957 0.00454 (c)ρ= 0.5 and η=zβ/(zα+zβ):m=34 67.93 68.02 0.09 23.0 0.06 0.00531 0.869 0.00754 (d)ρ= 0.5 andη = 1:m=39 77.56 77.57 0.01 18.54 0.059 0.00527 0.916 0.0062
4. Multiple testing procedures
In this section, we propose multiple testing procedures for high-dimensional data. Suppose we have i.i.d. p+K-variate data vectors,xj(∗)= (xTj, x1j(∗), ...
, xKj(∗))T, j = 1, ..., n, wherexj is defined in Section 1 andK is an integer≥
2. Here, xij(∗) has unknown mean,µi∗, and unknown variance, σi2∗ ∈(0,∞),
for each i (= 1, ..., K). Let θK = (µ1∗, ..., µK∗, σ12∗, ..., σK2∗,µ,Σ). We
de-note the covariance vector between xj and xij(∗) by CovθK(xj, xij(∗)) = σi
(i = 1, ..., K). We denote the correlation coefficient vector between xj and
xij(∗) by CorrθK(xj, xij(∗)) =ρi (i= 1, ..., K). Let xij(∗)=ci∗wij∗+ r ∑ i′=1 cii′wi′j +µi∗, i= 1, ..., K, (19)
where wi′js are defined in (3), and wij∗ (i = 1, ..., K) is a random variable
such that E(wij∗) = 0, E(wij2∗) = 1 and E(wi′jwij∗) = 0 for i′ = 1, ..., r.
Here, ci∗ and cii′s are constants such that c2i∗+
∑r i′=1c 2 ii′ = σ 2 i∗. Note that ∑r
i′=1cii′γi′ =σi. We assume the following assumption forwij∗ as necessary:
(A-v) The fourth moment ofwij∗ is bounded, and wij∗ and wj are
inde-pendent for i= 1, ..., K.
We consider a multiple test of the correlation between xj and xij(∗)s by
H0i :ρi =0 vs. H1i :ρi ̸=0 for i= 1, ..., K. (20)
Our interest is to select a set of significant correlated variables such as D= {i| i ∈ {1, ..., K} such that ρi ̸= 0}. We apply the proposed correlation testing procedure to the multiple test. A test procedure Db maps the data into subsets of {1, ..., K}.
4.1. Multiple test of correlations to control family-wise error rate
We are interested in designing Db such that the family-wise error rate
(FWER) is ≤α, i.e.
PθK(D
Let b Tn,σ(i) = 2un n(n−1) n ∑ j<l (xj −xn(1)(j+l))T(xl−xn(2)(j+l)) ×(xij(∗)−xin(1∗)(j+l))(xil(∗)−xin(2∗)(j+l)) (21) and Sin(∗) = ∑n j=1(xij(∗)−xin(∗)) 2 n−1 , i= 1, ..., K, where xin(1∗)(k) = ∑ j∈Vn(1)(k)xij(∗)/n(1), xin(2∗)(k) = ∑ j∈Vn(2)(k)xij(∗)/n(2), k = 3, ...,2n−1, andxin(∗) = ∑n
j=1xij(∗)/n. Then, from Corollary 2.2, under (A-i), (A-ii) and (A-v), it holds as p→ ∞and n → ∞ that
b Tn,σ(i) Sin(∗) √ 2Wn/n ⇒N(0,1) for i∈Dc.
Here, from Bonferroni’s method, we test the hypotheses (20) by rejecting H0i ⇐⇒ b Tn,σ(i) Sin(∗) √ 2Wn/n > zα/K. (22)
Let Db = {i| i ∈ {1, ..., K} rejecting H0i}. Then, we have as p → ∞ and
n → ∞that
lim supPθK(D
c∩ b
D̸=∅)≤α
under (A-i), (A-ii) and (A-v).
Remark 13. By using the asymptotic p-value given by
Pi = 1−Φ ( b Tn,σ(i) Sin(∗) √ 2Wn/n ) , i= 1, ..., K,
one may apply the Bonferroni-Holm method given by Holm [18] or the false discovery rate (FDR) controlling procedure given by Benjamini and Hochberg [7] and Benjamini and Yekutieli [8].
4.2. Multiple test of correlations to control both FWER and power
We consider a test of (20) having FWER≤α and power
PθK(D⊆Db)≥1−β when min i∈D ||σi||2 σ2 i∗tr(Σ) ≥∆L,
where α ∈ (0,1/2), β ∈ (0,1/2) and ∆L (> 0) are prespecified constants.
We assume ∆L = o{
√
tr(Σ2)/tr(Σ)} and lim infp→∞p∆L > 0. Then, we
propose a two-stage test procedure based on the following two steps:
1. Choosem(≥4) satisfying (16). Take pilot samplesxj(∗)= (xTj, x1j(∗), ...
, xKj(∗))T, j = 1, ..., m. Then, calculate Sm and Wm according to (4) and
(9). Define the total sample size by
N = max { m, ⌈(zα/K +zβ/K) ∆Ltr(Sm) √ 2Wm+ 2η(zα/K+zβ/K)2 ⌉} , (23)
where η∈[0,1] is a chosen constant. See Remark 14 for a choice of η. 2. If N = m, do not take any additional samples. If N > m, take additional samples, xj(∗), j =m+ 1, ..., N. By combining the initial samples and the additional samples, calculate SN, SiN(∗) and TbN,σ(i), i = 1, ..., K, according to (4) and (21). Then, test the hypotheses (20) by
rejecting H0i ⇐⇒TbN,σ(i)>
{1−2η(zα/K +zβ/K)2/N}SiN(∗)tr(SN)∆Lzα/K
zα/K +zβ/K
.
(24) Then, we have the following theorem.
Theorem 4.1. Under (A-i), (A-ii) and (A-v), the test by (24) with (23) has that (i) lim sup p→∞ PθK(D c∩Db ̸=∅)≤α; (ii) lim inf p→∞ PθK(D ⊆ b D)≥1−β when min i∈D ||σi||2 σ2 i∗tr(Σ) ≥∆L.
Remark 14. Note that N/p = op(1) under (A-i) and (A-ii) from the facts
that lim infp→∞p∆L >0 and (A.5) in Appendix. From Remark 9, one may
define η as η=zβ/K/(zα/K +zβ/K).
5. Data analysis
In this section, we demonstrate how the test procedures perform in actual data analyses by using two microarray data sets.
5.1. T-cell acute lymphoblastic leukemia
We analyzed gene expression data of T-cell acute lymphoblastic leukemia (T-ALL) given by Chiaretti et al. [10] in which the data set consists of 12625 genes and 33 (= n) samples. Note that the expression measures were obtained by using the three-step robust multichip average (RMA) prepro-cessing method. Refer to Pollard et al. [23] as well for the details.
Chiaretti et al. [10] identified 3 predictive genes, TTK, AHNAK and
CD2, to distinguish the patients according to disease outcomes. On the other hand, Gottardo et al. [15] identified 3 predictive genes,NOTCH2,BTG3and
CFLAR. We denoted these 6 predictive genes, (T T K, AHN AK, CD2, N OT CH2, BT G3, CF LAR), by xij(∗), i = 1, ..., K(= 6). We denoted the remaining 12619 (= p) genes by xj. We considered a multiple testing to see
whether the predictive genes have a significant influence of the other genes’ expression or not. Let α = 0.05. Our goal was to find variables i’s having
ρi ̸=0 with respect to FWER given by
PθK(D
c∩Db ̸=∅)≤0.05.
We applied the multiple test given by (22). According to (21), we cal-culated Tbn,σ(1) = 170.92 (T T K), Tbn,σ(2) = 60.33 (AHN AK), Tbn,σ(3) = 44.74 (CD2), Tbn,σ(4) = 1.03 (N OT CH2), Tbn,σ(5) = 14.24 (BT G3) and
b
Tn,σ(6) = 5.24 (CF LAR) by using the data set with n = 33. With the help of the multiple test given by (22) with zα/K = 2.394, we selected a set of
significant genes by
b
D ={1,2,3,6},
guaranteeing the FWER. The selected 4 genes were (T T K, AHN AK, CD2, CF LAR). We observed that three predictive genes given by Chiaretti et al. [10] and one predictive gene given by Gottardo et al. [15] have a significant influence of the other genes’ expression. On the other hand, the remaining two predictive genes given by Gottardo et al. were considered to be unrelated to the other genes’ expression. Those 2 predictive genes, (N OT CH2, BT G3), may distinguish the patients according to disease outcomes without a influ-ence of the other genes’ expression.
5.2. Arabidopsis thaliana
We analyzed gene expression data of Arabidopsis thaliana given by Wille et al. [27] in which the data set consists of 118 samples having 39 (= K)
isoprenoid genes and 795 (= p) additional genes. All data were logarithmic transformed and denoted by xij(∗), i = 1, ..., K, for the isoprenoid genes and byxj for the additional genes. Wille et al. [27] considered a genetic network
between the two gene sets. We considered a multiple testing to select a significant set of associated genes from among isoprenoid genes. Specifically, we were interested in finding the interplay between xj and each xij(∗). Let
α = 0.05, β = 0.1 and ∆L = 0.1. Our goal was to find variables i’s having
ρi ̸=0 with FWER given by PθK(D
c∩ b
D ̸= ∅)≤ 0.05 and power given by
PθK(D ⊆ Db)≥ 0.9 when mini∈D||σi||
2/{σ2
i∗tr(Σ)} ≥0.1. We applied the
two-stage test procedure given by (24) with (23) to the inference. We set
η = zβ/39/(zα/39+zβ/39) from Remark 14. From Remark 11, we calculated the pilot sample size as
m= max { 4, ⌈(zα/39+zβ/39)√2 0.1√p + 2zβ/39(zα/39+zβ/39) ⌉} = 36.
So, we took the first 36 samples as a pilot sample. We calculated tr(Sm) =
440 andWm = 13935 according to (4) and (9), respectively. Then, from (23),
we had the total sample size as
N = max { m, ⌈(z α/39+zβ/39) √ 2 0.1×440 √ 13935 + 2zβ/39(zα/39+zβ/39) ⌉} = 55.
Thus we took the next 19 (= 55−36) samples. Then, we calculated TbN,σ(i),
SN andSiN(∗),i= 1, ...,39, according to (4) and (21). By using the multiple test given by (24), we selected a set of significant genes by
b
D={1, ...,39} \ {6,7,13,14,15,16,17,20},
guaranteeing both the FWER and the power. Thus we selected 31 isoprenoid genes. We considered a high-dimensional linear regression model:
Y =XΥ+E,
where Y is an n×p response matrix, X is an n×K′ fixed design matrix, and Υ is a K′ ×p parameter matrix. The n rows of E are independent and identically distributed as ap-variate distribution with mean vector zero. When K′ = 2, see Remark 8. Let xj(1∗), ..., xj(31∗), be the jth sample of the 31 selected isoprenoid genes in Db. Let x(j) = (1, xj(1∗), ..., xj(31∗))T,
j = 1, ..., n. We setY = [x1, ...,xn]T andX = [x(1), ...,x(n)]T with K′ = 32. We noted that the standard elements of Υ are path coefficients from the isoprenoid genes to the additional genes. By using the observed samples of size n = 55 as a training data set, we obtained the least squared estimator of Υ by Υb = (XTX)−1XT
Y. We investigated prediction accuracy of the regression with Υb by using the remaining samples of size 63 (= 118−55) as a test data set. We denoted the test samples by xj(i∗) (i= 1, ...,31) and xj,
j = 56, ...,118. We considered the prediction mean squared error (PMSE) by E(||xj − Υb
T
x(j)||2|Υb). By using the test samples xj(i∗) (i = 1, ...,31) and xj, j = 56, ...,118, we applied the bias-corrected and accelerated (BCa)
bootstrap by Efron [12]. Then, we constructed 95% confidence interval (CI) of the PMSE by [704.2,955.5] from 10000 replications. We also calculated the sample mean of the PMSE by 809.5.
On the other hand, we considered the PMSE for the full isoprenoid genes by E(||xj−Υb
T
fxf(j)||2|Υbf), where Υbf = (XTfXf)−1XTfY with Xf =
[xf(1), ...,xf(55)]T and xf(j) = (1, x1j(∗), ..., x39j(∗))T, j = 1, ...,55. Then, sim-ilarly to above, we constructed 95% CI of the PMSE by [897.9,1217.8]. We also calculated the sample mean of the PMSE by 1033.4. The PMSE of the selected isoprenoid genes in Db is probably smaller than that of the full isoprenoid genes. We conclude that the multiple test procedure effectively works for selecting a set of significant genes.
Appendix A.
Throughout, we write that x0j = xj − µ, x0j(∗) = xj(∗) − µ∗, y0j =
∑r
i̸=i′ciγi′wijwi′j +c∗
∑r
i=1γiwijwj∗ for each j, κ = σ2∗tr(Σ)∆L and A =
σ∗2Σ+σσT − 2∑ri=1ci2γiγTi . Note that Varθ(y0j) = A under (A-i) and
(A-iii).
Lemma A.1. Assume (A-i) to (A-iii). Then, we have as p → ∞ and
n → ∞ that Varθ(Tbn,σ) = (2σ4 ∗tr(Σ2) n2 + 4 n { σ∗2σTΣσ+||σ||4+ r ∑ i=1 (Mi −2)c2i(σ T γi)2}){1 +o(1)}; b Tn,σ− ||σ||2 = 2 n(n−1) n ∑ i<j yT0iy0j +op { Varθ(Tbn,σ)1/2 } under (A-iv).