Identifying Communicator Roles in Twitter
Ramine Tinati, Leslie Carr, Wendy Hall
Electronics and Computer Science University of Southampton
Southampton
{rt506, lac, wh}@ecs.soton.ac.uk
Jonny Bentwood
Edelman Ltd Victoria Street, SouthsideLondon
[email protected]
ABSTRACT
Twitter has redefined the way social activities can be coordinated; used for mobilizing people during natural disasters, studying health epidemics, and recently, as a communication platform during social and political change. As a large scale system, the volume of data transmitted per day presents Twitter users with a problem: how can valuable content be distilled from the back chatter, how can the providers of valuable information be promoted, and ultimately how can influential individuals be identified?
To tackle this, we have developed a model based upon the Twitter message exchange which enables us to analyze conversations around specific topics and identify key players in a conversation. A working implementation of the model helps categorize Twitter users by specific roles based on their dynamic communication behavior rather than an analysis of their static friendship network. This provides a method of identifying users who are potentially producers or distributers of valuable knowledge.
Categories and Subject Descriptors
H.1.1 [Systems and Information Theory]: Value of information H.3.1 [Information Search and Retrieval]: Information Search and Retrieval – information filtering
General Terms
Algorithms, Design, Experimentation, Measurement, Theory
Keywords
Twitter, User Classification, Influence, Web Science
1.
INTRODUCTION
In recent years, microblogging, popularized by Twitter, has rapidly become an extremely important medium for disseminating information at an astonishing rate. The Twitter service handles 1 billion tweets weekly and gains 500,000 new members per month [1]. This giant information resource has shown to be useful for many things: event detection [2], event summarizing [3], identifying public health issues [4], and recently as a means to aid political uprising [5].
As with any large amount of data, not all of it is useful or important, a recent analysis has shown that 40% of tweets can be classified as useless or white noise [6], and although various
attempts have been made to detect spam [7], [8], identifying useful information is still a difficult task. Taking this into consideration, how can important information be distilled from the rest? How can the users that are producing valuable content be identified? Can we develop a model to help classify different types of users on Twitter to help discriminate the significant information from the background activity?
In this paper we describe a new approach to classifying users within the Twitter service by working with Edelman, a professional public relations (PR) business. We first examine the communication model that underpins Twitter, unpacking its functionality and use. Existing literature which concerns the classification of Twitter is then discussed and used to present the
topology of influence (TOI), a model to identify different communicator roles in Twitter, based on Edelman’s professional experiences within the PR industry. Finally, we develop a tool, ReFluence, which incorporates the TOI to model and visualize the classification of different user types within a Twitter conversation. Using a number of harvested Twitter datasets based upon different conversation topics, an investigation was conducted to validate the different Twitter user roles in the topology of influence and also to analysis the structure of the datasets retweet networks.
2.
TWITTER INTERACTION MODEL
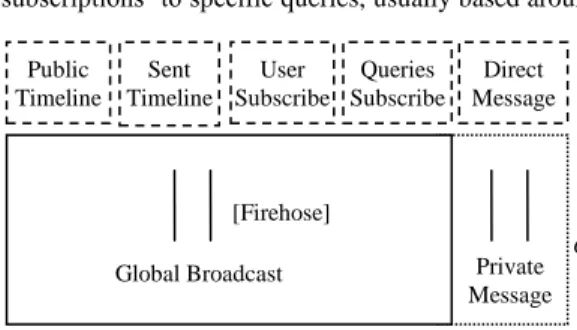
Twitter, formally classified as a microblogging service, combines elements of social networking and blogging [9] to enable registered users to share 140 character messages (known as ‘tweets’ to the users but ‘statuses’ to developers) with each other. Irrespective of the actual implementation of the Twitter servers, the user model offered to Twitter subscribers is based on the concept of a timeline (i.e. a chronologically ordered stream) of tweets. As Fig. 1 shows, each user has a timeline of tweets that they have created, and a timeline of tweets that are created by a multitude of other users whom they ‘follow’. Finally there is the public timeline (also known as ‘the firehose’) which consists of all public tweets sent by all users. (Direct messages are private messages sent from one user to another and do not figure in the public timeline). As well as subscribing to other users’ tweets (by following those users) client applications may offer ‘subscriptions’ to specific queries, usually based around a specific
Copyright is held by the International World Wide Web Conference Committee (IW3C2). Distribution of these papers is limited to classroom use, and personal use by others.
WWW 2012 Companion, April 16–20, 2012, Lyon, France. ACM 978-1-4503-1230-1/12/04. [Firehose] Global Broadcast Public Timeline Sent Timeline Queries Subscribe User Subscribe
Figure 1 Twitter Data Architecture
User Features Twitter Data Communication channel Private Message Direct Message
hashtag – the combination of a hash (#) and a keyword – which represents a topic of interest.
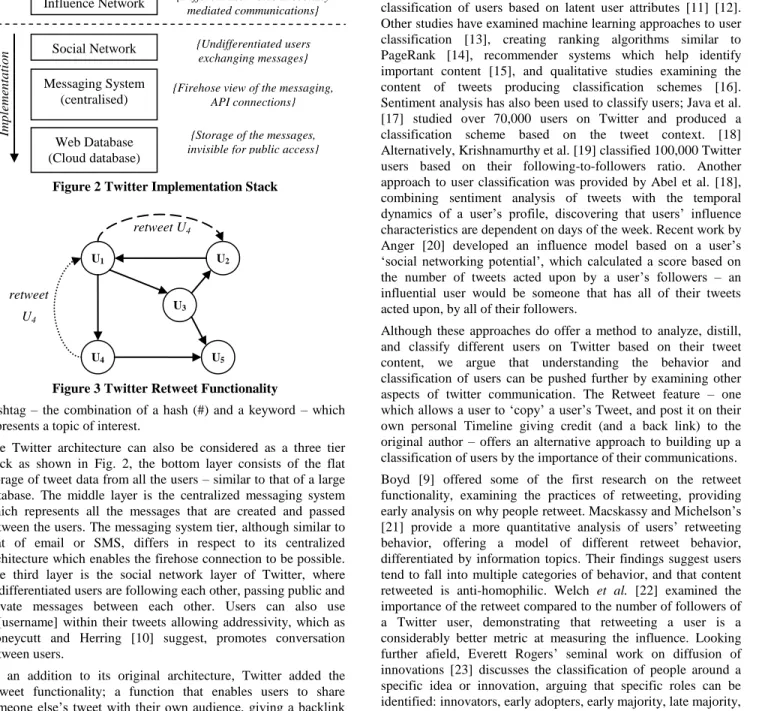
The Twitter architecture can also be considered as a three tier stack as shown in Fig. 2, the bottom layer consists of the flat storage of tweet data from all the users – similar to that of a large database. The middle layer is the centralized messaging system which represents all the messages that are created and passed between the users. The messaging system tier, although similar to that of email or SMS, differs in respect to its centralized architecture which enables the firehose connection to be possible. The third layer is the social network layer of Twitter, where undifferentiated users are following each other, passing public and private messages between each other. Users can also use @[username] within their tweets allowing addressivity, which as Honeycutt and Herring [10] suggest, promotes conversation between users.
As an addition to its original architecture, Twitter added the retweet functionality; a function that enables users to share someone else’s tweet with their own audience, giving a backlink to the original author. This is demonstrated in Fig. 3, U1 follows
U4 and U1 is also followed by U2. When U1 retweets a tweet from
U4 this tweet can now be seen by U2, even though they are not
linked to each other.
The work undertaken in this paper is best described as another layer on the Twitter architecture stack. As Fig 2 shows, sitting above the social network layer lays the influence network layer, which takes the undifferentiated users that are exchanging messages and models different user roles within socially mediated communications. This layer provides a method to classify users into specific categories based on the communications between users.
3.
RELATED WORK
There is a growing body of literature related to Twitter research, including studies involving sentiment analysis of tweet content
and additional meta data, providing ranking mechanisms and classification of users based on latent user attributes [11] [12]. Other studies have examined machine learning approaches to user classification [13], creating ranking algorithms similar to PageRank [14], recommender systems which help identify important content [15], and qualitative studies examining the content of tweets producing classification schemes [16]. Sentiment analysis has also been used to classify users; Java et al. [17] studied over 70,000 users on Twitter and produced a classification scheme based on the tweet context. [18] Alternatively, Krishnamurthy et al. [19] classified 100,000 Twitter users based on their following-to-followers ratio. Another approach to user classification was provided by Abel et al. [18], combining sentiment analysis of tweets with the temporal dynamics of a user’s profile, discovering that users’ influence characteristics are dependent on days of the week. Recent work by Anger [20] developed an influence model based on a user’s ‘social networking potential’, which calculated a score based on the number of tweets acted upon by a user’s followers – an influential user would be someone that has all of their tweets acted upon, by all of their followers.
Although these approaches do offer a method to analyze, distill, and classify different users on Twitter based on their tweet content, we argue that understanding the behavior and classification of users can be pushed further by examining other aspects of twitter communication. The Retweet feature – one which allows a user to ‘copy’ a user’s Tweet, and post it on their own personal Timeline giving credit (and a back link) to the original author – offers an alternative approach to building up a classification of users by the importance of their communications. Boyd [9] offered some of the first research on the retweet functionality, examining the practices of retweeting, providing early analysis on why people retweet. Macskassy and Michelson’s [21] provide a more quantitative analysis of users’ retweeting behavior, offering a model of different retweet behavior, differentiated by information topics. Their findings suggest users tend to fall into multiple categories of behavior, and that content retweeted is anti-homophilic. Welch et al. [22] examined the importance of the retweet compared to the number of followers of a Twitter user, demonstrating that retweeting a user is a considerably better metric at measuring the influence. Looking further afield, Everett Rogers’ seminal work on diffusion of innovations [23] discusses the classification of people around a specific idea or innovation, arguing that specific roles can be identified: innovators, early adopters, early majority, late majority, and laggards. Furthermore, Rogers identified that these roles had unique characteristics and potentially fall into more than one category. Recent work investigating the diffusion of innovation and Twitter includes Chang’s [24] study of how diffusion theory helps support and explain how hashtags are created and adopted by the masses.
3.1
User Classification – The Topology of
Influence
In this section we discuss how the work of Edelman’s topology of influence (TOI) provided the ground work for a novel classification model to be produced. Edelman, a global public relations firm, has had many years’ experience with media and social advertising. The TOI, originally conceptualized as ‘distributed influence’ [25] is a five category scheme, which has been developed based on their insight into social and psychological behavior and how this fits in to the communication Social Network Messaging System (centralised) Web Database (Cloud database) Imp lem en ta ti o
n {Undifferentiated users exchanging messages}
{Firehose view of the messaging, API connections} Influence Network {Different user roles in socially
mediated communications}
{Storage of the messages, invisible for public access}
Figure 2 Twitter Implementation Stack
U1 U2
U3
U4 U5
Figure 3 Twitter Retweet Functionality retweet U4
retweet U4
channel that Twitter provides. As Edelman argues, the traditional categories of influential people in an offline environment often correspond to a number of social factors such as authority, wealth or celebrity status. However the Web is now offering a new platform where anybody with the right publishing tools have equal opportunity to have influence, engage in conversation and have a viewpoint – regardless of social status, profession, or location [26].
These categories are not mutually exclusive, as often the categorization of users’ behavior falls under multiple categories. These categories are also not expected to be represented by the same proportions of people to be equally common; idea starters and amplifiers will be much rarer than commentators and viewers for instance.
3.1.1
Idea Starter
These can be considered as an individual who starts a conversational meme. They tend to be highly engaged with the media, in the on- and off-line environment. They utilize multiple sources of social media, but have an intricate network of trusted relationships, especially online. As a result of this, their network of connections is usually limited, but this ensures that the connections are of high quality
Although Idea Starters may not be the one with the ‘bright idea’, they are the ones which start the conversation, and due to its trusted connections, are in a fertile environment for the idea to grow.
3.1.2
Amplifier
These can be considered as an individual who collates multiple thoughts and shares ideas and opinions. Amplifiers thrive off sharing opinions of others; enjoy being the first to do so. They have a large network of connections and are trusted within their community. Although they do not synthesis the information being shared, they tend to be the firehose of knowledge.
Amplifiers tend to be the individuals that are part of small trusted network of certain idea starters, taking their original ideas and sharing them to a larger, more visible audience. Due to this process, there is the risk that idea starters will slowly become amplifiers over time due to increased exposure.
3.1.3
Curator
These can be considered as an individual who use a broader context to define ideas. Curators tend to offer a level of transparency beyond that of Idea Starters and Amplifiers. By following the conversation path, they have an impact on the way the conversation is shaped and spread. They take the ideas of the idea starters and the amplifiers and either validate, question, challenge, or dismiss them. They are the ties that form between the Idea Starters and Amplifiers, aggregating the ideas together to help clarify and steer the topic of conversation.
Curators are connected to a large audience, and often pick up information outside their primary community of interest – tailoring the information to suit their networks circle of interest.
3.1.4
Commentator
These can be considered as an individual who detail and refine ideas. Commentators add to or adapt the flow of conversation, adding in their own opinions, insights, but without becoming too immersed in the conversation. Unlike the other categories described so far, Commentators do not seek recognition of their leadership, or want to increase their status; they are taking part in
something to which they strongly feel about. They want to share the conversation not for self-benefit.
3.1.5
Viewer
These can be considered as an individual who takes passive interest in the conversation. These are the connections in the network which are only connected due to their footprint left by viewing rather than contributing to the conversation. However, even though they are not active, they still are reflected in the TOI; while Viewers do not share or create information online, they consume large amounts of information and share it with their offline network.
3.2
Tweet Level
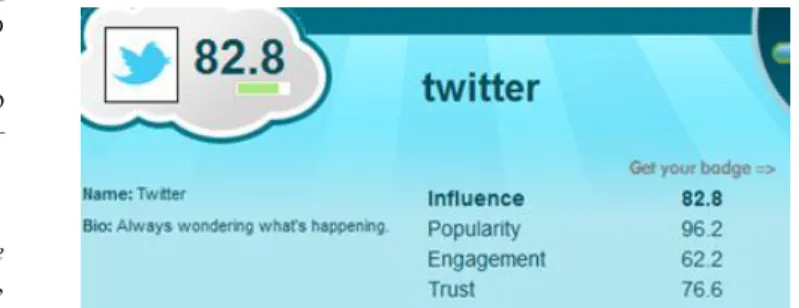
Based on this work Edelman has produced ‘Tweet Level’1, a Twitter influence measurement tool which offers end-users to calculate an influence score based on a number of variables including past tweet history, circles of interest involved in, and number of friends, followers and retweeters. As Fig 4 illustrates, a score of influence, popularity, engagement and trust is produced for each individual Twitter user; based on this an overall ranking table is be produced, informing users who are the most influential Twitter users regarding different areas of interest.
The individual score breakdown for each user created by Tweet Level has some cross over with the different categories within the TOI. Edelman found that people that fall into the group of idea starters tend to have a high level of influence, but a lower level of popularity. Amplifiers however often have very high levels of popularity and trust, but with an increasing growth in popularity, free time to keep personal relations become less and their engagement decreases.
4.
MODELLING AND IMPLEMENTING
THE TOPOLOGY OF INFLUENCE
Building upon the ideas of Edelman’s TOI, in order to develop and build a working model which represents the classification of different users within a given network, a system was developed which utilizes Twitter’s communications, specifically retweet messages. Twitter officially defines the retweet functionality as: “A Tweet by another user, forwarded to you by someone you follow. Often used to spread news or share valuable findings on Twitter”
The retweet function is operated by the user clicking a “Retweet Button”, which then creates an underlying directed link: from the original tweeter to the user that retweeted. This provides a method to track the path of messages between members, and more importantly, help us build a model based on the classifications within the TOI.
1
http://tweetlevel.com/
4.1
Building on the Retweet Mechanism
The model developed to represent the TOI has been based upon the retweet functionality of the Twitter architecture. The topology’s classification of different people is based on their role of sharing, amplifying, and curating within a given network. This presents three dimensions: the information being exchanged, the domain of the information, and the timeline that the conversation is expanding over.
The retweet function provides the building blocks for the information being shared, defined by the retweets that pass between different users, potentially providing a larger audience for the original user who made the tweet.
The hashtag (#) functionality – a way of ‘labeling’ or ‘tagging’ a tweet – within the Twitter architecture also presents a way to identify or search for specific tweets, especially important with the volume incoming per day.
Finally, the tracking of the conversation flow is also catered for by Twitter, which offers a temporal view of the tweets created as each are marked with their own timestamp.
4.2
Data Source
The initial step to determining how the TOI can be modeled is based upon the data that can be harvested from Twitter. Based on the specification presented above, the Twitter data collected requires metadata surrounding each tweet including a unique tweet ID and timestamp, and must be restricted to a conversation topic denoted by a corresponding ‘#hashtag’ within each tweet. As a solution to harvesting the required data, a custom designed plugin was developed for the EPrints2 system. This plugin harvests over a given time period tweets which have been marked with a specific hashtag, collecting the required metadata fields, importantly, the timestamp and retweet link information.
4.3
Systems Architecture
Based upon the concepts provided by the TOI and the available data, the temporal growth of a Twitter conversation has been modeled (restricted by the chosen hashtag), mapping the relationship between different users who retweet each other. By feeding in data which has been collected over a given timeframe, the growth of the conversation based on the retweets made between users enables identification of the different hierarchies of users such as idea starters, amplifiers and curators.
As illustrated in Fig. 5 the main structure of the data model involves building up a node and edge representation of each of the tweets found within the harvested data. As each tweet has been made by a unique user, each of the users (nodes) can be used to construct an edge, which models the user who retweeted (source) and the original user who made the tweet (target) – mimicking the architecture of Twitters retweet function. As the tweet text information is also being harvested, this is also assigned to an edge, thus not only representing the link between the source and the target, but also the content that is being retweeted.
Including the tweet information for each of the edges is important for tracking the conversation flow within the harvested data. As the model is interested in finding the flow of conversation (which in this case, is the retweet flow), the model requires a method to construct a record of retweets. By modeling the growth of a
2
http://bazaar.eprints.org/161 - created by Adam Field
retweet over the entire timescale, (Fig. 6) a chain of retweets is constructed. Calculating the length of a retweet chain and who the original user to retweet is, identifies different user types. Based on these principles, the classification of the different user types can be made clearer.
Within this model, it was chosen to represent an idea starter as someone who has their tweets retweeted by a large number of people – thus suggesting that their ideas are of value to share. An idea starter is calculated by finding the sum of all the retweets of a user divided by the minimum retweet number, if this is greater than one, then they are classified as an idea starter.
The amplifier, based on the topology, is a user who is the initial person to retweet a tweet – one which is part of a retweet chain. Furthermore, we can help identify more influential amplifiers by the number of times that they are the original retweeter. An amplifier is calculated by finding the sum of all the users tweets divided by the number of tweets which are retweets multiplied by the number of tweets which are first in a chain of retweets. A curator, as defined by the topology, is an individual who brings together conversations. As we are limited to the conversation path of the retweet function, this model represents curators as users who retweet two or more idea starters, thus acting as a point of aggregation for their own network. A curator is calculated by finding the sum of all the users tweets which are retweets divided
Figure 5 Data Model Overview
Tweet User Retweet Edge Source or Target Contains Tweet information Makes a Tweet Original Tweet [User and Timestamp] Time Retweet Tweet
Retweet Tweet [User and Timestamp]
Figure 6 Retweet Chain
Where Urt is number of retweets of a user and
RTmin is minimum retweet number
Definition 1 Calculating an Idea Starter
Where Ut is number of user’s tweets, RTu is number of user’s retweets, and RTorig
is number of retweets which were first in retweet chain
Definition 2 Calculating an Amplifier
Where RTu is number of a user retweets and UuniqRT is
number of unique number of users that a user has retweeted.
by the number of users (which are idea starters themselves) that the user has retweeted from.
Finally commentators have been modeled as users who do not meet the above requirements, but have actively retweeted within the harvested data.
As this model only considers active users within the harvested data, viewers will not be represented by this model. The classification of the different users within the model will be based on a single factor which is controlled by the operator – the number of retweets a user needs to be classified as an idea starter. This in turn affects the users represented as amplifiers and curators. The aim of having a variable which enables the overall structure of the graph to change offers a way to explore the classification of users based on the minimum number of retweets needed to be an idea starter.
4.4
Visualizing the Model
As a way to represent the visual growth of the Twitter network based on the timeline of tweets collected, a front end GUI was designed. This provides a visualization of the growth of the retweets, helping visually identify the different classification of user types.
Using the JUNG3 software library available for Java provides a suitable method of taking the retweet edges data model, and presenting them in a way which visualizes the growth of the conversation.
Based on the functionality of the model, it is also possible to simulate and visualize the statistics of the proportions between different user classification types based on minimum number of retweets needed to be an idea starter. By adjusting the number of minimum retweets needed, the percentage split between user types can be produced. This is performed by simulating the edge list for each minimum Retweet value, within a given range, and then at each step, plotting the corresponding proportion of communicator types to the minimum Retweet value, illustrated in Fig. 7.
4.5
A Working Topology of Influence Model
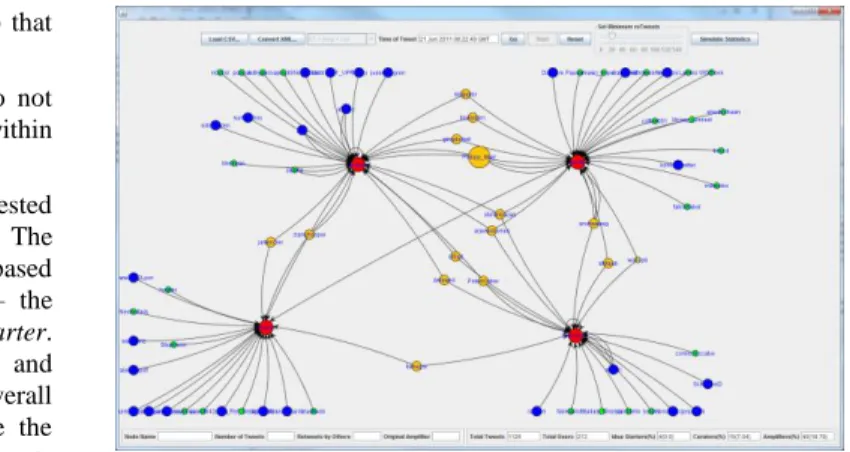
Based upon the architectural choice discussed in section 3, ReFluence was created. It provides a statistical and analytical tool for use of harvested Twitter data surrounding a chosen hashtag. The main interface (Fig. 8) presents an updating graph of the retweet messages found within the harvested Twitter data. A timeline of retweet messages between users is drawn, presenting the user with a demonstration of the retweet conversation growth, at any point during this playback of events it can be paused, allowing the user to find additional information about a chosen node. The user is also presented with a slider, which sets the
3
http://jung.sourceforge.net/
minimum of retweets needed to be classified as an idea starter
(which are identifiable by being a red node). Yellow nodes indicate a user is a curator (a user that connects two more idea starters together), and blue nodes are amplifiers (those that were first to retweet a chain of retweets). Orange nodes however indicate users that are not only curators, but amplifiers as well, these are people that are first to retweet, and also are the links between idea starters. The remaining green nodes are
commentators, the users who do not fit into any of the other groups. The scale of the Red and Orange or Blue nodes are an indication on the users ranking within their category, for instance, a large Red node would indicate a user with a high level of retweets, proportionally more than the minimum level set. A large Orange or Blue node indicates that the user has been an original retweeter proportionally more times than others.
5.
DATASET ANALYSIS
To access the validity of the Twitter user roles, the initial implementation of ReFluence has been developed to identify idea starters within the retweet network graph. In order to evaluate whether the role of an idea starter within the user classification model is valid, a comparative analysis of a number of harvested datasets (Table 1) was performed. These datasets varied in size and topic in order to remove the possibility of bias. The analysis examined the distribution of users compared to the number of retweets obtained, beginning at 1 retweet to n retweets, where no users had n amount of retweets.
Table 1 Harvested Twitter Data
Dataset Tweets Retweets Users
#twilight 529530 139441 336446 #DrWho 709093 204301 104688 #SOPA 1004482 438894 485692 #Occupy 41568 16673 29025 #OccupyLondon 19128 9834 7548 #Nov9 12831 7188 4737 #Nov30 22054 14243 12330 #UCDavis 7950 3895 4523
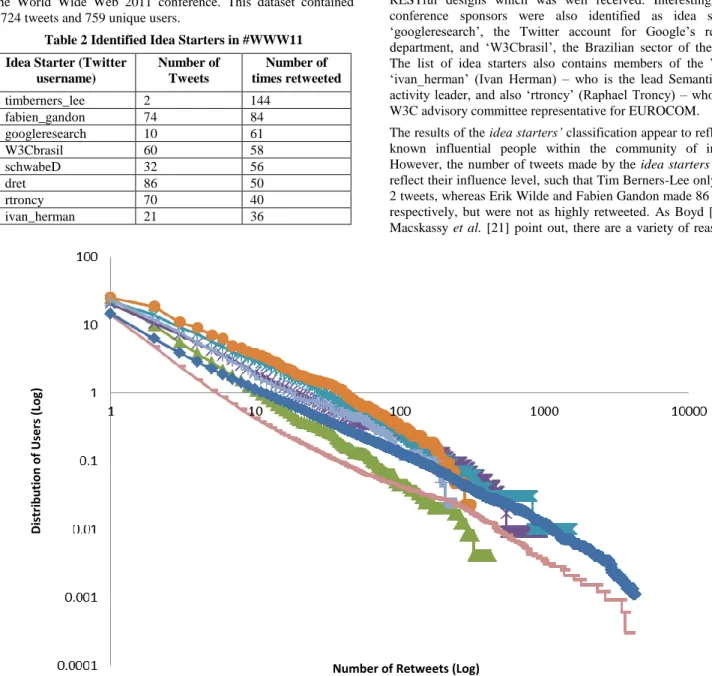
Figure 9 shows the number of users who have been retweeted n
times, plotted on a log/log scale. Interestingly, although the datasets vary considerably in size, locality and topic (entertainment and activism), there exist similarities between the distribution of users that have n retweets. This finding has provided evidence to support the claim that there exist common properties in Twitter’s retweet network that provides a metric for
Edge List List of Edges
(based on min retweet number) List of Edges
(nodes by ref)
Animated Graph Edge Statistics
Statistics Graph A List of ‘List of Edge’ (within a given retweet number range)
Figure 7 Visualizing the Model
identifying certain user roles, which in terms of the TOI relates to the role of the idea starter.
The analysis has also revealed that the distribution of users based on the number of retweets forms a power law, similar to other Web phenomena such as the World Wide Web; exhibiting scale-free properties such as preferential attachment and growth. Preferential attachment – well-connected nodes will continue to gain more connections – may be a result of a user’s behavior towards retweeting users who already have a large number of retweets.
To further investigate the user classification model, we compare the users which have been identified to have knowledge about the dataset topic. For demonstration purposes, the #WWW11 hashtag has been used, which represents the Twitter conversation feed for the World Wide Web 2011 conference. This dataset contained 2724 tweets and 759 unique users.
Table 2 Identified Idea Starters in #WWW11 Idea Starter (Twitter
username) Number of Tweets Number of times retweeted timberners_lee 2 144 fabien_gandon 74 84 googleresearch 10 61 W3Cbrasil 60 58 schwabeD 32 56 dret 86 50 rtroncy 70 40 ivan_herman 21 36
Using a minimum retweet value of 20, 8 idea starters were identified which are shown in Table 2. Examining the list of identified idea starters in Table 3, the identified Twitter usernames represent a collection of well-respected scholars and industry sponsors of the conference. The Twitter user with the highest number of retweets is ‘timberners_lee’, the Twitter account for Tim Berners-Lee – responsible for the invention of the Web – who gave a keynote speech at the conference, and also the Twitter account of Fabien Gandon, a member of the conference program committee. ‘schwabeD’ – the Twitter username for Daniel Schwabe – is also another influential scholar within this academic area, with past publications in previous years of the World Wide Web conference. Erik Wilde, represented by the Twitter username ‘dret’ is also a well-respected member of the WWW community and during the WWW2011 conference ran a workshop on RESTful designs which was well received. Interestingly, the conference sponsors were also identified as idea starters, ‘googleresearch’, the Twitter account for Google’s research department, and ‘W3Cbrasil’, the Brazilian sector of the W3C. The list of idea starters also contains members of the W3C - ‘ivan_herman’ (Ivan Herman) – who is the lead Semantic Web activity leader, and also ‘rtroncy’ (Raphael Troncy) – who is the W3C advisory committee representative for EUROCOM. The results of the idea starters’ classification appear to reflect the known influential people within the community of interest. However, the number of tweets made by the idea starters do not reflect their influence level, such that Tim Berners-Lee only made 2 tweets, whereas Erik Wilde and Fabien Gandon made 86 and 74 respectively, but were not as highly retweeted. As Boyd [9] and Macskassy et al. [21] point out, there are a variety of reasons to
Number of Retweets (Log)
D istr ib u ti o n o f Use rs ( Lo g)
why retweeting is performed, including for gain or self-promotion, arguably the reasons why Tim Berners-Lee was retweeted to such an extent.
6.
CONCLUDING REMARKS
The Twitter social network offers its users the ability to create and share ideas on a platform which does not favor or distinguish individuals. In this paper we have taken this platform and applied our model based on Edelman’s topology of influence to create a network where the interactions between users determine their status and influence against each other.
The analysis performed has revealed a number of interesting findings: users can be classified by examining the number of retweets a user has obtained, supporting Welch et al. [22]claim that retweet can be used as a metric for determining influence, and also Twitter exhibits scale-free properties similar to other networks such as the World Wide Web.
Furthermore, we have shown that comparing the findings of the classification into real-world context reveals individuals who are key stakeholders within the specific domain (i.e. Tim Berners-Lee within the WWW conference).
The implications of this research supplement the current understanding of different user behavior that underpins social networking sites such as Twitter. It also provides businesses, such as Edelman, with tools to improve the efficiency of marketing products and obtaining the right contacts, thus reducing overall costs incurred. Furthermore, the classification of users goes beyond microblogging social networks such as Twitter; recent developments of Google’s own social networking Website Google+ has enabled users to find globally popular user generated content, and also monitor how posts get shared between users, a feature known as ‘Ripples’[27].
Future work will require the refinement of user classification, including examining the granularity to which users are categorized, including the analysis of other user roles in the TOI, including curators and amplifiers. Also a larger number of datasets will need to be collected to examine the extent to which the scale-free properties of Twitter can help determine the classification of users.
7.
ACKNOWLEDGEMENT
This research was funded by the Research Councils UK Digital Economy Programme, Web Science Doctoral Training Centre, EP/G036926/1.
8.
REFERENCES
[1] Twitter, “Twitter Blog: #numbers,” 2011. [Online]. Available: http://blog.twitter.com/2011/03/numbers.html. [Accessed: 01-Oct-2011].
[2] J. Weng and B.-sung Lee, “Event Detection in Twitter,” in
Proceedings of the Fifth International AAAI Conference on Weblogs and Social Media, 2011.
[3] D. Chakrabarti and K. Punera, “Event Summarization Using Tweets,” in Proceedings of the Fifth International AAAI Conference on Weblogs and Social Media, 2011, pp. 66-73. [4] M. J. Paul and M. Dredze, “You Are What You Tweet:
Analyzing Twitter for Public Health,” Artificial Intelligence, pp. 265-272, 2011.
[5] J. Park and W. Lee, “Revolution 2.0 in Tunisia and Egypt: Reactions and sentiments in the online world,” in
Proceedings of the Fifth International AAAI Conference on Weblogs and Social Media, 2011, vol. 1.
[6] Pear Analytics, “Twitter Study – August 2009,” 2009. [7] Z. Chu, S. Gianvecchio, and H. Wang, “Who is Tweeting on
Twitter: Human, Bot, or Cyborg?,” in Proceedings of the 26th Annual Computer Security Applications Conference, 2010, pp. 21-30.
[8] S. Yardi, D. Romero, G. Schoenebeck, and D. Boyd, “Detecting spam in a twitter network,” First Monday, vol. 15, no. 1, 2010.
[9] D. Boyd, S. Golder, and G. Lotan, “Tweet, Tweet, Retweet: Conversational Aspects of Retweeting on Twitter,” in
HICSS-43, 2010.
[10] C. Honeycutt and S. C. Herring, “Beyond Microblogging: Conversation and Collaboration via Twitter,” in 42nd Hawaii International Conference on System Sciences, 2009, vol. 0, pp. 1-10.
[11] D. Rao, D. Yarowsky, A. Shreevats, and M. Gupta, “Classifying Latent User Attributes in Twitter,” in
Proceedings of the 2nd international workshop on Search and mining user-generated, 2010.
[12] D. Kim, Y. Jo, I.-C. Moon, and A. Oh, “Analysis of Twitter Lists as a Potential Source for Discovering Latent
Characteristics of Users,” in CHI 2010 Workshop on Microblogging: What and How Can We Learn From It?, 2010.
[13] M. Pennacchiotti and A.-maria Popescu, “A Machine Learning Approach to Twitter User Classification,” in
Proceedings of the Fifth International AAAI Conference on Weblogs and Social Media, 2011, pp. 281-288.
[14] J. Weng, E.-peng Lim, and J. Jiang, “TwitterRank: Finding Topic-sensitive Influential Twitterers,” in Proceedings of the third ACM international conference on Web search and data mining, 2010.
[15] J. Chen, R. Nairn, L. Nelson, M. Bernstein, and E. H. Chi, “Short and Tweet: Experiments on Recommending Content from Information Streams,” in Proceedings of the 28th international conference on Human factors in computing systems, 2010, pp. 1185-1194.
[16] J. Hurlock and M. L. Wilson, “Searching Twitter:
Separating the Tweet from the Chaff,” in Proceedings of the Fifth International AAAI Conference on Weblogs and Social Media, 2011, pp. 161-168.
[17] A. Java, X. Song, T. Finin, and B. Tseng, “Why We Twitter : Understanding Microblogging,” in Proceedings of the 9th WebKDD and 1st SNA-KDD 2007 workshop on Web mining and social network analysis, 2007, pp. 56-65. [18] F. Abel, Q. Gao, G.-jan Houben, and K. Tao, “Analyzing
User Modeling on Twitter for Personalized News Recommendations,” in Proceedings of the 19th
international conference on User modeling, adaption, and personalization, 2011.
[19] B. Krishnamurthy, P. Gill, and M. Arlitt, “A few chirps about twitter,” Proceedings of the first workshop on Online social networks - WOSP ’08, p. 19, 2008.
[20] I. Anger and C. Kittl, “Measuring Influence on Twitter,” in
Proceedings of the 11th International Conference on Knowledge Management and Knowledge Technologies, 2011.
[21] S. A. Macskassy and M. Michelson, “Why Do People Retweet? Anti-Homophily Wins the Day!,” in Proceedings of the Fifth International AAAI Conference on Weblogs and Social Media, 2011, pp. 209-216.
[22] M. J. Welch, U. Schonfeld, and D. He, “Topical Semantics of Twitter Links,” in Proceedings of the fourth ACM international conference on Web search and data mining, 2011, pp. 327-336.
[23] E. M. Rogers, Diffusion of innovations, vol. 65, no. 5. Free Press, 1995, p. 519.
[24] H.-ching Chang, “A New Perspective on Twitter Hashtag Use : Diffusion of Innovation Theory,” in Proceedings of the 73rd ASIS&T Annual Meeting on Navigating Streams in an Information Ecosystem, 2010.
[25] J. Bentwood, “Distributed Influence: Quantifying the Impact of Social Media,” Edelman, 2008. [Online].
Available:
http://technobabble2dot0.files.wordpress.com/2008/01/edel man-white-paper-distributed-influence-quantifying-the-impact-of-social-media.pdf. [Accessed: 01-Mar-2011]. [26] J. Hargreaves and L. Davies, “New Influentials, Collective
Emotional Intelligence & The ‘ Topology of Influence’,” 2011.
[27] J. Halliday, “Google+ launches ‘What’s Hot’ and ‘Ripples’,” The Guardian, 27-Oct-2011. [Online]. Available:
http://www.guardian.co.uk/technology/blog/2011/oct/27/go ogle-plus-google. [Accessed: 27-Oct-2011].