Biosolids Applications Affect Runoff Water Quality following Forest Fire
V. F. Meyer, E. F. Redente, K. A. Barbarick,* and R. BrobstABSTRACT et al. (1986) found that biosolids significantly increased
total forest production in the Seattle, WA area. Other Soil erosion and nutrient losses are great concerns following forest
studies have shown that biosolids can improve semi-arid wildfires. Biosolids application might enhance revegetation efforts
while reducing soil erodibility. Consequently, we applied Denver shrublands and rangelands (Pierce et al., 1998; Harris-Metro Wastewater District composted biosolids at rates of 0, 40, and Pierce et al., 1995). Denis and Fresquez (1989) found 80 Mg ha⫺1to a severely burned, previously forested site near Buffalo
that soil chemical properties as well as the soil microbial Creek, CO to increase plant cover and growth. Soils were classified community improved with increasing application rates as Ustorthents, Ustochrepts, and Haploborols. Simulated rainfall was of biosolids. The increase in plant cover after biosolids applied for 30 min at a rate of 100 mm h⫺1 to 3-⫻10-m paired
addition can result in significantly greater ground cover, plots. Biosolids application rates did not significantly affect mean total
thereby reducing the impact of raindrops and detach-runoff (p⬍0.05). Sediment concentrations were significantly greater
ment of soil particles (Thurow et al., 1987). (p⬍0.05) from the control plots compared with the plots that had
The relatively high amount of organic matter in bio-received the 80 Mg biosolids ha⫺1rate. Biosolids application rate had
solids can improve the physical properties of soil (e.g., mixed effects on water-quality constituents; however, concentrations
of all runoff constituents for all treatment rates were below levels increased infiltration rates) (Bruggeman and Mosta-recommended for drinking water standards, except Pb. Biosolids ap- ghimi, 1989). Tester (1990) found that organic matter plication to this site increased plant cover, which should provide ero- introduced to the soil from biosolids application reduced
sion control. runoff and soil erosion. Results from other studies
indi-cate that biosolids are a useful means to improve pro-duction and achieve ecological stability. Restoration of ecosystems through the use of biosolids is common.
H
igh-intensity wildfires can cause significant ad- Research has been conducted on the effects of municipal verse effects on vegetation and soil physical and biosolids application as fertilizer and soil amendment chemical properties. Fire can remove surface litter and on forest lands since the 1970s. Cole et al. (1986) found herbaceous cover, thus leaving the remaining substrate that biosolids significantly increased total forest produc-susceptible to erosion, and can volatilize nutrients and tion. Other studies have shown that biosolids can im-oxidize soil organic matter, which may result in an im- prove overgrazed rangelands and semi-arid shrublands pervious hydrophobic layer in the soil profile (Wells (Pierce et al., 1998, Harris-Pierce et al., 1995). Denis et al., 1979). This condition generally exacerbates the and Fresquez (1989) found that soil chemical properties potential for severe soil erosion with increased runoff, as well as the soil microbial community improved with especially on relatively steep slopes. The application of increasing application rates of biosolids. At the same biosolids (sewage sludge) might improve soil chemical time, it was found that semiarid plant productivity in-and physical properties in-and mitigate the potential for creased with increasing biosolids application rates (Fres-severe erosion; however, biosolids addition requires ju- quez et al., 1990). However, there is no available re-dicious management to avoid some environmental risks search that has focused on the biosolids application such as overapplication of N and P and excessive accu- following forest fire and subsequent erosion remediation. mulation of toxic elements in plants and soils. The objectives of this study were to (i) determine Land application of biosolids will probably increase runoff quantity and (ii) determine runoff quality from in the future as disposal practices such as landfilling, a burned site as affected by biosolids application rate. incineration, and ocean dumping are banned or become Our hypotheses are that application of biosolids to for-too expensive (Pierzynski, 1994). Because biosolids con- est-fire sites will (i) decrease runoff, (ii) decrease sedi-tain both macronutrients and micronutrients that are ment concentration because plant canopy cover will in-essential for plant growth, the application of biosolids crease, and (iii) increase the runoff-water concentration to degraded soils may be an economical alternative to of NH4–N, NO3–N, total N, P, Ba, Ca, Cd, Cr, Cu, Pb,
inorganic fertilizers (Fresquez et al., 1990). and Zn since these are common biosolids constituents. Biosolids application can improve soil fertility,
ulti-mately increasing vegetative cover and production. Cole
MATERIALS AND METHODS
We initiated this study in spring 1997 at the 1996 Buffalo
V.F. Meyer and E.F. Redente, Dep. of Rangeland Ecosystem Science,
Creek fire site in Pike National Forest, approximately 22 km
and K.A. Barbarick, Dep. of Soil and Crop Sciences, Colorado State
southeast of Pine Junction, CO. The site is located at
Univ., Fort Collins, CO 80523. R. Brobst, U.S. Environmental
Protec-39⬚22⬘4.4″N, 105⬚14⬘26.5″W at an average elevation of 2235 m.
tion Agency Region 8, Denver, CO 80202. Received 4 Dec. 2000. *Corresponding author ([email protected]).
Abbreviations:TKN, total Kjeldahl nitrogen. Published in J. Environ. Qual. 30:1528–1532 (2001).
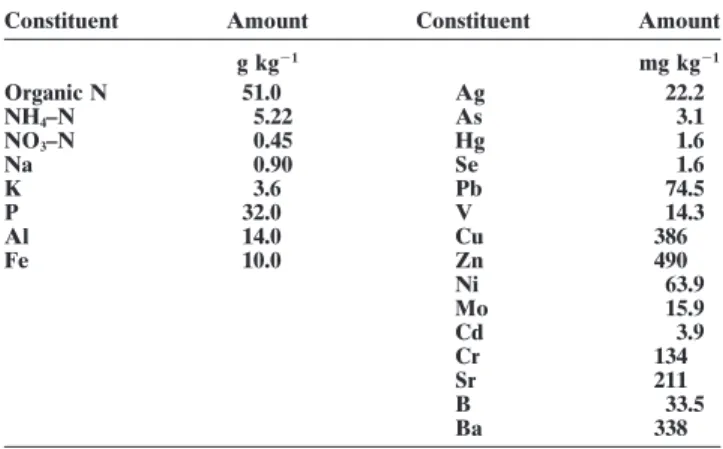
Table 2. Nutrient and trace mental composition (dry weight basis) Table 1. Seeded grasses, species cover, and total canopy cover at
the Buffalo Creek study site, June 1999. of Denver Metro composted biosolids applied to the Buffalo Creek site, May 1997.
Biosolids rate, Mg ha⫺1
Constituent Amount Constituent Amount
Species Common name 0 40 80 g kg⫺1 mg kg⫺1
Organic N 51.0 Ag 22.2
% cover
NH4–N 5.22 As 3.1
Elymus macrourus thickspike wheatgrass 18 25 24 NO
3–N 0.45 Hg 1.6
(Turcz.) Tzvelev Na 0.90 Se 1.6
Elymus lanceolatus streambank wheatgrass 23 28 39 K 3.6 Pb 74.5
(Scribn. & J. G. P 32.0 V 14.3
Sm.) Gould subsp. Al 14.0 Cu 386
lanceolatus Fe 10.0 Zn 490
Nassella viridula green needlegrass 2 14 5 Ni 63.9
(Trin.) Barkworth Mo 15.9
Bromus marginatus mountain brome – – – Cd 3.9
Nees ex Steud. Cr 134
Poa secundaJ. Presl Sandberg bluegrass – – – Sr 211
Festuca idahoensis Idaho fescue – – – B 33.5
Elmer Ba 338
Festuca arizonica Arizona fescue – – – Vasey
Total 47 69 71
In June 1999 before the rainfall simulations, we determined in the top 5 cm of soil at two locations within each plot the bulk Mean annual precipitation at the site is 520 mm and mean density using a core sampler, antecedent volumetric moisture annual temperature is 8⬚C. Nearly 75% of the annual precipita- content, and the sorptivity (measure of instantaneous infiltra-tion occurs in spring or summer, while fall and winter months tion rate; Smith, 1999). As suggested by Smith (1999), we de-are comparatively dry. Ponderosa pine (Pinus ponderosaP. termined sorptivity using a 10-cm-diameter by 10.5-cm-high Lawson & C. Lawson) and Douglas fir [Pseudotsuga menziesii ring, pushed approximately 1 cm into the surface, and a 1-cm
(Mirb.) Franco] dominated the site before the wildfire. The head of water. After determining the time required for the U.S. Forest Service broadcast-seeded the plots with a grass 1 cm of water to infiltrate, we calculated sorptivity (Smith, mixture at the rate of 34 kg ha⫺1(Table 1) following biosolids
1999) as: application and discing in May 1997. We conducted rainfall
S⫽I/t0.5 [1]
simulations in June 1999, approximately 3 yr following the fire
and about 2 yr after biosolids incorporation and grass seeding. whereS⫽sorptivity, cm s⫺0.5;I⫽cumulative infiltrated depth, cm (I⫽1 cm for our tests); andt⫽time for infiltration of Two grasses, thickspike wheatgrass [Elymus macrourus
(Turcz.) Tzvelev] and streambank wheatgrass [Elymus lanceo- 1-cm head, s.
A border consisting of 15-cm-high galvanized metal edging
latus(Scribn. & J.G. Sm.) Gould subsp.lanceolatus],
domi-nated the study site in 1999 (Table 1). Canopy cover was was installed to a depth of 6 cm around each of the twelve 3-⫻10-m plots to exclude runon and to prevent runoff loss determined by the point method (Bonham, 1989). We
re-corded cover for 100 points along two randomly placed tran- before measurement. We collected runoff in each plot in troughs at the lower edge of each plot after directing flow sects in each rainfall plot.
Soils at the study site are loamy-skeletal, mixed Typic Ustor- through critical-depth flumes. A bubble flow meter was used to measure the depth of the water flowing through the flumes. thents; skeletal, mixed Typic Ustochrepts; and
loamy-skeletal, mixed Typic Haploborols. These soils are 25 to 50 We recorded flow measurements at 2-min intervals.
In June 1999, we used a rainfall simulator from the U.S. cm deep and have developed from Pike’s Peak granite. Surface
textures of these soils are gravelly clay-loam to gravelly sandy- Geological Survey to apply water to the plots. The simulator consisted of 18 revolving sprinkler heads mounted on 3-m loam. We found inclusions of each soil in every plot.
Simulated rainfall plots were established in pairs on slopes standpipes (Lusby and Lichty, 1983). Water was applied simul-taneously to two plots and covered the entire area of the plots ranging from 10 to 16%. We assumed that slope would not
affect runoff, since Harris-Pierce et al. (1995) found no differ- plus overlap of the plot borders. We collected samples to determine antecedent moisture conditions to a depth of 7.5 cm ences between runoff on plots with approximately 8 or 15%
slopes used in a rainfall-simulation study on a grassland site immediately preceding each rainfall simulation. We applied simulated rainfall to each pair of plots for 30 min at the rate near Fort Collins, CO. Bulldozers were used to clear trees
and to smooth the surface so that a dump truck could safely of approximately 100 mm h⫺1. Harris-Pierce et al. (1995) and Aguillar and Loftin (1992) used this same rate for rainfall apply the biosolids. Plots either received no biosolids (control)
or composted biosolids (40 or 80 dry Mg ha⫺1) from Denver simulations on grasslands in Colorado and New Mexico, re-spectively. Total rainfall and application rate were measured Metro Wastewater District in Spring 1997 (Table 2). Compost
application was accomplished using calibrated broadcasting by 12 plastic gauges in each pair of plots. We conducted only one rainfall simulation on each pair of plots.
with a dump truck fitted with rear discharge manure-spreading
capabilities. Controls and biosolids treatments were randomly We divided runoff quantity by the total amount of applied simulated rainfall to calculate the amount of runoff for the located and replicated four times for a total of 12 experimental
plots in a randomized complete block design. Biosolids were amount of rainfall input (Harris-Pierce et al., 1995). Runoff percentages [(runoff⫻100)/rainfall] were computed for each incorporated in the soil to a depth of 10 to 20 cm with a
commercial disc. Control plots were also disced to a depth of treatment (Ward and Bolin, 1989).
We collected runoff samples in 0.5-L plastic bottles at 5-min 10 to 20 cm. The disc was large enough to work through
tree stumps and roots remaining on the soil surface after the intervals during the single rainfall simulation conducted on each pair of plots. Samples were immediately placed in ice bulldozing operation. After biosolids application, discing, and
then seeding, a chain-link fence was dragged on the surface chests and held at 4⬚C (Stednick, 1991). We then transported the samples to the lab in an ice chest for subsequent analyses to cover the seed and smooth the soil.
Table 5. Runoff water quality for three rates of Denver Metro Table 3. Bulk density, volumetric moisture content in the top 7.5
cm of soil, and sorptivity (a measure of instantaneous infiltra- composted biosolids at Buffalo Creek, June 1999. Means with different letters within a row are significantly different ac-tion rate) of runoff plots at the Buffalo Creek study site,
June 1999. cording to the least significant test atp⫽0.05. Biosolids rate, Mg ha⫺1 Volumetric H2O
Biosolids rate Bulk density† content† Sorptivity†
Constituent 0 (control) 40 80
Mg ha⫺1 g cm⫺3 cm3cm⫺3 cm s⫺0.5
Sediment, g L⫺1 2.37a 1.11b 0.98b
0 1.45 0.0073 0.152 NH
4–N, mg L⫺1 0.02a 0.13a 0.13a
40 1.25 0.0080 0.125 NO
3–N, mg L⫺1 0.47a 0.42a 0.73a
80 1.35 0.0171 0.158 TKN, mg L⫺1† 2.01b 2.22ab 2.60a
Standard error 0.12 0.0066 0.036 P, mg L⫺1 1.08b 1.24b 2.11a
Ba, mg L⫺1 0.70a 0.31b 0.32b
† All statistical results showed nonsignificant effects of biosolids
applica-Ca, mg L⫺1 37a 28b 28b
tion rate atp⫽0.05.
Cd, mg L⫺1 ⬍0.01a ⬍0.01a ⬍0.01a
Cr, mg L⫺1 0.02a 0.02a 0.03a
for Na, K, B, P, Al, Fe, Cu, Ni, Mo, Pb, Cd, Cr, Ba, Mn, and Cu, mg L⫺1 0.02b 0.03b 0.04a
Zn. Samples analyzed for total metal concentrations were Pb, mg L⫺1 0.07a 0.07a 0.04b
Zn, mg L⫺1 0.37a 0.48a 0.46a
preserved with concentrated nitric acid (5 mL HNO3L⫺1of
water sample). We collected separate samples for total Kjel- † Total Kjeldahl nitrogen. dahl nitrogen (TKN), NH4–N, and NO3–N. We obtained
sedi-ment samples on each plot at each 5-min interval in 0.5-L Pierce et al. (1995), in their work in a shortgrass steppe plastic bottles and subsequently dried the unfiltered samples
community, reported ranges of 28 to 65% of rainfall
at 105⬚C to determine sediment mass.
input lost as runoff on control plots while their biosolids
Nitrate in water samples was determined by ion
chromatog-plots ranged from 8 to 55%. The proportion of simulated
raphy, USEPA Method 300.0 (USEPA, 1983). Ammonium
rainfall lost as runoff varied widely on all treatments,
content was determined by the automated phenolate
colori-metric method, USEPA Method 350.1 (USEPA, 1983). We which is common on many watersheds. Because of
varia-used Bremner’s (1996) procedure for determining TKN (or- tion in soil surface sealing, bulk density, soil wetability,
ganic N plus NH4–N). Concentrations of metals were deter- soil texture, and moisture holding capacity, areas within mined by inductively coupled plasma emission spectroscopy the same plots may exhibit large differences in infiltra-(ICP), USEPA Method 200.0 (USEPA, 1983). tion rates. Adding to this complexity are the
hydro-We conducted statistical analyses on all data using analyses
phobic conditions caused by variability in fire intensity
of variance mean separation tests, which we performed when
(Pyne et al., 1996). In areas where vegetation biomass
significant treatment effects were detected using least
signifi-is limited prior to a burn, hydrophobicity signifi-is usually less.
cance difference (LSD) atp⫽0.05.
Conversely, where fire consumes large quantities of bio-mass, hydrophobicity can be quite severe, resulting in
RESULTS AND DISCUSSION
low rates of infiltration. Kladivko and Nelson (1979), in their study of biosolids effects on soil properties of Analyses completed in June 1999 within 2 wk priorto rainfall simulation showed that biosolids application an undisturbed area, reported that one application of biosolids had no significant effect on infiltration on two did not significantly affect (p⫽ 0.05) bulk density, soil
moisture content, or sorptivity (Table 3). The relatively silt loams and a sandy loam in Indiana at the end of the first growing season. They concluded that as the result high standard errors for each parameter indicate that
these measurements exhibited a great deal of variability. of spatial heterogeneity in infiltration characteristics a large number of replicates (⬎10) would be needed to Mean antecedent volumetric moisture contents taken
the same day as the rainfall simulations were 0.056, obtain statistically significant infiltration data.
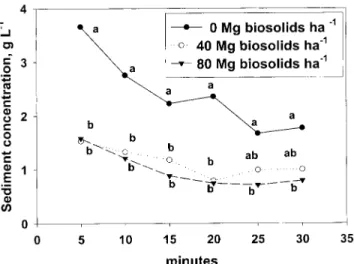
Biosolids application reduced runoff sediment con-0.048, and 0.069 cm3cm⫺3for the control and 40 and 80
Mg ha⫺1biosolids rates, respectively. centrations (Table 5). Sediment concentrations were
sig-nificantly reduced by application of 40 Mg ha⫺1 plots
Even though mean runoff values were smaller on the
biosolids treatments, biosolids application rate did not compared with the control plots at all sample times except 25 and 30 min, whereas the 80 Mg ha⫺1
signifi-statistically affect runoff (p ⫽ 0.05; Table 4), thus we
cannot accept our first hypothesis concerning runoff cantly reduced sediment concentrations at all times (Fig. 1). Dadkhah and Gifford (1980) studied the influence of reduction with biosolids addition. Control plots had a
range of 18 to 53% of rainfall input lost as runoff, vegetation on infiltration rates and sediment production and found that as vegetative cover increased beyond whereas the plots that had received the 40 Mg ha⫺1rate
ranged from 1 to 12% and those that received the 80 50%, sediment production decreased exponentially. Canopy cover on our control plots was 47% while can-Mg ha⫺1biosolids rate ranged from 0.5 to 22%.
Harris-Table 4. Average precipitation and runoff produced by a single rainfall event with three Denver Metro composted biosolids application rates at the Buffalo Creek study site, June 1999.
Biosolids rate Precipitation† Standard error Runoff† Standard error Runoff/precipitation† Standard error
Mg ha⫺1 mm
0 52.1 3.1 12.4 4.4 0.24 0.10
40 56.4 4.4 2.8 1.6 0.05 0.03
80 49.8 1.5 7.0 2.4 0.14 0.05
site, they did not observe detectable NO3–N in the
run-off samples. Nitrification of the NH4–N in the biosolids
did not have a chance to occur to a significant extent, since they had not incorporated the biosolids into the soil surface. Higher concentrations of N seem to occur with surface application (unincorporated) and when runoff happens within 2 wk compared with 2 yr after biosolids incorporation.
Mean total concentrations (mg L⫺1) of nutrients and
metals in runoff exhibited mixed results among the three treatments. Calcium, Mg, Al, Mn, Sr, Ba, and Si concen-trations were higher in runoff from the control plots compared with either biosolids application rate (Table 5), probably because of the larger transport of mineral soil in the runoff from the control sites. Sodium, K, P, and Cu runoff concentrations were higher in runoff from plots with the highest biosolids application rate. These Fig. 1. Runoff sediment concentrations from biosolids treatments
dur-ing a 30-min rainfall simulation (100 mm h⫺1) at Buffalo Creek, elements are significant constituents in the Denver June 1999. Lowercase letters at each data point represent mean- Metro biosolids (Table 2). Total runoff concentrations separation comparisons among the three biosolids application rate of Fe, Ti, Zn, Ni, Mo, Cd, Cr, B, As, Se, and Hg did treatments at a given time.
not differ among the three runoff treatments. Lead and V concentrations were significantly lower on the 80 Mg opy cover on the 40 and 80 Mg ha⫺1 plots was 69 and ha⫺1 treatment plots than either the 0 or 40 Mg ha⫺1
71%, respectively (Table 1). Vegetative cover not only rates. As reported by Hooda and Alloway (1993), bio-reduces raindrop impact at the soil surface, but also solids addition reduced plant availability of Pb in sandy slows overland flow, reducing soil particle transport. soils, probably due to adsorption of the metals by the These results support our second hypothesis regarding biosolids matrix. Corey et al. (1987) support this postula-reduction in runoff sediment concentration with biosol- tion. Harris-Pierce et al. (1995) found that their biosolids ids application. Harris-Pierce et al. (1995) found that treatments (22 and 41 Mg ha⫺1) significantly decreased
surface application (not incorporated into the soil) of average runoff concentrations of Al and Fe while biosol-ids application increased concentrations of Na, K, B, P, City of Fort Collins, CO biosolids at rates of 22 and 41
Cu, Ni, and Mo. Consequently, we not only have mixed dry Mg ha⫺1 increased sediment loads compared with
results regarding acceptance of our third hypothesis, we their control. They postulated that transport of fine
bio-find that a different study reported different results than solids led to this increased sediment loading. They,
how-ours. We attribute most of the inconsistencies between ever, had more than 75% canopy cover on all plots and
the two studies to the difference in biosolids incorpora-their mean sediment loads ranged from 0.5 to 1.0 g L⫺1,
tion and with the timing of simulated-rainfall tests after while we found mean sediment loads that ranged from
biosolids addition. Harris-Pierce et al. (1995) did their 0.7 to 3.7 g L⫺1. Aguilar and Loftin’s (1992) rainfall
runoff tests within 2 wk after surface application (unin-simulations did not produce any runoff on
biosolids-corporated) of biosolids while we had a lag of about treated plots in New Mexico.
2 yr between the time we incorporated biosolids to when Mean total runoff concentrations of NO3–N and
we conducted the rainfall simulations. Mean total runoff NH4–N did not increase with increasing rates of
biosol-concentrations of potentially toxic substances at all ids application (Table 5). Total Kjeldahl nitrogen
treatment rates were less than the levels recommended (TKN), however, was higher in runoff from the 80 Mg
for livestock drinking water reported by Soltanpour and ha⫺1biosolids treatment plots compared with the
con-Raley (1989; Table 6) and less than the USEPA drinking trol plots. Runoff concentrations of these constituents,
however, were below USEPA standards for drinking Table 6. Recommended upper limit levels of potentially toxic water (USEPA, 1992). We observed no consistent substances in drinking water for livestock (Soltanpour and Ra-ley, 1989) and according to USEPA (1992) drinking water trends in runoff concentrations of NO3–N, NH4–N, or
standards for humans. TKN over time within and between biosolids rates (data
Livestock not shown). All NO3–N levels were less than 2.4 mg
Constituent drinking water USEPA standards L⫺1, all NH
4–N concentrations were less than 0.4 mg
mg L⫺1 L⫺1, and all TKN were less than 3.2 mg L⫺1 (Meyer,
2000). Harris-Pierce et al. (1995) found significantly Al 5.0 –
B 5.0 –
higher average NH4–N and TKN concentrations in their
Ba – 2.0
surface-applied 22 and 41 Mg ha⫺1biosolids treatments
Cd 0.05 0.005
compared with the control. Their NH4–N and TKN lev- Cr 1.0 0.1
Cu 0.5 1.3
els on the two biosolids treatments were more than an
Pb 0.05 0.01
order of magnitude larger than our average concentra- Se 0.05 –
Zn 24 –
tions. Since they conducted their rainfall simulations
NO3–N⫹NO2–N 100 10
in a sewage-sludge-amended semi-arid grassland. Biol. Fertil. Soils
water standards (Table 6), except for the average Pb
7:310–317.
concentrations in the runoff water from the control and Fresquez, P.R., R.E. Francis, and G.L. Denis. 1990. Soil and vegetation the 40 Mg ha⫺1treatment (Table 5).
responses to sewage sludge on a degraded semiarid broom
snake-Biosolids application to the Buffalo Creek wildfire weed/blue grama plant community. J. Range Manage. 43:325–331. Harris-Pierce, R.L., E.F. Redente, and K.A. Barbarick. 1995. Sewage
site has resulted in an increase in grass-vegetation cover,
sludge application effects on runoff water quality in a semiarid
which in turn has reduced the potential for erosion by
grassland. J. Environ. Qual. 24:112–115.
decreasing sediment loss. Although total runoff was un- Kladivko, E.J., and D.W. Nelson. 1979. Changes in soil properties affected by biosolids application, the decreases of sedi- from application of anaerobic sludge. J. Water Pollut. Control Fed.
51:325–332.
ment concentrations in runoff should help alleviate
Lusby, G.C., and R.W. Lichty. 1983. Use of rainfall-simulator data
sedimentation of adjacent water bodies. Because all
con-in precipitation-runoff modelcon-ing studies. U.S. Geol. Survey Water
stituents, except Pb, were below recommended upper
Resour. Investigations Rep. 83-4159. USGS, Denver, CO.
limit levels, contamination of surface water by biosolids Meyer, V.F. 2000. The effect of biosolids application on erosion con-application from Denver Metro Wastewater District does trol and ecosystem recovery following the Buffalo Creek fire. M.S.
thesis. Colorado State Univ., Fort Collins, CO.
not constitute a threat to surface water supplies.
Pierce, B.L., E.F. Redente, K.A. Barbarick, R.B. Brobst, and P. Hege-man. 1998. Plant biomass and elemental changes in shrubland
for-ACKNOWLEDGMENTS ages following biosolids application. J. Environ. Qual. 27:789–794.
Pierzynski, G.M. 1994. Plant nutrient aspects of sewage sludge. p.
We thank the USEPA, USDA Forest Service, Colorado
21–25.InC.E. Clapp et al. (ed.) Sewage sludge: Land utilization
Department of Public Health, and Denver Metro Wastewater
and the environment. ASA, CSSA, and SSSA, Madison, WI.
Reclamation District for their support of this project. We also Pyne, S.J., P.L. Andrews, and R.D. Laven. 1996. Introduction to wild-thank the U.S. Geological Survey for providing the rainfall fire. 2nd ed. John Wiley & Sons, New York.
simulator, and Dr. Gary Frasier, USDA-ARS, for providing Smith, R.E. 1999. Rapid measurement of soil sorptivity. Soil Sci. Soc. the flumes and bubble flow meters for this study. Am. J. 63:55–57.
Soltanpour, P.N., and W.L. Raley. 1989. Evaluation of drinking water quality for livestock. No. 4.908. Colorado State Univ. Coop. Ext.
REFERENCES
Serv., Fort Collins, CO.
Stednick, J.D. 1991. Wildland water quality sampling and analysis. Aguilar, R., and S.R. Loftin. 1992. Sewage sludge application in semi- Academic Press, San Diego, CA.
arid grasslands: Effects on runoff and surface water quality. p. Tester, C.F. 1990. Organic amendment effects on physical chemical 101–111.InProc. of the 36th Annu. New Mexico Water Conf., Las properties of a sandy soil. Soil Sci. Soc. Am. J. 54:827–831. Cruces, NM. 7–8 Nov. 1991. WRRI Rep. 265. Thurow, T.L., W.H. Blackburn, S.D. Warren, and C.A. Taylor, Jr. Bonham, C.D. 1989. Measurements for terrestrial vegetation. John 1987. Rainfall interception by midgrass, shortgrass, and live oak
Wiley & Sons, New York. mottes. J. Range Manage. 40:456–460.
Bremner, J.M. 1996. Nitrogen—Total. p. 1085–1121.InD.L. Sparks USEPA. 1983. Methods for chemical analysis for water and waste. (ed.) Methods of soil analysis. Part 3. 3rd ed. SSSA Book Ser. 5. USEPA, Cincinnati, OH.
SSSA, Madison, WI. USEPA. 1992. Technical support document for land application of Bruggeman, A.C., and S. Mostaghimi. 1989. Sludge application effects sewage sludge. EPA 822/R-93-001a. USEPA Office of Water,
East-on runoff, infiltratiEast-on, and water quality. Am. Soc. Agric. Eng., St. ern Res. Group, Lexington, MA.
Joseph, MI. Ward, T.J., and S.B. Bolin. 1989. A study of rainfall simulators, runoff Cole, D.W., C.L. Henry, and W. Nutter. 1986. The forest alternative and erosion processes, and nutrient yields on selected sites in Ari-for treatment and utilization of municipal and industrial wastewater zona and New Mexico. Tech. Completion Rep. 241. New Mexico and sludge. Univ. of Washington Press, Seattle, WA. Water Resour. Inst., Las Cruces, NM.
Dadkhah, M., and G.F. Gifford. 1980. Influence of vegetation, rock Wells, C.G., R.E. Campbell, L.F. Debano, C.E. Lewis, R.L. Fredrik-cover, and trampling on infiltration rates and sediment production. sen, E.C. Franklin, R.C. Froelich, and P.H. Dunn. 1979. Effects of Water Resour. Bull. 16:979–986. fire on soil: A state-of-knowledge review. USDA For. Serv. General
Tech. Rep. WO no. 7. USDA For. Serv., Washington, DC. Denis, G.L., and P.R. Fresquez. 1989. The soil microbial community