Electricity
clustering
framework
for
automatic
classification
of
customer
loads
Félix
Biscarri
∗
,
Iñigo
Monedero,
Antonio
García,
Juan
Ignacio
Guerrero,
Carlos
León
Escuela
Politécnica
Superior,
Electronic
Department,
Virgen
de
Africa,
7,
Sevilla,
CP
41011,
Spain
Keywords:
Electricityconsumption Hourlydemand Loadprofiling Time-seriesclustering Clusteringfeaturesselection Treeclassificationmethods
a
b
s
t
r
a
c
t
Clusteringinenergymarketsisatoptopicwithhighsignificanceonexpertandintelligentsystems.The mainimpactofispaperistheproposalofanewclusteringframeworkfortheautomaticclassification ofelectricitycustomers’loads.Anautomaticselection oftheclustering classificationalgorithmis also highlighted.Finally,newcustomerscan beassignedtoapredefinedset ofclusters intheclassification phase.Thecomputationtimeoftheproposedframeworkislessthanthatofpreviousclassification tech-niques,whichenablestheprocessingofacompleteelectriccompanysampleinamatterofminuteson apersonalcomputer.Thehighaccuracyofthepredictedclassificationresultsverifiestheperformanceof theclusteringtechnique.Thisclassificationphaseisofsignificantassistanceininterpretingthe results, andthesimplicityoftheclusteringphaseissufficienttodemonstratethequalityofthecompletemining framework.
1. Introduction
New technologies derived from the paradigm of Smart Grids
(Tuballa & Abundo, 2016) have increased the control and
moni-toringof electricityconsumption by customers,distribution com-panies,andretailers.Thisnewscenariohasledto anexponential growthintheavailable informationconcerningthe gridand con-sumption.Thus, thesetechnologies haveled tothe emergence of newservices,and theincreased efficiencyandreliability of elec-tricitysupplies. Tofacilitateinteraction withother systems,these new services must be able to analyse huge amounts of infor-mation in a short time (Fang et al., 2016). To achieve this goal, analysismethodsandmodellingdesigns must beconstructed us-ing big data platforms (Diamantoulakis, Kapinas, & Karagianni-dis, 2015) such as Apache Hadoop (Hafen, Gibson, van Dam, &
Critchlow,2014) or Spark (Shyam, Kumar, Poornachandran,&
So-man,2015).Inthecurrentregulationmodeloftheelectricity sec-tor,one ofthemaintargetsistoimprovetheperformanceof dis-tribution, thus increasing the level of knowledge about demand. The most common way to evaluate energy efficiency is to eval-uate the behaviour of the customers’ load curve, including pos-sible displacements in peak hours (Ferreira, de Oliveira Fontes,
∗ Correspondingauthor.
E-mailaddresses: [email protected] (F.Biscarri), [email protected](I.Monedero),
Cavalcante,&Marambio, 2015).Accurateknowledgeofcustomers’
consumption patterns represents a worthwhile asset for electric-ityprovidersincompetitiveelectricitymarkets.Variousapproaches can be used to group customers that exhibit similar electricity consumptionbehaviourintocustomer classes(Chiccoetal., 2004;
Xu&Wunsch,2005).Dynamicclusteringcanbe applied(Benítez,
Quijano,Díez, & Delgado,2014;Lee, Kim, &Kim, 2011), withthe
focus on large-scale customers (Tsekouras, Hatziargyriou, &
Dia-lynas, 2007; Zhang, Zhang, Lu, Feng, & Yang, 2012). The main
idea is to identify customers hourly loadprofiles (HLPs)(Chicco,
2012; Grigoras & Scarlatache, 2014) and develop a rule set for
the automatic classification of new consumers (Halkidi &
Vazir-giannis, 2008; Ramos,Duarte, Duarte, & Vale,2015). Several
cus-tomer parameters, i.e. economic size, economic activity, and en-ergy consumption, are typically used in current models (Dzobo,
Alvehag,Gaunt,&Herman,2014).Inthemarketscenario,
electric-ityprovidershavebeengivennewdegreesoffreedomindefining tariff structures and rates under regulatory-imposed revenue caps
(Granell,Axon,&Wallom,2015).Thisrequiresasuitablegrouping
oftheelectricitycustomersintocustomer classes(Figueiredo,
Ro-drigues,Vale,&Gouveia,2005).Otherapplicationsofload
classifi-cationincludingtheidentificationandcorrectionoferroneousdata andload forecasting(leZhou, lin Yang, & Shen, 2013). Statistical techniquessuch ask-means(Lópezetal., 2011),fuzzytechniques
(Azadeh, Saberi, & Seraj, 2010), and frequency-domain load
pat-terndata(Carpaneto,Chicco,Napoli,& Scutariu,2006) havebeen
[email protected](A.García), [email protected](J.I.Guerrero), [email protected](C. León).
used.Althoughdifferentclusteringmethodsareusedforload clas-sification (Rasanen, Voukantsis, Niska, Karatzas, & Kolehmainen, 2010), the key requirements are some load data measuring and collection platform forautomated meter reading(AMR), comput-ing software such as MATLAB, SPSS, orR, andhigh-performance computers. The present study was conducted using the R software.
2. Miningframeworkforloadclassification
Load classification includes a pre-clustering phase to distin-guish between different categories of customers. This first cate-gorization of customer loads considers economic reasons. During thepre-clusteringphase,themainfeatureisthecontractedtariff, which usually determines the expected load profile. Other fields of interest are the seasonal variation in electricity consumption and the individual consumer categories: households, agriculture, industry,privateservices,andpublicservices.Forexample, agricul-tureconsumption isnotassystematicasfortheother categories, andisheavilydependentonmeteorologicalvariablessuchas tem-perature, cloud cover,anddaylight hours. Consumptionon work-daysandnon-workdaysdiffersbetweenmonthsanddifferent cat-egories,exceptincertainindustrieswherethemonthlyprofilesare assumedtobe identical.Unfortunately,individual consumer cate-gories are not always specified inthe electriccompany database, whichmeansthatthisusefulinformationisnotavailablefor clus-tering purposes. After the pre-clustering phase, a data reduction processwillbeperformed. Thesamplingrateofsmartmeters en-ables24–96consumptiondataperday,i.e.asampleeveryhouror every 15 min.Thisrepresentsasignificant computationtime for millionsof customers,each one describedwitha96-dimensional vector perday.This hugequantityofdata necessitatestheuseof data reduction andcharacterization techniques.Furthermore, sig-nificant information will be preservedduring the reduction pro-cess. The algorithm could be run on a big data system, such as thosebasedonApacheHadooporSparklibraries.Theuseofthese infrastructures increasesthe efficiencyandreliability ofthe algo-rithm in large-scale databases, which decreases the computation time.Different techniquesforthispurposeincludeprincipal com-ponentanalysis(Chicco,Napoli,& Piglione,2006),harmonic
anal-ysis(Carpaneto,Chicco,Napoli,&Scutariu,2006),andthewavelet
representation (Mallat, 1989). López et al. (2011) proposed the daily mean power values, calculated during time-of-use pricing (usuallytwodailyperiods,namedpeakandvalleyhours).This pa-perpresentsanewdatacharacterizationthatreducesthe compu-tationtime withrespect tothe techniquesmentionedabove. The pre-clusteringphasereducestheinformationoneachcustomerto a vector composed of a few features. This vector is used asthe inputtotheclusteringprocess.Thisclusteringphaseincludes sev-eraltasks: theselection ofthe clusteringalgorithmandthe opti-mumnumberofclusters.Validationtechniques(Halkidi,Batistakis,
&Vazirgiannis,2001)canbeappliedduringthissteptoensurethe
qualityoftheclusteringresults.Thecorrectnessofclustering algo-rithm resultsisverifiedusingappropriatecriteriaandtechniques. Since clustering algorithms define clusters that are not known a priori,irrespective oftheclusteringmethod,thefinalpartitioning ofdatagenerallyrequiressomekindofevaluation.Thus,themain output oftheclusteringphase istheclassification ofa sampleof customersintoclusters. Inmanycases,theexpertsinthe applica-tionareahavetointegratetheclusteringresultswithother experi-mentalevidenceandanalysisinordertodrawappropriate conclu-sions.Inotherwords,electriccompanyexpertswouldvalidateand interpretthepragmaticusefulnessoftheclustering.Thefinalstep istheclassificationphase.Classificationassignsnewcustomersto apredefinedsetofcategoriesorclusters.Theclusteringphase pro-ducesinitialcategoriesinwhichthevaluesinadatasetare
classi-Fig.1. Clusteringandclassificationminingframework.
fiedduringtheclassificationprocess.Theclassificationphaseisof greatassistanceininterpretingtheresults,asweshowinthe fol-lowingsections. The simplicityof the clusteringphase convinces anelectriccompanyexpertofthequalityofthecompletemining framework(Fig.1).
3. Pre-clusteringandfeatureselectionphases
During this phase, a sample of similar customers is selected basedontheirconsumptionandothereconomiccriteria.The indi-vidualconsumercategoriesareoftenincorrectly specifiedin com-pany databases. Most customers appear as households, despite having a high contracted power. Thus, we selected a sample of customers with a certain contracted power (tariff 3.0A), a time-framethat ensures non-seasonalvariations(three months), anda commonclimatelocation.Thesecustomersarelocatedinnine ad-jacentvillages aroundSeville inAndalucia,Spain. The differences betweenthe customer environmentswere minimized to guaran-teethehomogeneityofthesubsequentclustering.Thesample con-tainedatotalof218customers.The3.0Atariff isatime-to-use tar-iff forlow-voltagecustomers(below1 kV).Therearethreedefined periodsforpricing:peak(18–22h),valley(0–8h),andflat(8–18h and22–24h).AccordingtoinformationfromSpainNational Com-missionofEnergy(CNE), suchcustomersrepresentapproximately 2%ofallelectricityconsumersinSpain.Featureselectionanddata reductionarenecessarytasks.Twenty-fourhourlydatapointsper customerperdaywouldbeunmanageableintermsofcomputation time. Hence, researchers often use the mean daily power or the meanpowerduringeachpricingperiod(meanpeakhours power, mean valley hours power, mean flat hours power) (López et al., 2011). Additionally,a numberof studies distinguish between dif-ferent months and working or non-working days (Chicco, 2012). Therearetwopracticalproblemsintheuseofthesefeatures,one regardingthe useof themean powerandanother relatedto the useof thepricing periods.Withrespect to calculationsbased on thepricing periods,customers oftenvary their load profiles over the same period. Company experts prefer to divide the daytime into several periods based on the true electricity use.These pe-riodsare highlydependent on theeconomic activity andclimate location of the consumer.Sample testshave shownthat the
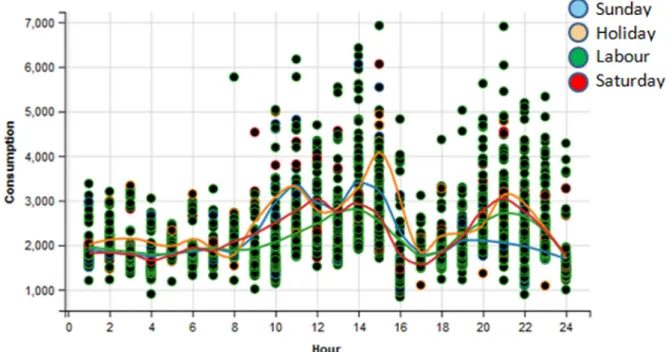
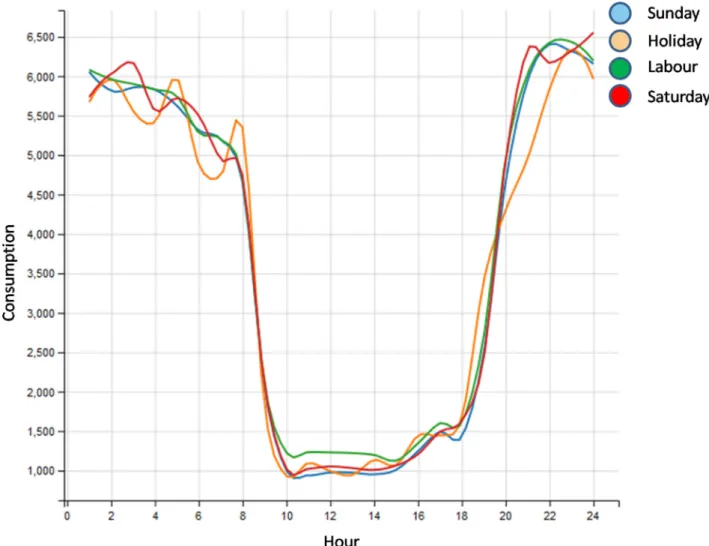
fol-Fig.2. LOESScurveincustomerwithtariff 3.0A.(Forinterpretationofthereferencestocolourinthetext,thereaderisreferredtothewebversionofthisarticle.)
lowingsthreetime periodsareappropriate:8–15h;16–21 h;and 22–7h. Thisdivision considers the opening andclosingtimes of commercialcustomersandthetypicalworkdayofhouseholds. Ob-servationsofacompletesetofcustomer loadcurvessupportthis decision.
Withrespectto thecalculationoftheconsumptionmeanover several time periods, mean values mask the evolution of hourly consumption. Company experts prefer others features that allow theevolution ofthe load curve tobe determined. We haveused thenumber ofhours of high/low consumption in thethree time periods describedbelow, as well asthe count of the number of customerconsumptionpeaksandvalleysduringthesametime pe-riods.Company experts can understand such features, which are alsousefulforclusteringpurposes.Thissetoffeatures isfully ex-plainedin AppendixA.Todistinguish peaksandvalleys, a LOESS (LOcalregrESSion smoothing)curvewasused.LOESScurves com-bine multiple regression models in a k-nearest-neighbour-based meta-model.Asmoothingparameter(
α
)controlstheflexibility of theLOESSregressionfunction.Largevaluesofα
producesmoother functionsinresponsetofluctuationsinthedata.Smallervaluesofα
cause the regression function to follow the data more closely. However,too smallavalue ofα
isnot desirable,becausethe re-gressionfunctionwilleventuallystarttocapturetherandomerrors inthedata.Usefulvaluesofthesmoothingparametertypicallylie intherange0.25–0.5formostLOESSapplications.In thepresent study,avalueofα
=0.2hasbeenused.ThefeaturesexplainedinAppendixA use these curvesto identify consumption peaks and
valleysandforothercalculations.
Fig. 2 showsthe LOESScurve for a customer on workingand non-workingdays.Companyexpertscould observe the consump-tionevolutionanddeterminethat,onworkingdays(greencurve), thecustomerhaslow consumptionfrom0–8h, amaximum con-sumptionatapproximately14 h,a minimumat17 h,anda new peakat21h. Sundays(orangecurve)exhibitlow consumption in theafternoons.
ThefeaturesforthiscustomerareNMP=2;NAP=1;NNP=0; NMiV=1;NHcNh=0;NLcHh=6;NHcMh=5;NLcMh=0;and NLcAh=0.
4. Theclusteringalgorithmandtheoptimumnumberof clusters
There are a wide variety of clustering algorithms available in data mining software (Brock, Pihur, Datta, & Datta, 2008), such asconnectivity-basedclustering(hierarchicalclustering), centroid-based clustering, distribution-based clustering, anddensity-based clustering. The proposed framework testsa complete set of clus-teringalgorithmswithdifferentnumbersofclustersanddifferent validationmeasures,andselectsthemostsuitablesolution.Abrief descriptionofeachclusteringmethodisgivenbelow.
Hierarchical clustering is an agglomerative and hierarchical clusteringalgorithm that yields a dendrogram that can be cut at a chosen height to produce the desired number of clusters.Eachobservationisinitiallyplacedinitsown clus-ter,andtheclustersaresuccessivelyjoinedtogetherinorder oftheircloseness,asdeterminedbyadissimilaritymatrix. K-meansisaniterativemethodthatminimizesthewithin-class
sumofsquaresforagivennumberofclusters.Clusteringis stronglydependent of theinitial guessforthe cluster cen-tres.Eachobservationisplaced intheclustertowhichitis closest, andthecentres areupdated until they remain sta-tionary.
Diana is a hierarchicalalgorithm that startswithall observa-tions inasinglecluster andsuccessively dividesthe obser-vationsuntilthereare aseriesofclusterscontainingonlya singleobservation.Thisalgorithmusesahierarchicaldivisive clusteringapproach.
PAMissimilartok-means,butadmitstheuseofother dissim-ilaritymetricsbesidestheEuclideandistance.
Claraisasampling-basedalgorithmthatimplementsPAMona numberof sub-datasets, whichis usefulwhen thenumber ofobservationsisrelativelylarge.
Fannyisafuzzy-clusteringalgorithminwhicheachobservation canhavea partialmembership ineach cluster.Each obser-vationisassignedtotheclusterforwhichithasthehighest membershipvalue.
Fig.3. Internalvalidation:connectivity.
Table1
Optimalscoresinvalidationtests.
Score Method Clusters Connectivity 2.8611 PAM 2 Dunn 0.3121 Diana 9 Silhouette 0.6217 SOM 3
SOMisaneural networkunsupervisedlearningtechniquethat allowsmapsandvisualizeshigh-dimensionaldataintwo di-mensions.
Model-based clustering is a distribution-based technique in which a mixture of Gaussian distributions is fitted to the data.Each mixtureisa cluster, andthegroup membership isestimatedusingamaximumlikelihoodalgorithm. SOTA is an unsupervised algorithm witha divisivetree
struc-ture.
The validation measures take only the dataset and the clus-teringpartition asinput,anduseintrinsicinformationwithinthe data to assess the quality of the clustering. We select measures thatreflectthecompactness,connectedness,andseparationofthe cluster partitions(internal validationindices). Connectednessis a local concept of clustering based on the idea that neighbouring data items should share the same cluster, andis here measured by the connectivity index (Handl, Knowles, & Kell, 2005). Com-pactness assesses the cluster homogeneity, usually by looking at the intra-cluster variance, whereas separation quantifies the de-greeofseparationbetweenclusters(usuallybymeasuringthe dis-tancebetweencluster centroids). Because compactnessand sepa-ration demonstrate opposing trends (compactness increaseswith thenumberofclustersbutseparationdecreases),popularmethods combine the two measures into a single score. The Dunn index
(Dunn, 1974) and silhouette width (Rousseeuw, 1987) are
exam-plesofnonlinearcombinationsofthecompactnessandseparation. Severaltestswere completedusingtheR software.The clustering algorithms andvalidationmeasures (with2–9clusters)generated the optimalscorespresentedin Table1.Three differentsolutions were obtainedusing the three validation indexes. Thisis a typi-calresult:differentmethodsproducedifferentnumbersofclusters selectedbydifferentvalidationindexes.
These results should be examined carefully. With respect to the connectivityindex(wheresmallernumbers arebetter), Fig.3
showsthe complete test results.Low cluster numbers (2–5 clus-ters) give a positive outcome. Diana and the hierarchical algo-rithmsperformedwell with2–9clusters, whereas thePAM algo-rithmattainedalocalminimumwithtwoclusters.
HighervaluesoftheDunnindexarebetter.Thisindexindicates goodperformancewithfourclusters, particularlywiththe hierar-chical and Diana algorithms (Fig. 4). K-means with four clusters alsoperformedwell. TheDianaalgorithmgivesthebestselection withsevenclusters.
Similarly,highervaluesofthe silhouetteindexarebetter. This indexsuggeststhatmostalgorithmsachievedoptimalperformance withthreeclusters,althoughSOMandmodel-basedclusteringdid notperformwellinthistest(Fig.5).
Insummary, the three validity indexes indicatethat the hier-archicalalgorithmachievesgoodperformance withalow number ofclusters.Companyexpertsconsiderthatthisdatasamplecanbe correctlyrepresented by a low number of clusters. Based on the expertsreports,thenineclustersthattheDianaalgorithmselected fortheDunnindexwereexcessiveforthisselection.
5. Clustervalidationbycompanyexpertsandclassification Hierarchical clustering consistently performs well for most of thevalidationmeasures.Here, weextract theresultsfrom hierar-chicalclustering,plottheresultingdendrogram,andviewthe ob-servationsthataregroupedtogetheratvariouslevelsofthe topol-ogy. As suggestedby the company experts, two clusters isnot a desirableresult,asonlynightanddaywillbedifferentiated.Thus, three clusterswere formed. The dendrogram is plottedin Fig. 6, andthemeannumberoffeatures per cluster islistedin Table2. Furtherinspection oftheresultswasconductedby asubject mat-terexpert.
Finally, the plots of the mean LOESS curves per group allow usto understandthe cluster significance.Experimental outcomes shown insightful implications of customers’ behaviour. Thus, the first cluster (Cluster 1, 28 customers) corresponds to night-time consumption customer. Therefore may involve that most of this energyconsumption isused forlighting, andas such thereis no essential difference between working and non-working days, as showninFig.7.
Thesecondandthirdclusters(134customersand56customers, respectively)correspondtodaytimeconsumptiongroups.They dif-ferinthenumberofmorningconsumptionpeaksandthenumber
Fig.4. Internalvalidation:Dunnindex.
Fig.5. Internalvalidation:Silouetteindex.
Table2
Meanfeaturespercluster&group,3clusters.
Group NMoP NNP NAP NMiV NNH NLcNh NLcMh NLcAh 1 0.79 1.65 0.59 0.69 7.59 0.14 2.65 0.17 2 1.59 1.16 0.92 0.03 0.75 0.16 0.07 0.02 3 1.70 0.12 0.96 0.48 0.07 7.32 0.28 0.86
ofhours withhighconsumption.Cluster3exhibitslow consump-tionon Sundays, Saturdayevenings,andholidays (Figs. 8and9). Thus,companyexpertsupposethatcluster2correspondstoa do-mesticcustomers, andcluster 3involves a commercial consump-tion.
For the purpose of classification, classification and regression trees(CARTs)can be usedasan alternativeto logistic regression. Recursivepartitioning,whichbuildsthemodelina forward step-wisesearch, isapopularCART methodthatcan beused to com-putethe probability ofbeing inanyhierarchical group. Although thisapproachisknown tobe an efficientheuristic,the resultsof recursivetreemethodsare onlylocallyoptimal,assplits are cho-sento maximize homogeneityat the next step only. An
alterna-tivemeansofsearchingtheparameterspaceofthetreesistouse globaloptimizationmethodssuchasevolutionaryalgorithms.Such approachescanbeusedtoreducetheaprioribias.Intheproposed framework, globallyoptimalCARTs are implemented,andthe re-sultsareshowninFig.10.
Nodes5&6include28customers,allofwhombelongto clus-ter1.Theassociatedruleis: N LcN H <5&
(
NLcMH ≥5or NLcMH < 5&N cN H ≥7)
. Node 4 includes 134 customers,all of whom be-long to cluster 2. The associated rule is: N LcN H <5&NLcMH <5&N cN H <7.Node 7 include56 customers,all of whom belong tocluster3.Theassociatedruleis: NLcNH ≥5.Asshown,the clas-sificationmethodemployed herecorrectlyclassifiesthecustomers andclusters.
Fig.6. Clusterdendogram,forthreeclusters.
Fig.8. Cluster2.MeanLOESScurve,workingandno-workingdays.
6. Conclusion
Clustering is an unsupervised machine learning technique widelyusedto:
• Understanding market strategies.E.g.,Lorentz,Hilmola,
Malm-sten, and Srai (2016) uses clustering to detect small and
mediumsizeenterprises?(SME)manufacturingstrategy.
• Improvingtheefficiencyofaservice.E.g.,clusteringtechniques wereutilizedforimprovingtheefficiencyofahospital’sservice andofthemaintenance tasksinaclinical engineering
depart-ment(Cruz,2013).
• Discovering association in differentmarkets. E.g., in Dias and
Ramos(2014),theenergytimeseries(crudeoil,naturalgasand
electricityprices)areclusteredintohomogeneousgroupsbased ontheirstatedynamic.
• Customer grouping. In Ho, Ip, Lee, and Mou (2012), a robust genetic algorithm (GA) based k-means clusteringalgorithm is proposedinattempttoclassifyexistingcustomersofthe enter-prise into groupswith considerationof relevantattributes for thesake ofobtaining desirablegroupingresultsinan efficient manner.
Differentiate exiting customers with common features into smaller groups can serve as a piece of useful reference for
decision-making.Themainobjectiveofthispaperwastodescribe a completeframework fortheautomatic classificationof electric-itycustomers loads. The clusteringof electricity loadcurves is a topicofsignificantinterest,butseveralstepsdescribedinthis pa-per have not been adequately covered in the literature. Authors usually selector propose a specific clustering classification algo-rithm, andcomparetheir resultswithother solutions (Tsekouras,
Hatziargyriou, & Dialynas, 2007; Zhang, Zhang,Lu, Feng, & Yang,
2012).Thisisprobablythemain strengthofthispaper:the algo-rithmselection phasethat doesnotassume anyapriorisolution. The reasonisthat the particularsolution will dependon the se-lectedsample,becausedifferentcustomercategorieshavevery dif-ferentconsumptionpatterns,andnosimplealgorithmcanidentify theoptimumforallmixturesofcustomers.
Theuseofacompletesetofvalidationindexesthatreflectthe connectedness (connectivity index), compactness, and separation (Dunnandsilhouetteindexes)oftheclusteringpartitionisanother innovative step inthe proposed framework. Theinterpretation of partialresultswouldbesimilartothatgivenbyacompanyexpert. In thissense, localoptima of theindexes wouldbe avoided. The evolutionofallindexesshouldbecarefullystudiedandthe exper-tiseofelectricitycompaniesconsidered.
This research method is actually in the test phase. Real data from a medium-size electricity company located in the south of
Fig.9. Cluster3.MeanLOESScurve,workingandno-workingdays.
Spain have been used. Results are promising, but more practical testareneeded.
The proposed framework also includes a classification phase that allows new customers to be assigned to a predefined clus-ter. Thisphase is usefulforinterpreting the resultsand convinc-ingcompanyexpertsofthequalityandpragmatismofthemining framework.Thehighaccuracyofourresultssupportstheproposed framework.Thereductionofanyaprioribiascanbeimplemented using an evolutionary algorithm that provides a global optimiza-tionmethod.
Futureendeavours ofthiswork are directedtoward the inclu-sion of thiswork asa part of a dataanalysis framework forthe telemetry and management of electricity distribution companies. In future research, this clustering framework will be applied to generatetheinputtoanon-technicallosses(NTLs)modelinpower systemsanalysis.NTLsarecausedbyactionsexternaltothepower system,suchaselectricitytheft,non-paymentbycustomers,or er-rorsinaccounting.NTL detectionrequiressuperviseddatamining andlearning,andtheclusteringresultsdescribedinthispaperwill providenewandinterestinginformation.
Futureendeavours ofthiswork are directedtoward the inclu-sion of thiswork asa part of a dataanalysis framework forthe
telemetry andmanagement of electricity distribution companies. Infutureresearch,thisclusteringframeworkwillbeapplied:
• To generate the input to a non-technicallosses (NTLs) model inpowersystemsanalysis.NTLsarecausedbyactionsexternal tothepowersystem,suchaselectricitytheft, non-paymentby customers, orerrorsin accounting. NTL detectionrequires su-pervised data mining and learning, and the clustering results describedinthispaperwillprovidenewandinteresting infor-mation.
• To investigate the economical aspects related to the possible tariff diversificationforthevariouscustomerclasses.Load pro-fileswouldbe usedforprovidingsuggestionsonpossible mar-ketstrategiesseenfromthepointofviewoftheelectricity util-ity.
• To differentiate exiting electric customers with common fea-tures into smaller groups. The acquired knowledge will be a usefulreferencefordecision-making.
• To contribute to the power grid information. The future of power grids is expected to involve an increasing level of in-telligenceandintegrationofnewinformationand communica-tiontechnologiesineveryaspectoftheelectricitysystem,from
Fig.10.ClassificationTree.
demand-side devicestowide-scale distributedgeneration toa varietyofenergymarkets(Coll-Mayor,Paget,&Lightner,2007).
Acknowledgements
The work supporting this paper was funded by the projects “SIIAM: Sistema Inteligente Inalámbrico para Análisis y Moni-torización de líneas de tensión subterráneas en Smart Grids” (TEC2013-40767-R, Proyects R&D+I - Spanish State Program for Research, Development and Innovation. Wireless Intelligent Sys-tem for the Analysis and Monitoring of voltage underground linesin Smart Grids)and “TLG2: Plataforma de análisis de datos de Telemedida y Telegestión en Distribuidoras Eléctricas” (IDI-20150044,Data Analysis Framework forthe Telemetry and Man-agementinElectricityDistributionCompanies).Theauthorswould like to thank Isotrol Company, especially J. García Franquelo, for their contribution regardingsmart meter data; Jesús Váquez and AliciaValverde fortheir assistancewiththe smart meter dataset handling.
We sincerely thank reviewers for constructive criticisms and valuablecomments.Accordingly,the revisedmanuscripthasbeen improved withnew information about strengths, impact, signifi-canceandnoveltyofthepaper.
AppendixA. Featuresforclustering
After datanormalization, inwhicheach registeredhourly data point is divided by the maximum consumption during the sam-pleperiodforthatcustomer,weobtainLOESScurvesforeach
cus-tomer.Thedatafeaturesusedfortheclusteringprocessareas fol-lows:
A1. Features that count peaks or valleys throughout the specified time frame
NumberofMorningPeaks(NMoP).Countthenumberof morn-ing peaksonthecustomer’sLOESS curve(from 8to 13h). Peaks are defined aspointsgreater than 10% of the minimum normal-ized consumption registered value (≥ 0.1). Number of Afternoon Peaks (NAP). Count the number of afternoon peaks on the cus-tomer’sLOESScurve(from16to21h).Peaksaredefinedaspoints greaterthan 10% oftheminimumnormalizedconsumption regis-teredvalue(≥0.1).
NumberofNightPeaks(NNP).Countthenumberofnightpeaks onthecustomer’sLOESScurve(from22to7h).Peaksaredefined aspointsgreaterthan10%oftheminimumconsumptionregistered value(≥0.1).NumberofMiddayValleys(NMiV). Countthe num-berofmiddayvalleys.Thisfeaturedetectslowconsumptionduring middayrelaxationhours (from14to20h), usuallyincommercial andindustrial customers.Peaks are definedas pointslower than 10%oftheminimumconsumptionregisteredvalue(≤0.1). A2. Features that count high or low consumption hours throughout the specified time frame
NumberofHighconsumption Nighthours (NHcNh).Countthe numberof night hours withhighconsumption (from 24to 7 h). High consumptionhours arethose forwhichthecustomer’s con-sumption is greater than 60% of the maximum registered
con-sumption(≥0.6). Numberof Lowconsumption Nighthours (NL-cNh). Count the number of night hours with low consumption (from24to7h). Lowconsumption hoursarethoseforwhichthe customer’s consumption islower than 10% of themaximum reg-isteredconsumption (≤0.1).NumberofHigh consumption Morn-inghours(NHcMh).Countthenumberofmorninghourswithhigh consumption(from10to14h).Highconsumptionhoursarethose forwhich thecustomer’sconsumption isgreater than60% ofthe maximum registered consumption (≥ 0.6). Number of Low con-sumptionMorning hours(NLcMh).Countthe numberofmorning hours withlow consumption(from10to14h).Lowconsumption hours are those for which the customer’s consumption is lower than10%ofthemaximumregisteredconsumption(≤0.1).Number ofLowconsumption Afternoonhours(NLcAh). Countthenumber ofafternoonhours withlowconsumption (from19to21 h).Low consumption hours arethose forwhichthe customer’s consump-tionislowerthan10%ofthemaximumregisteredconsumption(≤ 0.1).
References
Azadeh,A.,Saberi,M.,&Seraj,O.(2010).Anintegratedfuzzyregressionalgorithm forenergyconsumptionestimationwithnon-stationarydata:Acasestudyof Iran.Energy,35(6),2351–2366.
Benítez,I.,Quijano,A.,Díez,J.-L.,&Delgado,I.(2014).Dynamicclustering segmen-tationappliedtoloadprofilesofenergyconsumptionfromspanishcustomers.
InternationalJournalofElectricalPower&EnergySystems,55,437–448. Brock,G.,Pihur,V.,Datta,S.,&Datta,S.(2008).clvalid:AnRpackageforcluster
validation.JournalofStatisticalSoftware,25(1),1–22.
Carpaneto, E., Chicco,G., Napoli, R., &Scutariu, M.(2006). Electricity customer classificationusingfrequency-domainloadpatterndata.InternationalJournalof ElectricalPower&EnergySystems,28(1),13–20.
Chicco,G.(2012).Overviewandperformanceassessmentoftheclusteringmethods forelectricalloadpatterngrouping.Energy,42(1),68–80.
Chicco, G.,Napoli,R., &Piglione,F.(2006).Comparisonsamong clustering tech-niquesforelectricitycustomerclassification.IEEETransactionsonPowerSystems, 21(2),933–940.
Chicco,G.,Napoli,R.,Piglione,F.,Postolache,P.,Scutariu,M.,&Toader,C.(2004). Loadpattern-basedclassificationofelectricitycustomers.IEEETransactionson PowerSystems,19(2),1232–1239.
Coll-Mayor,D.,Paget,M.,&Lightner,E.(2007).Futureintelligentpowergrids: Anal-ysisofthevisionintheeuropeanunionandtheUnitedStates.EnergyPolicy, 35(4),2453–2465.
Cruz,A.M.(2013).Evaluatingrecordhistoryofmedicaldevicesusingassociation discoveryand clusteringtechniques. ExpertSystemswithApplications, 40(13), 5292–5305.
Diamantoulakis,P.D.,Kapinas,V.M.,&Karagiannidis,G.K.(2015).Bigdataanalytics fordynamicenergymanagementinsmartgrids.BigDataResearch,2(3),94–101. Dias, J. G., & Ramos, S. B. (2014). Dynamic clustering of energy markets: An extended hidden markov approach. Expert Systems with Applications, 41(17), 7722–7729.
Dunn,J.C.(1974).Well-separatedclustersandoptimalfuzzypartitions.Journalof Cybernetics,4(1),95–104.
Dzobo,O.,Alvehag,K.,Gaunt,C.,&Herman,R.(2014).Multi-dimensionalcustomer segmentationmodelforpowersystemreliability-worthanalysis.International JournalofElectricalPower&EnergySystems,62,532–539.
Fang,B.,Yin,X.,Tan,Y.,Li,C.,Gao,Y.,Cao,Y.,&Li,J.(2016).Thecontributionsof cloudtechnologiestosmartgrid.RenewableandSustainableEnergyReviews,59, 1326–1331.
Ferreira, A. M. S., deOliveira Fontes, C. H., Cavalcante, C.A. M. T., & Maram-bio,J.E.S.(2015).Patternrecognitionasatooltosupportdecisionmakingin themanagementoftheelectricsector.partii:Anewmethodbasedon cluster-ingofmultivariatetimeseries.InternationalJournalofElectricalPower&Energy Systems,67,613–626.
Figueiredo,V.,Rodrigues,F.,Vale,Z.,&Gouveia,J.B.(2005).Anelectricenergy con-sumercharacterizationframeworkbasedondataminingtechniques.IEEE Trans-actionsonPowerSystems,20(2),596–602.
Granell,R.,Axon,C.J.,&Wallom,D.C.(2015).Clusteringdisaggregatedloadprofiles usingadirichletprocessmixturemodel.EnergyConversionandManagement,92, 507–516.
Grigoras,G.,&Scarlatache,F.(2014).Knowlegdeextractionfromsmartmetersfor consumerclassification.InElectricalandpowerengineering(EPE),2014 interna-tionalconferenceandexposition(pp.978–982).
Hafen,R.,Gibson,T.,vanDam,K.K.,&Critchlow,T.(2014).Chapter1-powergrid dataanalysiswithRandhadoop.InY.Zhao,&Y.Cen(Eds.),Datamining appli-cationswithR(pp.1–34).Boston:AcademicPress.
Halkidi,M.,Batistakis,Y.,&Vazirgiannis,M.(2001).Onclusteringvalidation tech-niques.JournalodIntelligentInformationSystems,17(2),107–145.
Halkidi,M.,&Vazirgiannis,M.(2008).Adensity-basedclustervalidityapproach us-ingmulti-representatives.PatternRecognitionLetters,29(6),773–786. Handl,J., Knowles,J., & Kell,D. B. (2005). Computational clustervalidation in
post-genomicdataanalysis.Bioinformatics,21(15),3201–3212.
Ho,G.,Ip,W.,Lee,C.,&Mou,W.(2012).Customergroupingforbetterresources allocationusingGAbasedclusteringtechnique.ExpertSystemswithApplications, 39(2),1979–1987.
Lee,S.,Kim,G.,&Kim,S.(2011).Self-adaptiveanddynamicclusteringforonline anomalydetection.ExpertSystemswithApplications,38(12),14891–14898. López,J.J.,Aguado,J.A.,Martín,F.,noz,F.M.,Rodríguez,A.,&Ruiz,J.E.(2011).
Hopfield?k-meansclustering algorithm:A proposal for the segmentation of electricitycustomers.ElectricPowerSystemsResearch,81(2),716–724. Lorentz,H.,Hilmola,O.-P.,Malmsten,J.,&Srai,J.S.(2016).Clusteranalysis
applica-tionforunderstandingSMEmanufacturingstrategies.ExpertSystemswith Appli-cations,66,176–188.
Mallat,S.G.(1989).Atheoryformultiresolutionsignaldecomposition:thewavelet representation.IEEETransactions onPatternAnalysisandMachineIntelligence, 11(7),674–693.
Ramos,S.,Duarte,J.M.,Duarte,F.J.,&Vale,Z.(2015).Adata-mining-based method-ologytosupportMVelectricitycustomers’characterization.Energyand Build-ings,91,16–25.
Rasanen, T., Voukantsis, D., Niska, H., Karatzas, K., & Kolehmainen, M. (2010). Data-basedmethodforcreatingelectricityuseloadprofilesusinglargeamount ofcustomer-specifichourlymeasuredelectricityusedata.AppliedEnergy,87(11), 3538–3545.
Rousseeuw,P.J.(1987).Silhouettes:Agraphicalaidtotheinterpretationand vali-dationofclusteranalysis.JournalofComputationalandAppliedMathematics,20, 53–65.
Shyam,Ganesh,B.,Kumar,S.,Poornachandran,P.,&Soman(2015).Apachesparka bigdataanalyticsplatformforsmartgrid.ProcediaTechnology,21,171–178. Tsekouras,G.J.,Hatziargyriou,N.D.,&Dialynas,E.N. (2007).Two-stagepattern
recognitionofloadcurvesforclassificationofelectricitycustomers.IEEE Trans-actionsonPowerSystems,22(3),1120–1128.
Tuballa,M.L.,&Abundo,M.L.(2016).Areviewofthedevelopmentofsmartgrid technologies.RenewableandSustainableEnergyReviews,59,710–725. Xu,R.,&Wunsch,D.(2005).Surveyofclusteringalgorithms.IEEETransactionson
NeuralNetworks,16(3),645–678.
Zhang,T.,Zhang,G.,Lu,J.,Feng,X.,&Yang,W.(2012).Anewindexand classi-ficationapproachforloadpatternanalysisoflargeelectricitycustomers.IEEE TransactionsonPowerSystems,27(1),153–160.
leZhou,K.,linYang,S.,&Shen,C.(2013).Areviewofelectricloadclassification insmartgridenvironment.RenewableandSustainableEnergyReviews,24,103– 110.