Dynamic Power Control and Optimization Scheme
for QoS-Constrained Cooperative Wireless Sensor
Networks
Ziqiang Feng, Ian Wassell Computer Laboratory University of Cambridge, UK Email:{zf232, ijw24}@cam.ac.uk
Abstract—Cooperative transmission can significantly reduce the power consumption associated with long distance transmission in wireless sensor networks (WSNs). In this paper, we analyze the optimal power consumption of cluster-based multi-hop trans-mission for a cooperative WSN. With specific Quality of Service (QoS) constraints on delay and channel capacity, we show that the power optimization problem of the whole network has no closed-form solution in a slow flat Rayleigh fading environment. Thus we propose a dynamic power control and optimization (DPCO) scheme that can jointly determine the optimal number of cooperative sensors and their transmission power. We further propose a channel approximation algorithm that can significantly reduce the computational complexity of the DPCO scheme.
I. INTRODUCTION
Energy optimization is an important issue in wireless sensor networks (WSNs) where the low-power sensors are expected to operate for many years without battery replace-ment. Furthermore, certain applications may have Quality of Service (QoS) requirements on delay and channel capacity. For instance, it is important for the sink node to receive data in a timely manner in an industrial control system [1]. Traditional energy optimization techniques may not always guarantee the QoS requirements in WSNs, especially in fading environments. It has been proved that multi-antenna system use less ener-gy for data transmission in fading channels compared to single-antenna systems [2]. However, a multi-single-antenna system requires complex transceiver circuits that are not practical for low-cost wireless sensors. Cooperative multiple-input-multiple-output (MIMO) [3] and virtual MIMO techniques [4] are proposed to enable MIMO techniques to be utilized in WSNs. For the single-hop cooperative MIMO systems analyzed in [3], it is shown that for long-distance transmission, they are more energy efficient compared to a single-antenna system. In [5], multi-hop cooperative MIMO channels are analyzed, where the design target is to minimize the outage probability given an energy constraint and target outage channel capacity. However, the minimum outage probability may not give the maximum average outage channel capacity [6]. Minimizing the outage probability may also lead to full-power operation which sig-nificantly decreases the lifetime of the WSN.
In this paper, we investigate the energy consumption in a cluster-based multi-hop cooperative WSN with QoS re-quirements on delay and channel capacity. We mainly focus on the physical layer optimization and we assume that the
clustering and routing problems are handled by upper layers. The multi-hop transmission consists of several single-hop cluster-to-cluster transmissions. Each single-hop transmission consists of three phases, namely the Preparation Phase (PP), the Broadcast Phase (BP) and the Cooperation Phase (CP). In the PP, the cluster head of the transmitter cluster calculates the transmission power to be used in the BP and CP. In the BP, the cluster head broadcasts the data along with the power control message in the transmitter cluster. In the CP, all nodes of the transmitter cluster that received the data successfully in the BP cooperatively transmit the data to the cluster head of the receiver cluster through a multiple-input-single-output (MISO) channel. For intra-cluster transmission in the BP, we assume that all nodes in the cluster have perfect transmit and receive channel state information (CSI). For inter-cluster transmission in the CP, we assume that nodes in the receiver cluster know the CSI and that nodes in both clusters know the distribution of the CSI. Note that our MISO approach can be extended to a MIMO approach by utilizing selection diversity in the receiver cluster [5].
To minimize the total energy consumption, we propose a dynamic power control and optimization (DPCO) scheme that can optimize the total energy consumption without violating the QoS requirements. Given the number of cooperative n-odes as an input condition, the scheme first calculates the conditional optimal power consumption using the dynamic power control (DPC) algorithm. Then it determines the optimal number of cooperative sensors using the results of conditional optimal power consumption. We show that the DPC algorithm converges to the optimum inO(1)iterations. We further pro-pose a channel approximation algorithm that can significantly reduce the computational complexity of the DPCO scheme.
The rest of the paper is organized as follows: Section II describes the system model of the multi-hop cluster-based cooperative WSN and expresses the QoS requirements. The DPCO scheme is proposed in Section III. We further propose an approximation algorithm to reduce the computational com-plexity of the DPCO scheme. Section IV shows the simulation results of the proposed scheme. Finally, we conclude the paper in Section V.
II. SYSTEMMODEL
We consider a multi-hop cluster-based WSN. The trans-mission between two adjacent clusters is defined as a
single-&OXVWHU
&OXVWHUKHDG &RRSHUDWLYHVHQVRU ,QDFWLYHVHQVRU 6LQN
&OXVWHU
&OXVWHU1 &OXVWHU1
6RXUFH
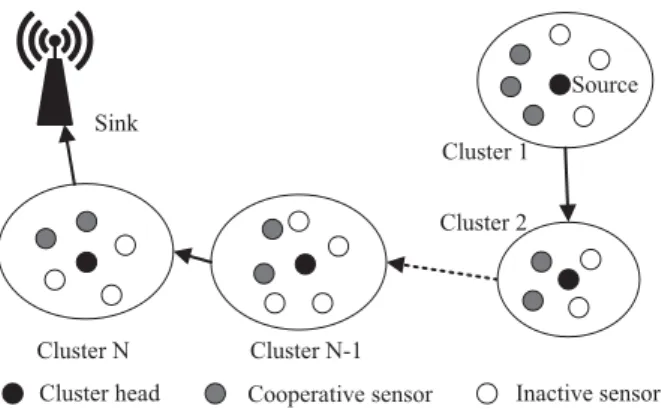
Fig. 1. Multi-hop cluster-based cooperative wireless sensor network
hop transmission. In our model, we assume that the nodes are grouped intoN clusters and we haveN−1hops during the transmission. The routing path is predefined. Before the transmission, each cluster selects a node as its cluster head. Efficient clustering and routing algorithms such as those in [7], [8] can be used. The cluster head of cluster 1 is assumed to be the source node. The system model of the cooperative WSN is shown in Fig. 1.
A. Transmission Scheme
The transmission between adjacent clusters has three phas-es, namely the preparation phase (PP), the broadcast phase (BP) and the cooperation phase (CP). The time duration of the three phases are λ1T, λ2T and λ3T respectively where λ1+λ2+λ3= 1andT is the time duration of each single-hop transmission. We assume that each cluster containsnsensors that are uniformly deployed in the cluster and the cluster head is located near the center of the cluster.
1) Preparation Phase: In the PP, the cluster head in the transmitter cluster calculates the optimal number of coopera-tive nodes (ntr), the transmission power in the BP (Pbt) and
CP (Pct) using the DPCO scheme. The value ofntr,Pbt and
Pctare carried in the power control message and sent to other cooperative nodes along with the data in BP.
2) Broadcast Phase: In the BP, the cluster head broadcasts the data along with the power control message to the coopera-tive sensors within its cluster with powerPbt. The sensors that received the data successfully are selected to transmit with the cluster head in the CP. Since we assume that the sensors in the cluster are uniformly deployed and the cluster head is located in the center of the cluster, the number of the active sensors is proportional toPbt and the total number of sensorsnin each cluster. By selecting an appropriate level of Pbt to broadcast the data, we can have ntr nodes selected as the cooperative nodes (including the cluster head itself) in the CP.
3) Cooperation Phase: In the CP, the cooperative nodes jointly transmit the data to the cluster head in the receiver cluster using an orthogonal Space-Time Block Code (STBC). We assume that the number of cooperative nodes is ntr, including the cluster head itself. The total transmission power Pct is equally divided among the cooperative nodes. The transmission power used by each sensor is consequently Pct
ntr.
B. QoS Requirements
We consider a multi-hop cluster-to-cluster communication scheme containingNclusters (see Fig. 1). We assume the clus-ter head is located in the cenclus-ter of each clusclus-ter. The distance between the centers of two adjacent clusters is denoted by d. We also assume long-range transmission between adjacent clusters since cooperative transmission is more energy efficient in that case [3]. Therefore the distances between the sensors in the adjacent clusters are approximately equal. We modeled the channel in the BP and CP using the additive white Gaussian noise (AWGN) channel and slow flat Rayleigh fading channel with AWGN respectively, since the inter-cluster distance is much larger than the intra-cluster distance [3].
Without loss of generality, we consider the transmission between clustermand clusterm+1. In the CP, the cooperative sensors jointly transmit the data to the next cluster head using STBC through a MISO channel. The received signal at the cluster head of cluster m+ 1is given by:
Ym+1=√ΛHXm+Nm+1 (1)
where Λ =βd−α is the path loss,β is the path loss constant
related to the channel and antennas (i.e., the wavelength of the signal and the antenna gain) and αis the path loss exponent. The elements of the1×ntrchannel vectorH are independent identical distribution complex Gaussian random variables with zero mean and unit variance. Xm is the ntr×l transmitted signal with transmission power Pct
ntr, wherel is the length of
the STBC. Nm+1 ∼ N0, σ2 is the l ×1 AWGN at the receiver. The transmission power of the transmitted space-time codeword is Pct
ntr per node.
Considering the nodes in the transmitter cluster only know the distribution of the CSI, the outage capacityCout[bps/Hz] of the CP is defined as [6]:
Cout=λ3log2(1 +γout), (2)
where γout is the minimum signal-to-noise ratio (SNR) for successful decoding at the receiver side. The outage probability poutis defined as:
pout= Pr (γ < γout), (3) where γ is the actual SNR at the receiver side. According to our channel model in (1),γ is given by:
γ= ΛPctH
2
F
ntrσ2 , (4)
where σ2 is the noise power and H2F is the squared Frobenius norm of the1×ntrchannel vectorH. According to the definition ofH,H2F ∼χ2(2ntr)is a chi-square variable with2ntr degrees of freedom.
The average outage capacity is given by:
¯
Cout= (1−pout)Cout=λ3(1−pout) log2(1 +γout). (5) 1) Delay Requirement: We consider the delay of the multi-hop cluster-to-cluster communication using an automatic re-peat request (ARQ) protocol. We assume that the outage probabilities are equal in each of the N−1 hops. Therefore,
for transmission through N−1 hops, the number of failures k follows the negative binomial distribution:
k∼N B(N−1;pout). (6)
The probability mass function of the negative binomial distri-bution is f(k;N−1, pout) = k+N−2 k pkout(1−pout)N−1. (7) Proposition 1: Given the delay requirementD, the average delay of the transmission through N−1hops is given by:
¯
T =E[(k+N−1)T] = (N−1)T
1−pout . (8) Thus we can have reliable transmission ifpout≤1−(N−D1)T for any delay requirementD >(N−1)T. IfD≤(N−1)T, it is impossible to have reliable transmission under the delay requirement.
Proof: We first prove that E[k] = (N−1)pout
1−pout . Since the
number of failureskfollows the negative binomial distribution, the mean value ofkcan be calculated as:
E[k] = ∞ k=0 kf(k;N−1, pout) = ∞ k=0 k(k+N−2)! k! (N−2)! p k out(1−pout)N−1 = (N−1)pout 1−pout ∞ k=1 (k+N−2)! (k−1)! (N−1)!p k−1 out(1−pout)N = (N−1)pout 1−pout ∞ k=0 f(k;N, pout) (9) = (N−1)pout 1−pout .
Note that in (8)NandT are constants. Thus the average delay is given by:
¯
T =E[(k+N−1)T] = (N−1)T
1−pout . (10) For any delay requirement D > (N−1)T, we must have
¯
T = (1N−−p1)T
out ≤D and thus pout≤1−
(N−1)T
D to satisfy the
reliable transmission requirement. Note that0< pout<1. If D≤(N−1)T, we should havepout≤1−(N−D1)T ≤0for reliable transmission, which is impossible to satisfy.
2) Capacity Requirement: We assume that there are a total of L bits for transmission. In order to have reliable transmission in the CP, we have
L
T ≤Rct≤
¯
Cout, (11)
where Rct[bps/Hz] is the transmission data rate in the CP. In the BP, the transmission data rateRbt [bps/Hz] should be no less than the transmission data rate in the CP. Thus we have
Rbt≥Rct≥ L
T. (12)
Proposition 2: For any transmission under the QoS re-quirement and D > (N−1)T, there exists p∗out that can maximize C¯out, which can be denoted as follows
¯
Cout∗ = max
pout {λ3
(1−pout) log2(1 +γout)} s.t. C¯out≥ L
T,0< pout≤1−
(N−1)T D
(13) whereγout= ΛPctF−1(pout|2ntr)
ntrσ2 andF−1(p|v)is the inverse
chi-square cumulative distribution function (CDF) for a given probabilitypand vdegrees of freedom.
Proof: From (2), (3) and (5), we know that F−1(p|v) is directly proportional to p for any given v. Let ξ = F−11−N T
D |2ntr
. Forpout∈0,1−(N−D1)T, we have
lim pout→0 ¯ Cout= 0, lim pout→1−NTD ¯
Cout=λ3(1−pout) log21 +ΛPctξ
ntrσ2 (14)
Since lim
pout→1−NT D
¯
Cout > 0 and (5) is continuous at pout ∈
0,1−(N−D1)T
, according to the extreme value theorem, there exists pout∈
0,1−(N−D1)T
that can maximizeC¯out.
C. Energy Consumption Analysis
For the transmission in each hop, the total power consump-tion is given by:
Pt=λ1PDP CO+λ2Pbt+λ3Pct+ntrPcir, (15) wherePDP COis the power consumption of the DPCO scheme in the PP,Pcir is the circuit power consumption of the sensor and ntr is the number of sensors used for transmission. The total energy consumption for the transmission through N−1 hops is give by:
Et=PtT¯= (N−1)PtT
1−pout . (16)
In the BP, we assume the channel is AWGN with free space path loss (i.e., α= 2). Thus given the transmission data rate Rbt, we have
Pbt=r2σ22Rbtλ2 −1 , (17) whereris the intracluster transmission range. We assume that the average cluster range is rc and n sensors are normally deployed in each cluster. Therefore the approximate number of sensors that can successfully decode the broadcast message is given by: ntr= r rc 2 n= Pbtn r2cσ22Rbtλ2 −1 . (18)
In the CP, a slow flat Rayleigh fading channel is assumed in the channel model. From (4) and (5), we have
Pct= γoutntrσ 2 ΛF−1(pout|2ntr)= 2λ3(1Cout¯−pout)−1 ΛF−1(pout|2ntr)ntrσ 2. (19)
From (19), we can see that there is no closed-form solution for cooperative transmission power. In the next section, we propose a dynamic power control and optimization (DPCO) scheme to determine the optimal value of ntr, Pbt and Pct for the total energy consumption. We further propose an approximation algorithm for the DPCO scheme that can reduce its computational complexity.
III. DYNAMICPOWERCONTROL ANDOPTIMIZATION SCHEME
A. Scheme Description
For each single-hop transmission, the DPCO scheme is running in the PP. Given any QoS requirement with the delay D > (N−1)T, we aim to find the optimal value of Pct, Pbt, ntr and pout for each single-hop transmission and thus minimize the total energy consumption of the multi-hop transmission (16). Note that ntris directly related to Pbt given the value of Rbt in (18). Thus ntr and Pbt are jointly optimized. From Proposition 2 and (19), we know that given ntr, the transmission powerPct|ntr is directly proportional to the maximum average outage capacityC¯out∗ . According to the QoS requirement, we haveC¯out≥ L
T andpout≤1−(N−D1)T.
Pct|ntr is optimized whenpout(ntr) =p∗out(ntr)andC¯out∗ =
L
T. Therefore, Pct and pout are also jointly optimized. The
optimization problem can now be denoted as: Pct∗|n∗ tr, n ∗ tr = arg min Pct|ntr,ntr EtPct|ntr, ntr. (20)
Note that the value of Pct∗|n∗
tr depends on the choice of
n∗tr. However in order to determinen∗tr, we need to figure out Pct∗|ntr for every possiblentr.Pct|ntr andntr are interrelated with each other in the optimization process.
In the DPCO scheme, we first find the conditional optimal Pct∗|v for all possible v, which is given by:
Pct∗|v = arg min
Pct|v
EtPct|v|v,1≤v≤n
s.t. Pct,min≤Pct|v ≤Pct,max, (21) where Pct,min and Pct,max are the minimum and maximum value of Pct|v respectively.
Then we can determine the optimaln∗tr as n∗tr= arg min
v
EtvPct∗|v ,1≤v≤n. (22) We then have the optimalPct∗|n∗
tr,P ∗
bt|n∗tr and thus the optimal
Et∗ according to (15) and (16).
Since there is no closed-form solution for cooperative transmission power Pct|v, we use a dynamic power control (DPC) algorithm to find the conditional optimalPct∗|v. We will show that given any ntr=v,Pct|v converges to its optimum Pct∗|v with a sufficient small change δ inO(1)iterations.
In Algorithm 1, we use Pct|v,Imax as the approximation of Pct∗|v sincePct|v,Imax −Pct∗|v ≤ δ where δ is sufficient small. For energy saving purpose, there is no need to coop-eratively transmit the data if the QoS requirement cannot be fulfilled with the maximum transmission power Pct,max.
Algorithm 1 DPCO scheme
Initialization:n∗tr= 1,Et,min=∞,Pct|n∗
tr =Pct,max
foreachv∈Ω ={1,2, . . . , n} do
DPC algorithm initialization: Pct|v,0 =Pct,max, η0= 1, π0= Pct,max−Pct,min
M ,M∈Z+
for 1≤i≤Imax do
1) According to (13), calculateC¯out,i∗ using Pct|v,i−1. 2)ηi=sgnC¯out,i∗ − LTwhere sgn(·)is the signum function. 3)πi= min 3+ ηi−1ηi 4 ,1 πi−1. 4)Pˆct|v,i =Pct|v,i−1 −ηiπi. 5)Pct|v,i = max minPˆct|v ,i, Pct,max , Pct,min .
ifPct|v,i=Pct,max then
break the current for loop
end if end for
CalculateEt(v)using Pct|v ,Imax andv.
ifPct,min< Pct|v < Pct,max andEt(v)< Et,min then
Et,min=Et(v),n∗tr=v,Pct|n∗ tr =Pct|v end if end for ifPct|n∗ tr =Pct,max then
No possible transmission can fulfill the QoS requirement.
end if
Proposition 3: Givenntr=vin the DPC algorithm,Pct|v converges to Pct∗|v with a sufficient small changeδ in O(1) iterations and we can use Pct|v,Imax as the approximation of Pct∗|v.
Proof:IfPct,min< Pct|v < Pct,max ,Pct∗|v must fall into one of theMequal parts in interval[Pct,min, Pct,max]. We also notice thatπiwill not halve its value untilηi−1ηi=−1. Thus we haveM iterations at most beforeπihalves its value. After the first timeπi is decreased by half, it is easy to see that πi can only stay unchanged for two iterations at most. We define δ as
δ= π0
2K =
Pct,max−Pct,min
2KM (23)
where K is a positive integer that makes δ sufficient small compared with π0. According to the algorithm it is obvious thatPct|v ,i−Pct∗|v≤πi afterπifirst halves itself. Thus we havePct|v ,i−Pct∗|v≤δinO(M+ 2K) =O(1)iterations. Let Imax > M+ 2K and we can then usePct|v ,Imax as the approximation ofPct∗|v.
We assume that nsensors are normally deployed in each cluster with the cluster rangerc. Since the minimum value of Rbt is TL, givenntr = v, the optimal broadcast transmission powerPbt∗|v is denoted as
Pbt∗|v =
vrc2σ22λL2T −1
n . (24)
After we havePct∗|v andPbt∗|v for all possiblentr=v, we can determinen∗traccording to (22) and thus in turn determine Pct∗|n∗
tr andP
∗ bt|n∗tr.
B. Approximation Algorithm
To reduce the computational complexity in the DPCO scheme, we propose an approximation algorithm. Note that the computational complexity in DPCO scheme is mainly introduced by the DPC algorithm. The DPC algorithm is used for the optimization problem in (13) and (21) and there is no closed-form expression for F−1(p|v). If we can get an approximation ofF−1(p|v)which can be quickly evaluated, the computational complexity will be significantly reduced. Inspired by the work in [9], we estimate the MISO channel in our model using a Gaussian approximation.
SinceH2F in (4) follows a chi-square variable with2ntr degrees of freedom, we can calculate the mean value of γas:
μγ = ΛPct ntrσ2E H2F = 2ΛPct σ2 . (25)
We also calculate the variance of γas: σ2γ= Λ Pct ntrσ2 2 varH2F = 1 ntr 2Λ Pct σ2 2 . (26)
If we expand (2) in Taylor series at μγ we have Cout(γ) =λ3log2(1 +μγ)− ∞ k=1 λ3 kln 2 μ γ−γ 1 +μγ k . (27) According to (27) the second-order approximation for μC is given by μC=E[Cout]≈λ3log2(1 +μγ)− λ3 2 ln 2 σγ 1 +μγ 2 (28) where σγ2is the variance ofγ. Note that the approximation is only valid for |γ−μγ| < 1. If we expand Cout2 in a Taylor series, the second-order approximation for σC2 is given by:
σC2 =ECout2 −(E[Cout])2 (29) ≈ λ3 ln 2 2 σ2 γ (1 +μγ)2− σγ4 4(1 +μγ)4 .
We assume that the approximate channel capacity C˜out follows a normal distribution with a mean μC and a standard deviation σC, which is denoted as C˜out ∼ NμC, σ2C. We further define the outage probability p˜out for C˜out, which is given by: ˜ pout= PrC <C˜out = 1 2+ 1 2erf ˜ Cout−μC √ 2σC (30) where erf (·)is the error function. From (30) we have
˜
Cout=μC+√2σCerf−1(2˜pout−1) (31) where erf−1(·) is the inverse error function, which can also be defined in terms of the Maclaurin series.
erf−1(z) = √π 2 z+ π 12z3+ 7π2 480z5+· · · . (32)
The approximate average outage capacity is defined as
¯˜Cout= (1−p˜out) ˜Cout (33)
≈ 1−2p˜ μC+ π 2σC ˜ p+ π 12p˜3+ 7π2 480p˜5 Iteration Number 0 5 10 15 20 25 30
Cooperative Transmission Power, P
ct (mW) 40 60 80 100 120 140 160 180 ntr=1 ntr=2 ntr=3 ntr=6
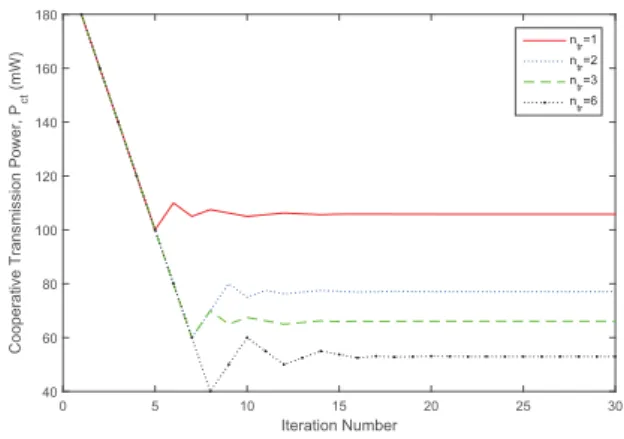
Fig. 2. Performance of the dynamic power control algorithm with different
ntr
where p˜= 2˜pout−1. Compared with (13), we can see that (33) is a polynomial function on p˜that has a straightforward solution for the optimization of¯˜Cout. If we substitute¯˜Cout for C¯out and p˜out for pout respectively, the computational complexity in the first step of the DPC algorithm can be significantly reduced.
IV. SIMULATION ANDANALYSIS
In this section, we give the simulation results to show the efficiency of DPCO scheme. We also show that the approxi-mation algorithm provides accurate channel estiapproxi-mations. The parameters in the simulation are given in TABLE I.
TABLE I. PARAMETERS FOR SIMULATION
Symbol Description Value
β Path loss constant 1
α Path loss exponent 2
n Number of sensors per cluster 10
d Transmission distance 100 m
rc Cluster range 10 m
σ2 Noise power 5μW
Pct,max Maximum ofPct 200 mW
Pct,min Minimum ofPct 0 mW
π0 Initial step in DPC algorithm 10 mW Pcir Circuit power consumption 10 mW
L
T Capacity Requirement 1 bps/Hz
λ1,λ2,λ3 0.1, 0.15, 0.75
First, we investigate the DPC algorithm. We setM = 20 and π0 = 10 mW. Given different ntr = v, the simulation results in Fig. 2 show thatPct|v converges to its optimal value Pct∗|v with sufficiently small difference in a limited number of iterations (Imax = 30). Note that the optimal cooperative
transmission power Pct∗|n
tr is inversely proportional to the
number of cooperative sensorsntr.
In Fig. 3 we show that under the QoS requirement, there exists the optimal outage probability p∗out that can maximize the average outage capacityC¯out. Givenntr= 6, Fig. 3 shows that C¯out reaches its maximum value C¯out∗ = 1 bps/Hz at p∗out = 0.188. We also see that the approximation algorithm gives a similar result to that for the actual channel. In this case, the approximate average outage capacity¯˜Cout reaches its maximum value¯˜Cout∗ = 0.998bps/Hz atp˜∗out= 0.178.
Outage Probability, pout
0 0.1 0.2 0.3 0.4 0.5 0.6 0.7 0.8 0.9 1
Average Outage Capacity (bps/Hz)
0 0.1 0.2 0.3 0.4 0.5 0.6 0.7 0.8 0.9 1 Real Channel Approximate Channel
Fig. 3. Average outage capacity with different pout for ntr = 6 and
Pct|ntr = 53mW
Number of Cooperative Nodes, ntr
1 2 3 4 5 6 7 8 9 10
Optimal Outage Probability
0.1 0.15 0.2 0.25 0.3 0.35 0.4 0.45 0.5 Real Channel Approximate Channel
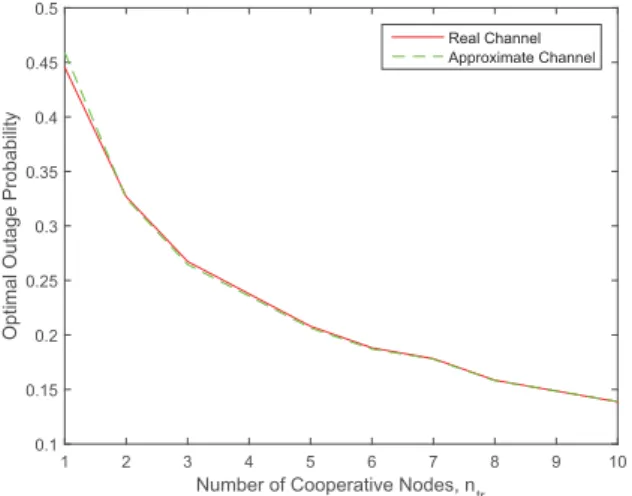
Fig. 4. Optimal outage probability with differentntr
We give the optimal outage probability p∗out for various values ofntr in Fig. 4. It shows thatp∗outis inversely propor-tional to ntr. We also note that the approximation algorithm gives a similar result.
The relation ofPtandntris given in Fig. 5. From (15) and taking into account the retransmissions, we define the average total power consumption as
¯
Pt(ntr) = Pt(ntr)
1−p∗out(ntr) (34) wherep∗out(ntr)is the optimal outage probability correspond-ing to ntr. From Fig. 5, we see that Pt and P¯t reach their minimum value at ntr = 2 and ntr = 3 respectively. We choose ntr = 3 as the optimal solution according to the definition in (16) and (34). Note that for the optimal n∗tr, the optimal outage probability p∗out(n∗tr) should fulfill the QoS requirement p∗out(n∗tr) ≤ 1− (N−1)T
D . If p∗out(n∗tr) is
out of range (p∗out(n∗tr) > 1− (N−D1)T), the new optimal value nˆ∗tr should be the smallest ntr ∈ (n∗tr, n] that fulfills the QoS requirement, since P¯t monotonically increases with ntr∈(n∗tr, n]andp∗out(n∗tr)is inversely proportional tontr.
Number of Cooperative Nodes, ntr
1 2 3 4 5 6 7 8 9 10 Power Cost (mW) 80 90 100 110 120 130 140 150 160 170 180
Total Power Cost per Cluster
Total Power Cost per Cluster Including Retransmissions
Fig. 5. Performance of the dynamic power control algorithm with different values ofntr
V. CONCLUSION
In this paper, we investigated the power consumption and optimization in a multi-hop QoS-constrained cooperative WSN in a fading environment. We showed that there is no closed form solution for the power optimization problem with certain QoS constraints in the fading environment. For each single-hop transmission, we proposed a three-phase transmission scheme. We then proposed the DPCO scheme to optimize the power consumption. By using DPCO scheme, coopera-tive diversity is utilized and the power consumption of the multi-hop transmission is minimized. We further proposed a channel approximation algorithm to reduce the computational complexity of DPCO scheme. The simulation results showed the efficiency of the DPCO scheme.
REFERENCES
[1] V. Gungor and G. Hancke, “Industrial wireless sensor networks: Chal-lenges, design principles, and technical approaches,”Industrial
Electron-ics, IEEE Transactions on, vol. 56, no. 10, pp. 4258–4265, Oct 2009.
[2] A. Paulraj, R. Nabar, and D. Gore,Introduction to Space-Time Wireless
Communications, 1st ed. New York, NY, USA: Cambridge University
Press, 2008.
[3] S. Cui, A. Goldsmith, and A. Bahai, “Energy-efficiency of mimo and cooperative mimo techniques in sensor networks,” Selected Areas in
Communications, IEEE Journal on, vol. 22, no. 6, pp. 1089–1098, Aug
2004.
[4] S. Jayaweera, “Virtual mimo-based cooperative communication for energy-constrained wireless sensor networks,”Wireless Communications,
IEEE Transactions on, vol. 5, no. 5, pp. 984–989, May 2006.
[5] A. Del Coso, U. Spagnolini, and C. Ibars, “Cooperative distributed mimo channels in wireless sensor networks,”Selected Areas in
Communication-s, IEEE Journal on, vol. 25, no. 2, pp. 402–414, February 2007.
[6] A. Goldsmith, Wireless Communications. New York, NY, USA: Cambridge University Press, 2005.
[7] O. Younis and S. Fahmy, “Heed: a hybrid, energy-efficient, distributed clustering approach for ad hoc sensor networks,” Mobile Computing,
IEEE Transactions on, vol. 3, no. 4, pp. 366–379, Oct 2004.
[8] W. Heinzelman, A. Chandrakasan, and H. Balakrishnan, “Energy-efficient communication protocol for wireless microsensor networks,”
in System Sciences, 2000. Proceedings of the 33rd Annual Hawaii
International Conference on, Jan 2000, pp. 10 pp. vol.2–.
[9] J. Perez, J. Ibanez, L. Vielva, and I. Santamaria, “Closed-form approx-imation for the outage capacity of orthogonal stbc,” Communications