Lincoln
University
Digital
Thesis
Copyright
Statement
The
digital
copy
of
this
thesis
is
protected
by
the
Copyright
Act
1994
(New
Zealand).
This
thesis
may
be
consulted
by
you,
provided
you
comply
with
the
provisions
of
the
Act
and
the
following
conditions
of
use:
you
will
use
the
copy
only
for
the
purposes
of
research
or
private
study
you
will
recognise
the
author's
right
to
be
identified
as
the
author
of
the
thesis
and
due
acknowledgement
will
be
made
to
the
author
where
appropriate
you
will
obtain
the
author's
permission
before
publishing
any
material
from
the
thesis.
Hybrid Computational Intelligence Systems based on Statistical
and Neural Networks Methods for Time Series Forecasting:
The Case of Gold Price
A thesis
submitted in partial fulfilment
of the requirements for the Degree of
Master of Applied Science in
Informatics and Computational Engineering
at
Lincoln University
by
Saeed Matroushi
Lincoln University
2011
Abstract of a thesis submitted in partial fulfilment of the
requirements for the Degree of Master of Applied Science in
Informatics and Computational Engineering.
Abstract
Hybrid Computational Intelligence Systems based on Statistical and
Neural Networks Methods for Time Series Forecasting:
The Case of Gold Price
by
Saeed Matroushi
In this research, two hybrid systems are proposed whose components are the Autoregressive Integrated Moving Average (ARIMA) model, and two types of Artificial Neural Networks (ANN) models. Since there are many types of ANN, this study focused on the Multilayer Perceptron (MLP) and Elman Recurrent Neural Networks (ERNN or Elman). Toward improving the performance of the MLP, Genetic Algorithm (GA) was also employed to optimise the weights and the neurons in the hidden layer of the MLP. Thus, three different ANN models were investigated. These three ANN in addition to ARIMA were used for modelling three time series. These series were the average yearly gold price, the average monthly gold price, and the daily gold price (London PM Fix) where all the values were in US dollars.
This study focused on investigating the possibility of finding an accurate model to forecast the gold prices and, more specifically, to investigate whether a hybrid system will improve the forecasting results of three gold price series: yearly, monthly and daily. To achieve these goals, two hybrid systems were developed to capture both linear and nonlinear components in the gold price series. The first hybrid system is a combination of ARIMA and MLP and the second combines ARIMA with Elman. The building blocks of the two proposed hybrid approaches contained three steps: in the first step ARIMA model is used to model the gold price series; second, two types of neural networks (MLP and Elman) were built to model the residuals from the ARIMA model. In addition to this and in order to improve the forecast
accuracy, the number of neurons in the hidden layer and the weights of MLP were optimised by GA (GA-MLP). The optimisation result was unsatisfactory, hence GA-MLP model were excluded. Finally, the forecast from the ARIMA and the two ANN models, Elman and MLP were combined to forms the hybrid systems aimed in this study. The performance of each single model, ARIMA, MLP and Elman along with hybrid models were compared. The results obtained in this study showed that compared to the ARIMA and ANN approaches, the proposed hybrid models performed much better in the monthly and yearly predictions but yielded the same results in the daily forecasts.
Keywords: Time series, autoregressive, integrated, moving average, neural networks, multilayers perceptron, Elman recurent neural networks, genetic algorithms, hybrid systems
Acknowledgements
This thesis would not have seen the light of day without the support of many people to whom I will always be grateful. I would like to take this opportunity to thank everyone who
supported me during my stay in New Zealand, starting with my supervisor, Dr. Sandhya Samarasinghe. Dr Samarasinghe was an excellent teacher and advisor who provided me with continuous support and mentorship during my time at Lincoln University. I greatly benefited from her guidance not only in my academic field but also in many other aspects, especially when she gave me the chance to work as a tutor. I will always be thankful for her wisdom. I would also like to thank my co-supervisor, Dr.Magdy Mohssen, for his support, time and helpful suggestions, and also for lending me some valuable books, which helped me
immensely in my research. My sincere appreciation goes to Mr. Abdul-Rahman Al-Ghardaqa, the UAE cultural attaché in Canberra, Australia, for his support and advice in many aspects and for being a great friend.
I’m very grateful to the UAE Ministry of Higher Education and Scientific Research (HESR) for giving me this chance to study abroad and for supporting me during my study in New Zealand. I would especially like to thank Ms. Mona Al-Mansori, Ms. Fatima Al-Zaabi and Ms. Khadija Al-Braiki for their support and help.
I would also like to thank the Department of Environment, Society and Design, Lincoln University, for giving me the opportunity to be one of their students and also for the consistent support I received from the staff.
Finally, I give my deepest thanks to my wife for supporting, listening and encouraging me during my study period.
Table of Contents
Abstract ...ii Acknowledgements...iv Table of Contents ... v List of Tables ...x List of Figures...xi Chapter 1 Introduction ...1 1.1 Chapter Overview ...1 1.2 Research Background...11.3 Objective of the Study...3
1.4 Contribution from the Study...4
Chapter 2 Gold Background and History ...6
2.1 Chapter Overview ...6
2.1.1 Background ...6
2.1.2 Gold from the Mine to the Market...7
2.1.3 Gold Trading Centre ...8
2.1.4 Trading in Physical Gold ...9
2.1.5 Trading in non-physical gold ...9
2.1.6 Reason for Holding or Trading in Gold ...10
2.1.7 Early History of the Gold Market...11
2.1.8 The Gold Market from the 1790’s to 1999 ...11
2.1.9 The Gold Market from 2000 to 2007...13
2.1.10 The Gold Market from 2008 to 2009...14
2.1.11 Gold Supply and Demand ...16
2.1.11.1 Gold Supply ...16
2.1.11.2 Gold Demand ...18
2.1.12 Summary ...20
Chapter 3 Literature Review ...22
3.1 Chapter Overview ...22
3.1.1 Role of Gold and its Influencing Factors ...22
3.1.2 Gold Price Forecasting using Conventional Approaches ...26
3.1.3 Gold Price Forecasting using Artificial Neural Networks ...28
3.1.4 Hybridisation ...30
Chapter 4 Methods...32
4.1 Introduction...32
4.2 Linear Method - Univariate Time Series...33
4.2.1 Stationarity Condition...33
4.2.1.1 Strict Stationarity ...34
4.2.1.2 Weak Stationarity...34
4.2.1.3 White Noise (WN) Process...35
4.2.1.4 Moving Average (MA) Process ...35
4.2.1.5 Autoregressive (AR) and Stationarity Process ...36
4.2.1.6 Autoregressive (AR) and Non-Stationarity Process ...36
4.2.1.6.1 Random Walk (RW) Process...36
4.2.1.6.3 Deterministic Trend...37
4.2.1.7 Testing for Stationarity (Unit Root)...38
4.2.1.8 Achieving Stationarity...39
4.2.1.8.1 Achieving Stationarity in Variance ...40
4.2.1.8.2 Achieving Stationarity in the Mean...41
4.2.1.8.3 Removing Seasonality...42
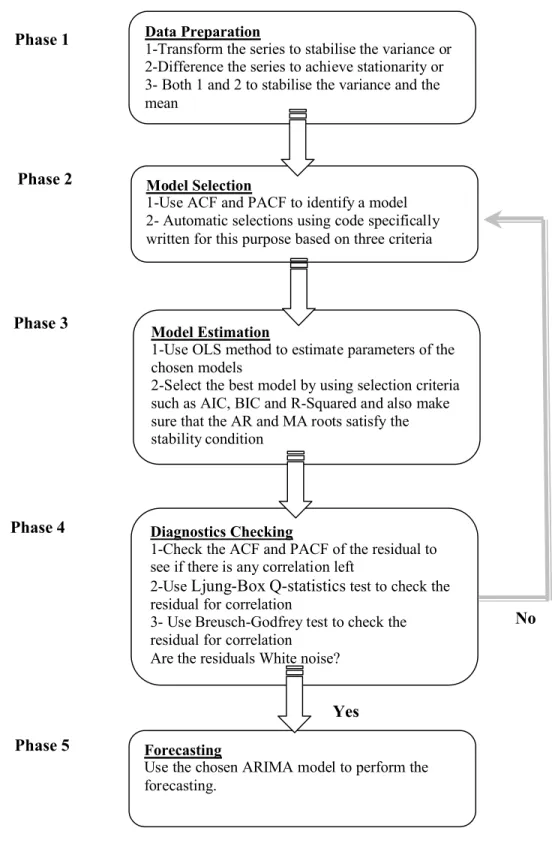
4.2.2 Box-Jenkins Approach (ARIMA)...42
4.2.2.1 ARIMA Representation...43
4.2.2.2 ARIMA Model Requirements and Assumptions...43
4.2.2.3 Box-Jenkins Model-Building Procedure ...44
4.2.2.3.1 Phase 1: Data preparation and Model Identification ...44
4.2.2.3.2 Phase 2: Model Specification and Selection...44
4.2.2.3.3 Phase 3: Parameters Estimation...46
4.2.2.3.4 Phase 4: Diagnostic Checking...47
4.2.2.3.5 Phase 5: Forecasting...49
4.3 Nonlinear Methods – Artificial Neural Networks (ANN)...51
4.3.1 Artificial Neural Networks...51
4.3.1.1 Neuron and its Components...52
4.3.1.2 Activation Functions ...53
4.3.1.3 Neuron Layers...53
4.3.1.4 Feed-Forward Neural Network...54
4.3.1.5 Perceptron...54
4.3.1.6 Multiple-Layer Perceptron (MLP) ...55
4.3.1.7 Gradient based Learning Rules...56
4.3.1.7.1 Delta Rule Algorithm...56
4.3.1.7.2 Back-Propagation Algorithm...56
4.3.1.7.3 Momentum Term ...60
4.3.1.7.4 Levenberg–Marquardt Method...61
4.3.1.8 Genetic Algorithms Concept ...63
4.3.1.8.1 Population...64
4.3.1.8.2 Fitness function ...64
4.3.1.8.3 Selection...64
4.3.1.8.4 Crossover...65
4.3.1.8.5 Mutation...65
4.3.1.9 Feed-Back - Recurrent Neural Networks ...66
4.3.1.9.1 Jordan Recurrent Network ...66
4.3.1.9.2 Elman Recurrent Network ...67
4.3.1.10 Learning Mode...69
4.4 Proposed Hybrid Method...70
4.5 Data and Modelling Procedure of the Study...72
4.5.1 Data ...72
4.5.2 ARIMA Modelling Procedure...72
4.5.2.1 Procedure for Achieving Stationarity...72
4.5.2.2 Model Specification and Selection procedure ...73
4.5.2.3 Model Diagnostic Checking Procedure...74
4.5.3 ANN Modelling Procedure ...74
4.5.3.1 Scaling Procedure...74
4.5.3.2 Network Architecture and the Training Procedure ...75
4.5.3.2.1 Training Algorithm...76
4.5.3.2.2 Training Parameters ...77
4.5.4 Hybrid Modelling Procedure...78
Chapter 5 Model Development and Results ...79
5.1 ARIMA Model Development and Results ...79
5.1.1 Yearly Gold Price Forecasting with ARIMA Modelling...79
5.1.1.1 Graphic Analysis...79
5.1.1.2 Stationarity Test ...79
5.1.1.2.1 Augmented Dickey-Fuller test for Original Series...79
5.1.1.2.2 Augmented Dickey-Fuller test for the Transformed Series ..81
5.1.1.3 Data Division ...82
5.1.1.4 Model Identification...82
5.1.1.5 Model Estimation and Selection ...83
5.1.1.6 Model Diagnostic Checking ...85
5.1.1.7 Forecasting and Results...87
5.1.2 Monthly Gold Price Forecasting with ARIMA Modelling ...88
5.1.2.1 Graphical analysis ...88
5.1.2.2 Stationarity Test ...88
5.1.2.2.1 Augmented Dickey-Fuller Test for Original Series ...88
5.1.2.2.2 Augmented Dickey-Fuller test for the Transformed Series ..90
5.1.2.3 Data Division ...91
5.1.2.4 Model Identification...91
5.1.2.5 Model Estimation and Selection ...92
5.1.2.6 Model Diagnostic Checking ...93
5.1.2.7 Forecasting and Results...95
5.1.3 Daily Gold Price Forecasting with ARIMA Modelling...97
5.1.4 Graphical Analysis...97
5.1.4.1 Stationarity Test ...97
5.1.4.1.1 Augmented Dickey-Fuller test on raw data series ...97
5.1.4.1.2 Augmented Dickey-Fuller test for the Transformed Series ..99
5.1.4.2 Data Division ...99
5.1.4.3 Model Identification... 100
5.1.4.4 Model Estimation and Selection ... 100
5.1.4.5 Model Diagnostic Checking ... 103
5.1.4.6 Forecasting and Results... 104
5.2 ANN Model Development and Results... 106
5.2.1 ANN Modelling of Yearly Gold Price and Results ... 107
5.2.2 ANN Modelling of Monthly Gold Price and Results ... 111
5.2.3 ANN Modelling of Daily Gold Price and Results ... 115
5.3 Hybrid Model Development and Results ... 119
5.3.1 Hybrid Modelling of Yearly Gold Price and Results ... 120
5.3.2 Hybrid Modelling of Monthly Gold Price and Results... 122
5.3.3 Hybrid Modelling of Daily Gold Price and Results ... 124
Chapter 6 Model Comparisons and Summary... 126
6.1 Comparison... 126
6.1.1 The Yearly time series ... 126
6.1.2 The Monthly Time Series... 127
6.1.3 The Daily Time Series ... 128
6.2 Summary... 129
Chapter 7 Conclusions and Recommendations for Furthur Research ... 131
References... 133
A.1 Figures ... 139
A.1.1 The first difference of the yearly gold price... 139
A.1.2 Test the Adequacy of the Transformation Method Used ... 139
A.1.3 Predicted (Pre) and Actual (Act) data: ARIMA-MLP (1-4-1) on the yearly out-of-sample... 140
A.1.4 Predicted (Pre) and Actual (Act) data: ARIMA-Elman (1-5-1) on the yearly out-of-sample... 140
A.2 Tests ... 141
A.2.1 Standard deviation test for the three subgroups of first difference of the log-transformed series ... 141
A.2.2 Standard deviation test for the three subgroups of second difference of the log-transformed series... 141
A.3 Tables ... 142
A.3.1 Detecting change in the variance to check for over-differencing problem... 142
A.3.2 The best ARIMA model according to the AIC criteria for the yearly gold price... 142
A.3.3 The best ARIMA model according to the BIC criteria for the yearly gold price... 142
A.3.4 The best ARIMA model according to the R-squared criteria for the yearly gold price... 142
A.3.5 Possible ARIMA models for modelling the yearly gold price... 143
A.3.6 Table of the restricted ARIMA (1,2,4) estimation results ... 143
A.3.7 Table of the restricted ARIMA (1,2,6) estimation results ... 144
A.3.8 Inverse Roots of AR/MA Polynomial/s for the restricted ARIMA (1,2,4)... 144
A.3.9 Inverse Roots of AR/MA Polynomial/s for the restricted ARIMA (1,2,6)... 144
Appendix B Monthly Gold Price Series... 145
B.1 Figures ... 145
B.1.1 The correlogram of the first difference of the log transformed monthly gold price... 145
B.1.2 Test the Adequacy of the Transformation Method Used ... 145
B.1.3 Predicted (Pre) and Actual (Act) data:ARIMA-MLP (5-6-1) on the monthly out-of-sample... 146
B.1.4 Predicted (Pre) and Actual (Act) data:ARIMA- Elman (5-7-1) on the monthly out-of-sample... 146
B.2 Tables ... 146
B.2.1 Detecting change in the variance to check for over-differencing problem... 146
B.2.2 The best ARIMA model according to the AIC criteria for the monthly gold price... 147
B.2.3 The best ARIMA model according to the BIC criteria for the monthly gold price... 147
B.2.4 The best ARIMA model according to the R-Squared criteria for the monthly
gold price... 147
B.2.5 Possible ARIMA models for modelling the monthly gold price... 148
B.2.6 Table of the restricted ARIMA (1,1,11) estimation results ... 149
B.2.7 Inverse Roots of AR/MA Polynomial/s for the restricted ARIMA (1,1,11)... 149
Appendix C Daily Gold Price Series... 150
C.1 Figures ... 150
C.1.1 Test the Adequacy of the Transformation Method Used ... 150
C.1.2 Predicted (Pre) and Actual (Act) data: ARIMA-MLP (4-2-1) on the daily out-of-sample... 150
C.1.3 Predicted (Pre) and Actual (Act) data: ARIMA-Elman (1-4-1) on the daily out-of-sample... 151
C.2 Tables ... 151
C.2.1 Detecting change in the variance to check for over-differencing problem... 151
C.2.2 The best ARIMA model according to the AIC criteria for the daily gold price151 C.2.3 The best ARIMA model according to the BIC criteria for the daily gold price 152 C.2.4 The best ARIMA model according to the R-Squared criteria for the daily gold price... 152
C.2.5 Possible ARIMA models for modelling the daily gold price... 153
C.2.6 Table of the restricted ARIMA (5,1,5) estimation results ... 154
List of Tables
Table 4.1 Values of Lambda and commonly used Transformations...40
Table 4.2 Chosen model order using ACF and PACF patterns ...45
Table 4.3: Examples of some of the Activation Functions...53
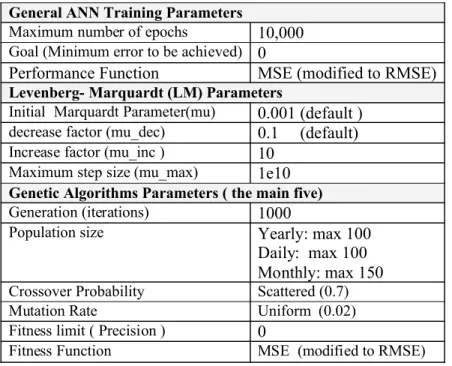
Table 4.4: The Parameters used in ANN and GA Modelling...77
Table 5.1: ADF test for the raw data of the yearly gold price ...80
Tale 5.2: ADF test of the second difference of the log yearly gold price ...82
Table 5.3 Yearly data partitioning ...82
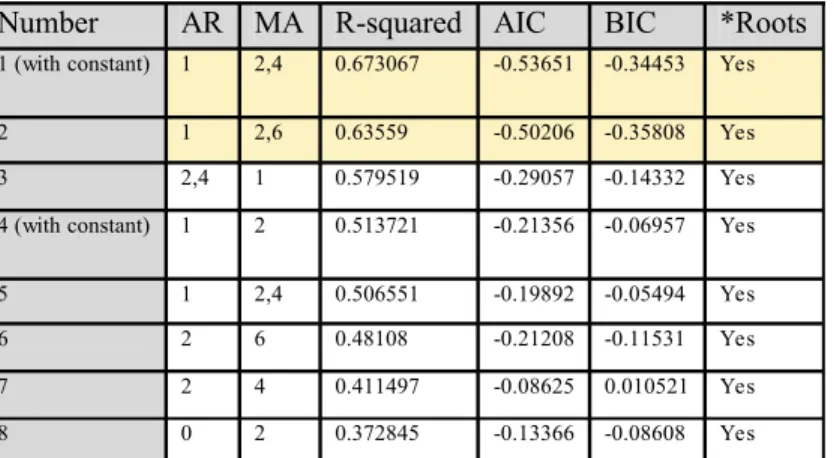
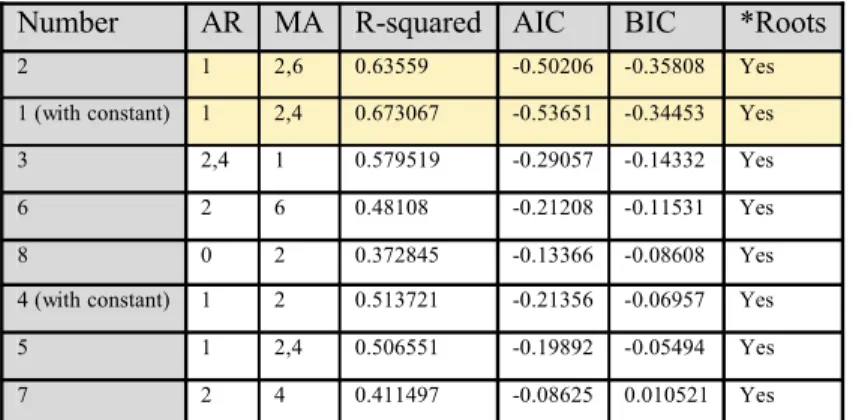
Table 5.4 Best eight models ranked according to the highest R-squared criterion...84
Table 5.5 Best eight models ranked according to the lowest AIC criterion...84
Table 5.6 Best eight models ranked according to the lowest BIC criterion ...85
Table 5.7 Breusch-Godfrey Serial Correlation LM Test, 6 Lags ...86
Table 5.8 Goodness-of-fit of the model for in-sample and out-of-sample...87
Table 5.9: ADF test for the original data of the monthly gold price...88
Table 5.10: ADF test after differencing the monthly time series ...90
Table 5.11: Monthly data partitioning...91
Table 5.12 Best three models ranked according to the highest R-squared criterion...92
Table 5.13 Best three models ranked according to the lowest AIC criteria ...92
Table 5.14 Best three models ranked according to the lowest BIC criteria ...93
Table 5.15 Breusch-Godfrey –LM Test for up to 12 order ...94
Table 5.16 Forecasting performance results for the three measures...96
Table 5.17: ADF test for the raw data of the daily time series ...97
Table 5.18: ADF test after differencing the power transformed daily time series...99
Table 5.19 Daily data partitioning ...99
Table 5.20 Best eight models ranked according to the highest R-squared criterion... 101
Table 5.21 Best eight models ranked according to the highest AIC criterion... 102
Table 5.22 Best eight models ranked according to the highest BIC criterion ... 102
Table 5.23: Breusch-Godfrey- LM test up to order 5 ... 103
Table 5.24: The three performance measure of the model... 105
Table 5.25 Training and validation data percentage for each series ... 106
Table 5.26 Performance of the best neural networks on yearly in-sample data ... 109
Table 5.27 Performance of the best neural networks on yearly out-of-sample data... 109
Table 5.28 Performance of the best neural networks on monthly in-sample data ... 113
Table 5.29 Performance of the best neural networks on monthly out-of-sample data... 113
Table 5.30: Performance of the best Neural Networks Models on the Daily In-Sample Data117 Table 5.31: Performance of the best Neural Networks Models on the Daily Out-of-Sample Data ... 117
Table 5.32: Performance of ARIMA-ANN hybrid on yearly in-sample data ... 121
Table 5.33: Performance of ARIMA-ANN hybrid on yearly out-of-sample data... 122
Table 5.34: Performance of ARIMA-ANN hybrid on monthly in-sample data... 124
Table 5.35: Performance of ARIMA-ANN hybrid on monthly out-of-sample data... 124
Table 5.36: Performance of ARIMA-ANN hybrid models on daily in-sample data ... 125
Table 5.37: Performance of ARIMA-ANN hybrid models on daily out-of-sample data... 125
Table 6.1 Performance of all models on the in- sample yearly gold price ... 127
Table 6.2 Performance of all models on the out-of-sample yearly gold price ... 127
Table 6.3 Performance of all models for the in-sample monthly gold price ... 128
Table 6.4 Performance of all models for the out-of- sample monthly gold price... 128
Table 6.5 Performance of all models for the in-sample daily gold price ... 129
List of Figures
Figure 4.1: Diagram summarising the whole process for ARIMA model development ...50
Figure 4.2: MLP with one hidden layer and single output neuron ...52
Figure 4.3: Structure of an Artificial Neuron ...52
Figure 4.4: Threshold Figure 4.5: Logistic Figure 4.6: Hyperbolic Tangent ...53
Figure 4.7: A Perceptron with one output neuron...54
Figure 4.9 Network with one nonlinear hidden neuron (forward phase) ...58
Figure 4.10 : Summary of the backward phase of the Back-propagation Algorithm ...59
Figure 4.11: Gradient Descent concept using a single weight...60
Figure 4.12 : Crossover concept in GA ...65
Figure 4.13: Mutation concept in GA ...66
Figure 4.14: Structure of Jordan Recurrent Network (JRN)...67
Figure 4.15: Structure of Elman Recurrent Network (ERN) ...67
Figure 4.16: Elman network with a single hidden neuron...68
Figure 4.17: Information flow of the proposed hybrid method ...70
Figure 5.1 Yearly gold price plot and statistics ...79
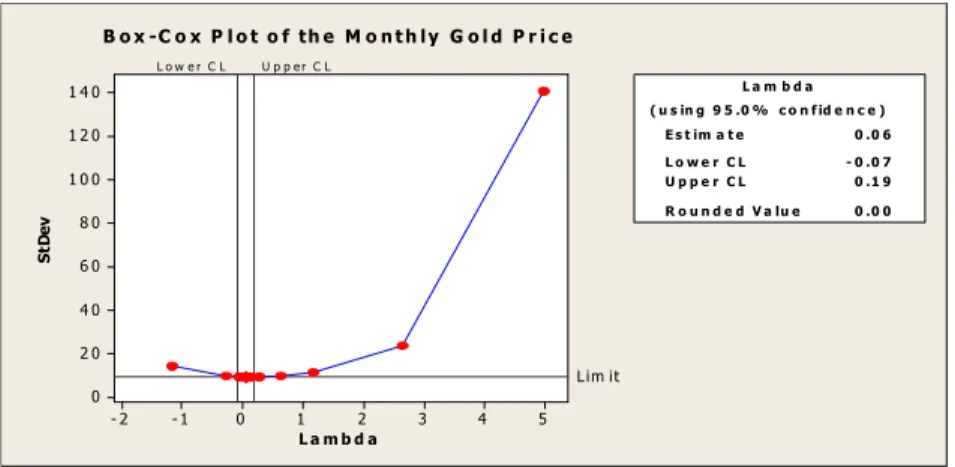
Figure 5.2: The Optimal value of Lambda for transforming the yearly gold price ...80
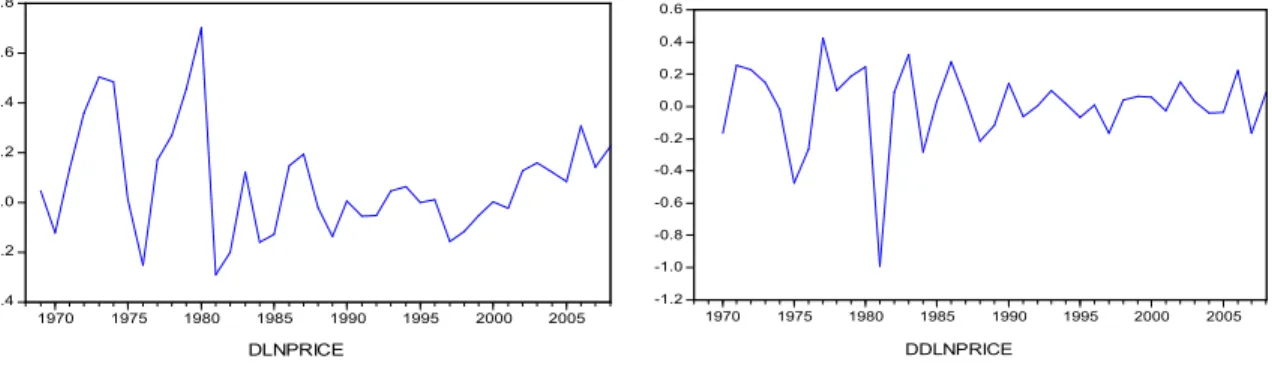
Figure 5.3 : Left to Right, First and Second difference of the log-transformed data...81
Figure 5.4 Correlogram of the second difference of logarithmic yearly gold price ...83
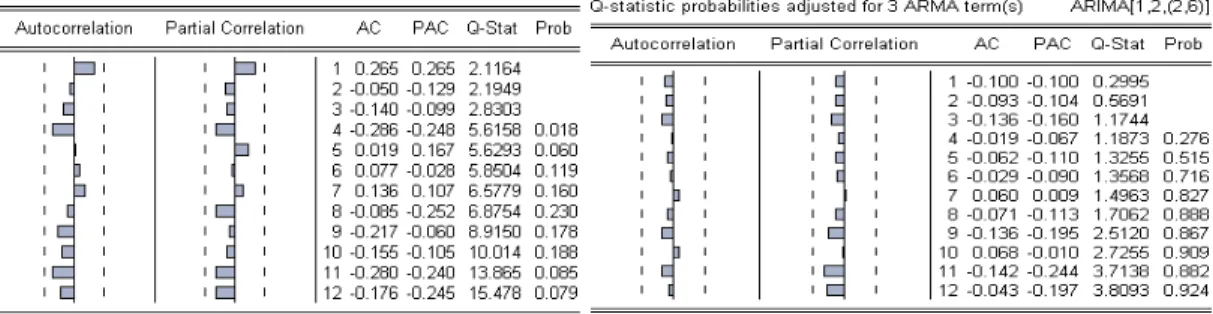
Figure 5.5 Correlogram of the residual for the two best ARIMA models ...86
Figure 5.6 Residual statistics of ARIMA (1, 2, 6) ...86
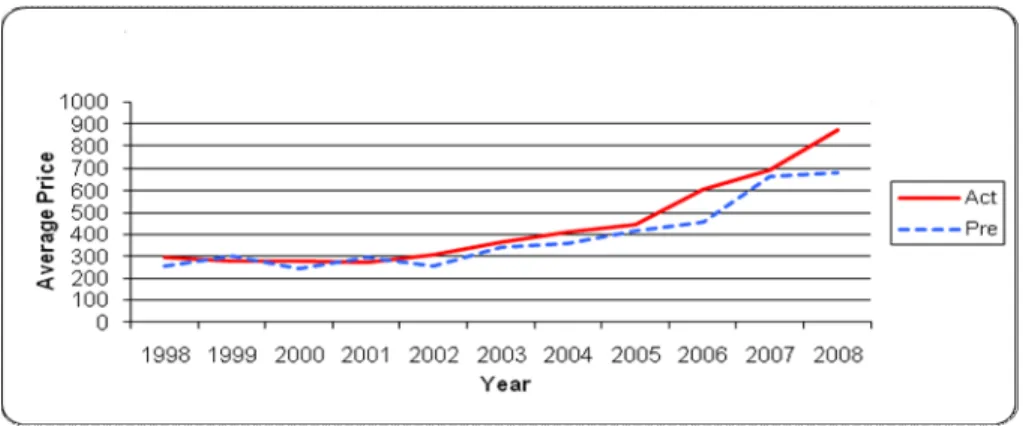
Figure 5.7 Predicted (Pre) and Actual (Act) data for the out-of-sample of yearly gold price.87 Figure 5.8 Monthly gold price plot and statistics...88
Figure 5.9 The Optimal value of Lambda for Transforming the Monthly gold price...89
Figure 5.10 Left to right, first difference and the first difference of the log-transformed series...89
Figure 5.11 Correlogram of the first difference of the log transformed series...91
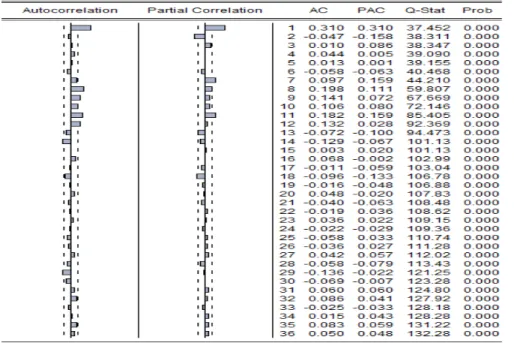
Figure 5.12 The Correlogram of the residual and Ljung-Box test (Q-test), columns from right, first is the p-value, second is Q-test, third is the PAC, Forth is AC, and fifth is lag number. ...94
Figure 5.13 Normality test for the selected model...95
Figure 5.14 : Predicted (Pre) and actual (Act) data for the out-of-sample (validation) of the monthly gold price ...96
Figure 5.15 Daily gold price plot and statistics ...97
Figure 5.16 The Optimal value of Lambda for transforming the daily gold price ...98
Figure 5.17 Daily gold price after differencing Figure 5.18 Daily gold price after...98
Figure 5.19 The Correlogram of the first-difference of the transformed series... 100
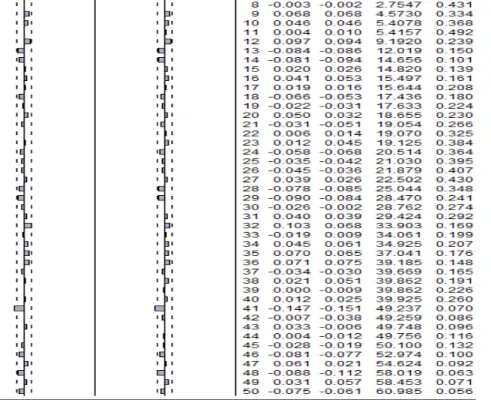
Figure 5.20 The Correlogram of the residual and Ljung-Box test (Q-test), columns from right, first is the p-value, second is Q-test, third is the PAC, Forth is AC, and fifth is lag number. ... 103
Figure 5.21: Residual distribution for ARIMA (5, 1, 5) ... 104
Figure 5.22: Predicted (Pre) and actual (Act) data for the out-of-sample of the daily gold price... 105
Figure 5.23: The performance of the 10 best MLP networks... 108
Figure 5.24: The performance of the 10 best Elman Networks... 108
Figure 5.25: The performance of the best GA-MLP network (2 hidden neurons) ... 109
Figure 5.26 Predicted (Pre) and actual (Act) data of MLP (1-3-1) on yearly out-of-sample set ... 110
Figure 5.27 Predicted (Pre) and actual (Act) data: Elman (1-3-1) on yearly out-of-sample set ... 110
Figure 5.28 Predicted (Pre) and actual (Act) data: GA-MLP (1-2-1) on yearly
out-of-sample... 110
Figure 5.29 The performance of the 10 best MLP networks... 111
Figure 5.30 The performance of the 10 best Elman networks... 112
Figure 5.31 The performance of the best GA-MLP network (7 hidden neurons) ... 112
Figure 5.32 Predicted (Pre) and actual (Act) data: MLP (1-4-1) on monthly out-of-sample 113 Figure 5.33 Predicted (Pre) and actual (Act) data: Elman (1-8-1) on monthly out-of-sample114 Figure 5.34 Predicted (Pre) and actual (Act) data: GA-MLP (1-7-1) on monthly out-of-sample... 114
Figure 5.35 The performance of the 10 best MLP networks... 115
Figure 5.36 The performance of the 10 best Elman networks... 116
Figure 5.37 The performance of the best GA-MLP network (5 hidden neurons) ... 116
Figure 5.38 Predicted (Pre) and Actual (Act) data: MLP (4-3-1) on the daily out-of-sample118 Figure 5.39 Predicted (Pre) and Actual (Act) data: Elman (4-3-1) on the daily out-of-sample... 118
Figure 5.40 Predicted (Pre) and Actual (Act) data: GA-MLP (4-5-1) on the daily out-of-sample... 118
Figure 5.41 The best ARIMA-MLP hybrid system for yearly gold price forecasting... 121
Figure 5.42 The best ARIMA-Elman hybrid system for yearly gold price forecasting... 121
Figure 5.43 The best ARIMA-MLP hybrid system for monthly gold price forecasting... 123
Figure 5.44 The best ARIMA-Elman hybrid system for monthly gold price forecasting ... 123
Figure 5.45 The best ARIMA-MLP hybrid system for daily gold price forecasting... 125
Chapter 1
Introduction
1.1 Chapter Overview
This chapter gives an overview of the structure and contribution of the thesis. Section 1.2 provides a discussion on the research problem and the need to find an adequate model for forecasting gold prices using a hybrid approach. In section 1.3 the objective of the study is defined, after which the contributions of this study are outlined in section 1.4. Section 1.5 presents an overview of the thesis contents.
1.2 Research Background
Forecasting time series, especially for financial data, is of great interest to the economic world. Until now, the primary tools used for forecasting are conventional statistical methods such as regression analysis and autoregressive integrated moving average (ARIMA)
(Koutsoyiannis, 1977). ARIMA, for example, is a very efficient method for forecasting linear time series, and its building process has been well described by Box and Jenkins (Geoge E. P. Box & Jenkins, 1971). According to Zhang (2004), the most extensively used statistical methods in time series forecasting are linear, which can only catch the linear patterns; however, the author added that most time series data are either nonlinear or contain nonlinearity properties.
Soft-computing methods have gained more attention from researchers as nonlinear forecasting methods, in particular the artificial neural network (ANN) method, as this has been the most commonly used method in the last few years for financial time series forecasting, as stated by Shadbolt and Taylor, (2002),Yudong and Lenan (2009), and Merh, Saxena, and Pardasani (2010). Neural networks have also been recognised as a successful technique in time series forecasting (Moody, 1995). A comparison between the most used linear model, ARIMA, and ANN, concluded that ANN outperformed ARIMA in many cases, as the study conducted by Zhang (2004, pp. 213-225 ) found. However, some studies have suggested that in some situations, ANN methods did not outperform ARIMA, as it depended on the behaviour of the time series, as demonstrated by Taskaya-Temizel and Casey (2005)and Zhang(2004, p. 222). Most time series data contain both linear and nonlinear patterns, so using linear methods alone to model the data is not practical and using nonlinear methods alone will also fail to model the linear patterns (Zhang, 2004). To overcome this problem, a new method has
emerged but is not yet widely used. The idea is to combine the two models, linear and nonlinear. The linear model will help in modelling linear patterns and the nonlinear model will help in modelling the nonlinear patterns. This hybridisation has featured in many studies as the best approach for forecasting time series data (Taskaya-Temizel & Casey, 2005), (Sallehuddin, Shamsuddin, Hashim, & Abraham, 2007),(Fatima & Hussain, 2008) and (Merh et al., 2010). Since the study of time series data is a wide field this study is devoted to
financial time series and, in particular, gold price forecasting using a hybrid system
comprising ARIMA and two types of ANN, with one optimised by Genetic Algorithms (GA). GA is an optimisation method based on the concepts of evolution and genetics. In terms of financial time series modelling, the gold price will be used as the case study in this research; as discussed briefly next.
Gold is one of the most important commodities in the world; it is one of the best indications of market performance and it is the best hedging and investment tool compared to other commodities. Therefore, forecasting the gold price is an important goal for many economists, not only for financial gain but also for forming financial and investment policies for both private and government entities (Dunis & Nathani, 2007). Since ancient times, gold and silver have been used as money in exchange for other commodities. Gold coins were minted in ancient times and widely used as a standard currency; for example, in the Roman Empire. There are two forms of gold and/or silver standards: using gold and/or silver as coins or defining a currency in terms of the weight of gold and/or silver that would have an equivalent value. We call this a backed currency. Today, most countries use unbacked money as
currency, sometimes referred to as fiat money. Fiat money does not retain its value over time and is not pegged to the value of other commodities such as gold or silver. This makes it weak as an exchange medium compared to precious metals such as gold. Due to the lasting value of gold, it is considered an effective hedge and insurance against economic, political and natural disruptions. Thus, it has become the most sought after commodity worldwide, especially in nations like India and China.
1.3 Objective of the Study
According to the literature, combining models (hybridisation) has shown promising results in studies of financial time series, such as the study of Zhang (2004) . However, some
researchers have argued that hybrid systems do not necessarily produce better forecasts, as stated by Taskaya-Temizel and Casey (2005). Thus, based on this argument, this study will address this issue by investigating several different models (linear, nonlinear and a hybrid of both) for three gold price series, namely, the average yearly gold price, the average monthly gold price and the daily gold price. In order to compare and draw conclusions about the main argument, this study will address the following questions:
• Would a nonlinear method such as an Artificial Neural Network (ANN) achieve better
forecasting accuracy than the Autoregressive Integrated Moving Average (ARIMA)?
• Which of the two types of ANN investigated in this study (MLP and Elman) would
perform better?
• Would the performance of the network under investigation change (improve) when
using a different nonlinear activation function in the hidden layer? (this study investigates the use of the logistic and the tangent functions)
• Would optimising the number of neurons in the hidden layer and the weights of the
Multi-layer Perceptron (MLP) network with Genetic Algorithm (GA) improve the forecasting accuracy?
• Would combining a linear method and nonlinear method, in this case ARIMA-ANN,
achieve better results than a single method?
In order to answer these questions, this research will first address the ARIMA modelling procedure then the ANN modelling process. The performance of these two approaches will then be compared. In order to draw final conclusions on whether a hybrid system is better than a single model or not, a hybrid system containing the two single models will be built and then the performances of each individual method will be compared with the hybrid system.
1.4 Contribution from the Study
Three gold price series are modelled using five different modelling methods. The modelling procedure starts with the ARIMA approach, by testing for stationarity and transforming the data that are non-stationary. This is done for three time series: the daily gold price, the average monthly gold price and the average yearly gold price. Unlike other studies, this study covers a wide range of tests in order to find the best possible ARIMA model for each series. For example, three criteria are used to search for the best ARIMA candidate for forecasting the price of gold in yearly, monthly and daily datasets. The study also contributes to the gold market research by modelling three different time series for the gold price using two types of Artificial Neural Networks, the Multilayer Preceptron (MLP) and Elman Recurrent Neural Network (Elman). In addition, in order to improve the forecasting accuracy, a Genetic Algorithm (GA) is also used to optimise the number of neurons in the hidden layer and the weights for the MLP. Therefore, three different ANN models are used for modelling each series. Moreover, for each ANN model, logistic and tangent sigmoid functions are used as an activation function in the hidden layer in order to determine which of them would best model the data. Finally, the main contribution of this study is that two hybrid systems are built for each of the gold price series where one of the hybrids is a combination of ARIMA and MLP and the other is a combination of ARIMA and Elman. Moreover, as far as the knowledge of the author, this approach has never been applied to the gold market, especially on this scale that addressed three series.
1.6 Organization of the Thesis
This thesis is organised as follows:
Chapter 1: Introduction and overview of the problem addressed in this thesis and some technical information about the approaches used.
Chapter 2: In this chapter, the history of gold is presented over a time period from the 1790’s to 2009. Some major events that contribute to changes of the gold price are also addressed in this chapter. Finally, an overview of gold supply and demand is presented followed by a summary of the chapter.
Chapter 3: Literature review. The role of gold and the factors that influence the price of gold is discussed. Then the parametric methods used for forecasting the price of gold are presented
followed by the literature about the use of neural networks for forecasting gold prices. Finally, the literature related to the proposed hybrid approach is examined.
Chapter 4: Explanations are given about the methods used in this thesis, starting with the ARIMA approach, then the ANN approach. The implementation process of the methods used for gold price modelling along with the goodness of fit criteria utilised in this study are then presented.
Chapter 5: Implementations of the methods proposed in this study on the gold price and the forecasting results are presented.
Chapter 6: Comparisons of the modelling results from the individual methods (ARIMA and ANN) and the hybrid methods are reported.
Chapter 2
Gold Background and History
2.1 Chapter Overview
This chapter gives an overview of the gold market and briefly explains how it operates. The chapter starts by discussing some background about gold and then, in section 2.1.2, an explanation of how gold is extracted and delivered to the market is given. Section 2.1.3 presents information about the gold bullion market (London) and the fixing concept. Section 2.1.4 gives an overview of how physical gold is traded and section 2.1.5 presents some well-known non-physical gold products that are used in the market for trading gold. A summary of reasons for trading or holding gold is given in section 2.1.6. Section 2.1.7 introduces the beginning of the modern gold trading history. Sections 2.1.8 to 2.1.10 discuss the gold market from the 1790’s to 2009 and the major events contributing to the shift in the gold prices. The final two sections discuss gold supply and demand with an emphasis on the period between 2005 and 2009.
2.1.1 Background
Dunis and Nathani (2007) state that gold is considered the most important traded commodity, due to its precise value and special properties. Moreover, gold is used as a hedge against inflation and variations in the US dollar. Recently, gold is being sought after as a
diversification asset in the investment market. Gold is also consumed by many nations in the jewellery industry.
Most of the gold produced, either from mined or recycled gold, is used in the manufacture of jewellery. The special properties of this metal make it a perfect choice for jewellery. These properties include its high lustre, shiny yellow colour and the ability to be drawn into wires and cast into shapes (Damarupurshad, 2005).
Gold is very soft, so in the jewellery industry gold is alloyed with one or more other metals, such as platinum, silver or copper. Therefore, a measuring standard has been developed to measure the gold content in these alloys. According to the World Gold Council report (2010), this standard is known as Karatage or Caratage. For example, pure gold is 24 carat (100% gold) and 23 carat is 23/24 (95.8% gold) and so on. The colour of the jewellery varies
according to the type of metal the gold is alloyed with; for example, white gold is 75% gold alloyed with 4% silver, 4% copper and 17% palladium.
According to Keel et al (2009), gold is still the only element which can be used in many industrial applications such as medical devices. Although advances in technology have reduced the use of gold in some applications, gold is still the only element suitable for some tasks such as printed circuit board manufacturing and gold plate film applications. Properties such as electrical and thermal conductivity make it preferable for many electronic industry uses.
2.1.2 Gold from the Mine to the Market
Maldar (2011) gives detailed information about how gold is mined. This information is summarised and presented in this section. In his work, the above author states that gold is found in different areas, in rocks, flood plains or riverbeds. For example, gold deposits in riverbeds are called alluvial gold. Harvesting gold from the riverbeds is the easiest way as gold can be unearthed using basic tools. In contrast, mining gold from rocks, which are normally found underground, requires heavy machinery and large capital. Machinery for digging, transporting, pumping oxygen and crushing rocks with explosives is required in this type of mining. Therefore, big companies or governmental bodies are usually the main operator in this type of mining. The gold mined by this method passes through several processing phases. First, rocks that contain gold (called ore) are transported to the surface then crushed and ground using heavy machinery. Secondly, the gold is separated using sluice boxes and shaking tables. Usually mercury is used to capture the gold and other metals; this will result in a mixture. Gold and other metals are then separated by evaporating the mercury. Thirdly, the mixture of gold and other metals is melted to remove the remaining mercury. Finally, a mixture of gold and small quantities of other metals such as silver is left. The purity of gold at this stage is around 70% to 90% and is commonly known as doré. The doré is sent to a refinery (normally registered) which refines it to a purity of 99.5%. The gold can then be sold through bullion banks (Maldar, 2011).
According to Olden (2010), these banks are the channel that connects the buyers and the sellers of physical gold. They also act as depositories. Most of the bullion banks are members of the London Bullion Market Association (LBMA), more about this association is discussed next.
2.1.3 Gold Trading Centre
The United States was the dominant centre of the world gold trading; however, after the end of the Bretton Woods standard system, which had tied the value of the US dollar to that of gold, the domination of gold trading moved back to London, which had long been one of the oldest gold trading centres in the world. The price of gold, however, is still determined in US dollars as well as some other major currencies, according to Jastram and Leyland (2009). Because London is considered the centre for gold trading for the world, the London Bullion Market Association (LBMA) was established in 1989 to determine the gold price on a daily basis. The LBMA consists of 11 bullion bank members as market makers and 65 bullion bank members as dealers (Olden, 2010). The international price of gold is determined in US dollars per troy ounce, which is equivalent to 31.10347 grams. Nowadays, gold is also determined in British sterling pounds, Euros and other major currencies.
According to Capano (2008) the price of gold is fixed twice every working day, once in the morning and once in the afternoon. The morning price is fixed at 10:30 am, and the afternoon at 3:00 pm; both are based on London time. There are five members (bullion banks) from the market makers in charge of the fixing task. These are Scotia-Mocatta, Barclays Capital, Deutsche Bank, Hong Kong and Shanghai Banking Corporation (HSBC) and Societe Generale, according to Capano (2008).
The fixing decision used to take place in the Nathan Mayer Rothschild building in a fixing room but nowadays it takes place in a teleconference. The London fixed price normally lasts until equilibrium between supply and demand is reached. Every day there will be buyers and sellers from all around the world waiting for the announcement of the fixed price before starting to trade. Sellers receive the fixed price plus $0.05 US dollar per ounce of gold (28.35 grams). Buyers pay the fixed price plus $0.25 per ounce of gold. There are two main ways of trading in gold that can be separated into two main markets, a physical market (spot market like the LBM discussed above) and a derivative market which includes forwards, futures and options. This study is devoted to the spot price and, more specifically, to the London spot price. For more information on the other type of market the reader may consider reading (Capano, 2008) or (Brady, 2010). In an attempt to simplify the gold trading market, some of the trading concepts are given next.
2.1.4 Trading in Physical Gold
Capano (2008) detailed that in LBMA, or any bullion market or bank, physical gold is traded over-the-counter (OTC). In order to trade in physical gold one must have an account. There are two main types of account available, an allocated account and an unallocated account. In order to open one of these accounts, an investor should deposit no less than 1000 ounces in the account. Having an allocated account is like having a deposit box where a bullion dealer or depository stores the gold in a vault. In order to link the gold or allocate it to its owner, normally in the form of bars or coins, they are numbered and hallmarked. The owner of an allocated account pays the depository for storage and insurance. In this case, the depository that secures the gold is not permitted to trade or lease the gold. In contrast, gold in an unallocated account is not numbered or hallmarked: hence, it is not allocated to a specific owner. Unlike the allocated account, the bullion dealer or the depository in the unallocated account has the right to trade or lease the gold. However, the dealer or the depository is obligated to secure the amount of the specified gold if the investor asks for delivery of their gold, which normally takes two working days. An unallocated account is much cheaper than the allocated one as the depository pays some interest from leasing the gold to their
customers. It is also noteworthy that 95% of the physical (over-the-counter) gold trade is from unallocated gold, according to Brady (2010). There is also another type of unallocated
account known as a Gold Pool account. This type of account allows the customer to store any amount of gold in a vault in a pooled form. That is, several customers will share one vault. There are no fees for storage or insurance in this type of account. The depository makes its profit from the difference between the buying price and the selling price (called the spread). Most people use this account to buy and sell gold without taking physical possession. An example of this account is the Kitco pool account (Clark, 2010).
2.1.5 Trading in non-physical gold
In addition to trading in physical gold, there are also many products designed to ease the gold trading process and eliminate the risk and charges applied when holding or trading in physical gold. These products are ways of trading in gold without the need to own it physically or store it in vaults. Perhaps the most well-known product is the Exchange-Traded Funds (ETFs). There are many ETFs available in the market but the most popular is the SPDR Gold Shares (GLD). A share of GLD is worth a tenth of the price of an ounce of gold in the market and it is traded in the market exactly like trading in shares. Another two popular ETFs available in the market are the Physical Swiss Gold shares (SGOL) and the Canadian gold and silver fund
known as the Central Fund of Canada (CEF) (Faltin, Schnider, Bolz, Schöttler, & Zingg, 2010). Moreover, another form of trading in gold that is also popular is the Perth Mint Certificate, which is the only government backed form of gold trading product. However, the minimum initial purchase for the certificate is AUD $5000. It has similar principles as trading physical gold where the investor can choose between an allocated and an unallocated account. The fee for an allocated account is 1.5% of the allocated gold per year and no storage fees apply for the unallocated account. The certificate is a form of a guarantee for the gold holder issued by the Australian government (Clark, 2010). There are other forms of trading in gold such as options, forwards and futures. Information about these non-physical gold trading products can be found in (Brady, 2010), (Adam, 2009) and (Faltin et al., 2010). Some of the reasons that encourage individuals and institutions to trade either in physical or non-physical gold are summarised next.
2.1.6 Reason for Holding or Trading in Gold
Reasons for holding or trading in gold vary. Jewellers buy gold for making jewellery, the biggest gold consumer sector. Investors and central banks use gold as a hedge instrument. Gold is used as a hedge against inflation, currency and recession (Levin & Wright, 2006). Nowadays, most investors buy gold either to trade or balance their investment portfolios. For example, if inflation increases, the stock market normally tends to fall and the gold prices increase thus investors try to balance their portfolio by selling some of their gold. Also, some investors or central banks who hold US dollars as an international trade currency have gold in their portfolios as a hedge against the dollar. When, for example, the dollar falls against other currencies, gold normally rises so gold holders can compensate their losses by trading their gold. Not only investors but also ordinary people rush to buy gold in bad economic times or disasters, such as wars, to secure or hedge against these causes, according to a recent report by Leyland (2010). From the literature we can see that gold is viewed differently by different nations. Gold in the form of jewellery is sought after by India, China and the Middle East. India, for example, believes gold is a gift from God, Chinese buy gold to express their level of wealth and people from the Middle East buy gold in the form of jewellery as a gift for the bride in wedding ceremonies. Many factors drive the price of gold higher and higher; these factors can be summarised as culturally-driven, religiously-driven and investment-driven. The literature about these factors is reviewed and discussed under the demand and supply section.
2.1.7 Early History of the Gold Market
The history of gold is way beyond our scope as it goes back thousands of years, but the major shift in the modern gold and silver trading history began in 1713, when silver was the
dominant currency in England (Jastram & Leyland, 2009). Before gold, silver was used as a currency in England and the Penny was called sterling, meaning star. Sterling silver gained its name because of that and became popular at the time. England started trading in gold only with the occupation of India and the establishment of the East India Company.
Gold came into the picture in 1717 when trade between England and France increased and France decided to exchange gold for goods. In the same year, around four million gold pounds were minted in England and the so called gold standard era began, making England the centre of gold trading, as stated by Jastram and Leyland (2009).
2.1.8 The Gold Market from the 1790’s to 1999
The history of this period in the gold market is well-reviewed by authors Jastram and Leyland (2009) and Lewis (2007). For example, Jastram and Leyland (2009) explained that in the early 1790’s gold and silver were adopted by England and the United States as a bimetallic standard for their currency. Moreover, Lewis (2007) detailed that at that time gold was traded at $19.30 per troy ounce. This price remained unchanged for around 44 years, until 1834. The price then rose to $20.67 per troy ounce and stayed at this level for almost 100 years. This was mainly because the US Congress changed the gold specification of money, which was determined by its price relationship with silver. By the end of the 1890’s, most of the leading countries such as France, Russia, Japan and Switzerland had adopted the gold standard. However, because of World War I and England’s involvement in the war, confidence in the sterling (pound) as an international currency fell. As a consequence, England abandoned the gold standard and tonnes of gold were shipped to the United States in exchange for goods and services. Most European countries sought to exchange gold with United States for goods and services. The international gold centre moved from England to the United States at that time (Jastram & Leyland, 2009).
Oil prices became linked with gold prices after Saudi Arabia demanded gold in exchange for oil in 1933. Consequently, the price of gold rose to $32.32; since then the oil market has had a strong influence on the movement of the price of gold. The next price move took place when the US president, Franklin Delano Roosevelt, devalued the dollar making gold reach $35 per troy ounce. Because the United States was the leading country in the industrial world and held
most of the world’s gold, the US dollar was made the world’s reserve currency in 1944 under the Bretton Woods agreement, as Jastram and Leyland (2009) explained. As a result, the International Monetary Fund (IMF) and the World Bank were established in 1947. The goal of the Bretton Woods agreement was to allow different governments to sell their gold at a fixed price of $35 per troy ounce. The price remained at $35 per troy ounce until 1971 when the US president at that time, Richard Nixon, ended the Bretton Woods agreement. This was the last link between gold and the U.S dollar and caused the price of gold to soar from $35 to $195 per troy ounce in the same year (Lewis, 2007).
According to Kosares (2010), it was illegal for Americans to own gold before 1975 but when it became legal, people were able to buy gold from central banks. This made the price of gold drop to $103 per troy ounce. The price again rose in 1976 to $140, and the US government attempted gold auctions in order to bring down the price of gold and benefit from the rise at the same time. Unfortunately, other problems arose including a 25% drop in the value of the US dollar against a basket of currencies which then made gold rise in value.
Moreover, Lewis (2007) stated that the international demand for gold exceeded the supply, a situation which led to an increase in the gold price; in 1979 alone the price rose from $250 to $400 per troy ounce. In the same year, Paul Volcker, the chairman of the USA Federal Bank (Fed), changed Federal policy from controlling interest rates to controlling the money supply. In addition, the invasion of Afghanistan by the Soviet Union, soaring oil prices and high inflation made gold rise to $850 in January 1980 but in 1982 the price fell to $296 due to the money supply policy and the strong US dollar, which made interest rates higher than ever. From 1983 to 1989, the price of gold fluctuated between $400 and $500. In 1989 alone, the price was under $400 but again rose in 1990 due to the Gulf War but did not exceed the $450 level from 1990 until the third quarter of 1996 (Bernstein, 2000).
Lewis (2007) explained that in late 1996 many events caused gold prices to decline, including the stock market and overall economic boom in Europe and the US. Moreover, the US dollar gained in value and became the most favoured currency for investment in the world and gold closed at $387. In contrast, in 1998, the Asian crisis, which started by the collapse of the Thai baht, became a global problem making gold reach $294 per an ounce. This was followed by the Russian debt default, Brazil’s currency crisis, the Kosovo war and the Bank of England gold auction, which all happened between 1998 and 1999. Moreover, gold reached $324 by October 1999 but then dropped before the end of the month to below $300, where it remained until the next year, as discussed next.
2.1.9 The Gold Market from 2000 to 2007
According to McMullen and Birchfield (2005), in 2000, the price of gold rose to $312, but by the end of the year it was down to $274.45. According to the author, the September Terrorist attack in 2001 did not push the price up as much as expected; rising to around $290.
Moreover, in the same year, there were many events affecting the gold market such as the collapse of Centaur Mining and Exploration and Enron; nevertheless, the gold price was $279.50 at the end of the year. By the beginning of 2002, there were concerns from European and North American investors about corporate governance in the United States and the Japanese were also concerned about the stability of the banking sector in the USA. These factors, together, pushed the price of gold to $309.68 per troy ounce. In September 2002, the giant gold-mining company, Barrick, announced that it expected to cut the hedge book by one third by the end of the year. Moreover, the terror bombing attack in Bali and the North Korean nuclear weapons programme were additional reasons for the high gold price, which closed at a high of $347.20 in 2002.
In 2003 many events took place; for example, the weak US dollar was a concern for many nations and investors. In March, the war in Iraq started with US involvement and in the same month, Australia launched the Australian gold Exchange Trade Fund. Also, an announcement from Newmont, one of the largest gold mining companies, revealed plans to reduce the amount of gold in the company’s hedge book by 3.5 million ounces. Moreover, the Gold Exchange Trade Fund was launched in London in December. All these events made the gold price to rise to $416.25 by the end of 2003. In 2004, the average price of gold was around $400. Events such as the Madrid train bombing, the Argentine Central Bank announcement to buy 55 tonnes of gold and US demand for gold as a hedging tool altogether put the price up to $435.60 as the World Gold Council stated in the Gold Price Chronology Report (2007). Nature was yet another contributor to the rise in gold price. Hurricane Katrina in 2005, for example, raised oil prices which, in turn, led to an increase in the demand for gold. High inflation and a weak dollar also supported the demand for gold and the price of gold reached $536.50. The price continued to rise and in May 2006 the gold price was $725. Political tensions are another cause of rises in gold prices. Among these political tensions were a Palestinian election won by Hamas, North Korean nuclear testing and the Israel-Lebanon war, which made the price of gold reach $833.75 by the end of 2007. However, in addition to the above causes, one of the main reasons behind this dramatic increase in gold prices was demand from investors seeking a safe-haven investment as an alternative to paper money, mainly the US dollar, the world currency (Lewis, 2007) .
In addition, Lewis (2007) summarised that some reasons behind the increase in gold demand were the use of gold as an inflation hedge by the US government and other nations. Moreover, a rush by private individuals to buy gold as an investment, a hedge against inflation and security against geopolitical and financial risks, also contributed to the rise.
2.1.10 The Gold Market from 2008 to 2009
This period is an important period in the gold market history as the gold prices went beyond the US $1000 per troy ounce mark for the first time in history. Therefore, we focus more on this period giving additional details for 2008, the year when gold exceeded US $1000. The review of the gold price for 2008 presented here was obtained from the Bullion Vault website (bullionvault.com) from the gold news in the monthly archive section. The Bullion Vault collects information about the gold market daily from different sources and presents them on their website. We, therefore, summarised the 2008 articles from this source. According to the Bullion Vault (2008), gold prices in 2008 showed unexpected changes as there were many events and factors that pushed the price to break the US $1000 mark. The uncertainty of the global economy, the continuing rise in inflation and the weak US dollar against other currencies, especially the Euro, were the main factors that influenced the price of gold in 2008.
The opening of the gold future trading market in China at the beginning of the year also contributed to the rise in January 2008. The price of gold in January started to increase from around $850 to reach $923 per troy ounce by the end of the month. In February the price was fluctuating around the $900 mark but by the end of month it closed at $971 and stayed at this level until 14 March when the price jumped to $1003 for the first time in history. The next trading day which was the 17 (after the weekend) gold was traded at $1011 per troy ounce. However, the price then decreased and went down to around $933 by the end of the month. The increases in the gold price that were seen in March were reported to be influenced by some factors, among them the demand from countries such as China, India (in wedding seasons) and Vietnam. In addition, the shortage in gold supply, especially from South Africa, due to the rising cost of mining (oil prices were rising) and shortages in power supply also contributed to the rise. Furthermore, on 14 March, the collapse of one of the biggest United State investment banks, Bear Stearns, caused panic not only on the US market but also globally; the bank then was taken over by J.P. Morgan Chase & Co. The price of gold fluctuated between $880 and $980 from April and July. In August the price of gold continued
its decrease to reach as low as $786 by the 15 of August before starting to recover, to reach $830 by the end of the month. The price dropped to $740 by 11 of September then gradually increased to around $900. The reason behind this increase was due to the collapse of the Lehman Brothers bank on September which caused panic in the market making gold prices rise to that level by the end of September.
The Bullion Vault (2008) also explained that the price started to decrease in October to reach the lowest price in 2008, of $712, by 24 October. By the end of October, the price started to recover until it reached $814 by the end of November. In December the gold was traded at around $780 during the first week and then increased on the 10 of December to reach around $870 by the end of 2008. According to the Bullion Vault, the main factors that contributed to the fluctuation of the price on November and December were the bailout news for the Citigroup bank, of $20 billion, that made a positive impact on gold market leading to an increase in gold price in the last week of November. In addition, the increase in gold price on December came after the announcement made by the International Energy Agency (IEA) claiming that the Organization of Petroleum Exporting Countries (OPEC) would reduce their production and that the demand for crude oil will grow in the coming year. OPEC confirmed the claim made by IEA when it announced on 17 December that its members agreed to cut production by 2.2 million barrels per day.
In 2009, the CPM Group in their press release of the Gold Yearbook 2010 (2010) reviewed the gold prices and according to the review, gold prices in 2009 rose from around $807 to reach as high as $1218 in late December. The increase in 2009 was mainly due to large purchases of gold by investors (official and private). The average gold price in 2009 was 11.7 percentages higher than the average of 2008. The continued worry of the falling economy and uncertainty about the global economic condition encouraged investors to buy more gold which were estimated to be around 37 million ounce of gold bought in 2009 alone.
Additionally, official sectors also increased their gold reserves in that year. For example, the People’s Bank of Chain purchased 14.6 million ounces of gold on April 2009. The Reserve Bank of India also added 6.43 million ounces to its holdings, purchased from the International Monetary Fund (IMF). Moreover, Central Bank of Russia bought about 3.78 million ounces to increase its gold holdings.
2.1.11 Gold Supply and Demand
The gold supply is mainly from three sources and the gold demand is also from three sources, according to the World Gold Council (2010). The three main sources of the supply are: mine production, recycled gold and official sector sales; whereas, the three main sources of demand are: jewellery, investment and industry. To give a clear picture of supply and demand, the period from 2005 to 2009 is highlighted and discussed below starting with main supply sources and then the three main demand sources.
2.1.11.1 Gold Supply
Mine production is the main artery that supplies the market with gold (see Fig 2.3). Olden (2010) explained that the global output of mines has grown from 1300 tonnes annually in the 1970’s to around 2500 tonnes in the 2000s. Most of the mined gold supplied to the market comes from 20 countries headed by China. These 20 countries provide around 88% of the global gold supply through mining. A list of these 20 countries is provided in Fig 2.1. It is also estimated that around 10% of the total gold supply specified under mining is from artisan and small-scale mining. Moreover, mining activities worldwide are controlled by 15 large mining companies (see Fig 2.2) and the largest of them is the Canada based, Barrick Gold. However, gold supply through mining is considered as a non dynamic source for supplying the market.
In their report, the World Gold Council (2010) stated that scrap or recycled gold has gained international interest becoming the second main source of supply. In 2009 alone, recycled gold accounted for 39% of total supply. Recycled gold mainly comes from jewellery and electronic products (e.g. cell phones). The gold supply through recycling has almost doubled from around 900 tonnes, in 2005, to 1674 tonnes, in 2009. This source of supply accounted for almost third of the total supply and it came through different channels including jewellers, scrap dealers and brokers (e.g. cash gold buyers).
The dramatic increase in gold price during the last three years (2007-2010) led to an increase in businesses for gold recovery through recycling; this included Cash for Gold and Mobile for Cash schemes. Most scrap dealers sell their gold or recovered gold to refiners (normally registered refiners) who, in turn, melt it into bars and then supply it to the market, hence, it is a dynamic source of supply (Olden, 2010).
Fig 2.1 Top 20 Gold Suppliers via Mining for 2009
Fig 2.2 Top 15 Mining Companies for 2009
Official sector sales are yet another source of gold supply; some of these official sectors include central banks and other governmental institutes such as the International Monetary Fund (IMF) and the Bank for International Settlements (BIS). According to the World Gold Council (2010), these governmental bodies hold over one fifth of the global above-ground stocks of gold. The average percentage of supply that came through this channel from 2005 to 2009 accounted for 9% of the total supply.
In an effort to control and monitor the quantity of gold entering the market through central banks, some central banks in Europe signed the Central Bank Gold Agreement (CBGA) in 1999. One of the main objectives of the CBGA is to stabilise gold sales from the largest 15 gold holders in the world at a fixed amount every five years. For example, they recently signed an agreement to not exceed more than 400 tonnes of gold annually starting between 2009 and 2014 (Olden, 2010).
2.1.11.2 Gold Demand
Jewellery demand is by far the major source of demand. From 2005 to 2009, it accounted for 61% of total demand (Fig. 2.4). Most jewellery demand comes from four countries and one region; the four countries are India, China, the USA and Turkey, and the Middle East is the region. It was estimated that 57% of jewellery demand comes from these four countries and the Middle East region (Fig. 2.5). India alone demanded a quarter of the world’s gold every year. Buying gold in India is mainly culturally and religiously driven. People in India see gold as a gift from God; hence, they offer gold to their family members and friends on religious and cultural occasions as a symbol of prosperity. An example of an important seasonal religious festival is Diwali, which takes place between October and November each year, as reported by the World Gold Council (2010).
The World Gold Council also pointed out that each country has its own reasons and occasions for buying jewellery, In China, for example, people buy jewellery in the Chinese New Year as gifts. In Turkey, the demand mainly comes from tourists. In the USA, the strong demand falls at Christmas and on Valentine’s Day. In Middle Eastern countries, including Turkey, the demand is also seasonal. For example, due to the cultural and religious values of women in society, gold is purchased in large quantities for marriage ceremonies as a gift for the bride from the groom’s family. India also shares a similar culture of marriage.
However, jewellery demand in marriage ceremonies in India is larger than that of Middle Eastern countries as it accounted for around 50% of annual jewellery demand, making India the key driver of gold demand. According to World Gold Council (2010), rising income levels in India have also contributed to the rise in gold demand. Although China is the largest gold supplier, it is the second largest gold consumer. The increase in levels of income, high saving rates and improvements in standards of living in China have contributed to the growth in jewellery demand with wealthy young consumers buying gold to express their social status, as stated by Philip Olden (2010). Gold in China is not only given for the Chinese New Year but also for birthdays, Mother’s Day and in wedding ceremonies. The demand for gold in China has increased at an average of 13% per year between 2005 and 2009, according to Ong (2010).
Fig 2.4 Average gold demand 2005-2009 Fig 2.5 Top 4 countries in jewellery demand
Investment is the second major source of gold demand. It has been estimated that around 27% of total demand was attributed to investments between 2005 and 2009 (Fig. 2.4). There are many ways of investing in gold, including jewellery, coins, bars, Exchange-Traded Funds (ETFs), futures and options and certificates. More commonly, physical gold such as coins and
bars as well as ETFs and similar products are preferred by investors (Faltinet al., 2010). For
example, when the world’s financial crisis worsened between 2008 and 2009, the demand for coins, bars and ETF products increased significantly, from 31%, in 2008, to 38%, in 2009 (Passmore & Watson, 2010). In general, investment demand via ETFs and physical gold rose dramatically from 4%, in 2000, to 45%, in 2009, according the World Gold Council (2010). The increase was linked to the financial crisis where many investors came to believe in gold as a diversifying asset in their investment portfolios. This made the demand for gold as an investment increase and it continues to be strong. A further increase in gold investment also
contributed to the fact that most central banks which sold some or all of their gold reserve in
1990s are now buying gold to increase their gold reserves (Faltinet al., 2010). The continuing
increase in investment demand is believed would push the gold of price higher in the future (Passmore & Watson, 2010).
A World Gold Council (2010) report stated that industry demand, which includes electronics, space technology and medical industry, is the third major source of gold demand (Fig. 2.4). It is estimated that nearly 431 tonnes were used annually between 2005 and 2009 in those industries alone. Around 6% of this demand is attributed to use as electrical components. Furthermore, Brady (2010) added that in the electronics industry gold is used in car
electronics, electronic circuits and in battery contacts in mobile phones. Gold is also used in the space industry in coatings for satellites and the windows of planes. This is because gold can reflect the ultraviolet radiation that comes from the sun. In the medical industry, for example, the average use of gold in dentistry from 2005 to 2009 is around 1.6%. However, the use of gold in dentistry has decreased since 2003 in favour of ceramics. In contrast, demand for gold in decorative and fashion industry has increased. For example, nowadays fabrics are decorated using threads made of gold and, more recently, temporary tattoos are designed using thin films of gold, which is popular in Japan and some Middle Eastern
countries, such as UAE (Ong, 2010) and (Baxter, 2010). Recent research had discovered new uses for gold in the industrial sector which may lead to an increase in demand in the future. Industrial demand associated with advancements in technology such as nanotechnology is growing and has revealed potential new uses for gold; for example, the development of nanorods to improve LCD display in mobile phones and laptops. Moreover, there is a possible future in using gold in solar cells according to the World Gold Council (2010).
2.1.12 Summary
As can be seen from this chapter, the scope of the knowledge required to predict the gold price is wide and diverse. In order to build an accurate model, knowledge and experience with the different issues related not only to the gold market but also to other variables have been reviewed and discussed in this chapter. For example, the literature revealed that there were many factors that affected the gold market. These factors can be summarised as follows: supply and demand related factors, cultural and religious related factors, natural disasters, oil prices, geopolitical risks, the US dollar exchange rate, inflation (US and world) and level of income. Some of these variables or factors can be easily obtained and dealt with; however,