Data Management in Ambient Assisted Living
Platforms Approaching IoT: a Case Study
Susanna Spinsante, Ennio Gambi, Laura Montanini, Laura Raffaeli
Dipartimento di Ingegneria dell’InformazioneUniversita’ Politecnica delle Marche Ancona, Italy I-60131
Email:{s.spinsante, e.gambi, laura.montanini, l.raffaeli}@univpm.it Abstract—The adoption of the Internet of Things paradigm
in Ambient Assisted Living platforms requires the investigation and analysis of issues related to data collection and processing. In fact, the peculiarities of Ambient Assisted Living services and applications pose specific requirements on the way data originated from sensors should be processed (locally or remotely), delivered (as raw data, or in aggregated fashion), and, of course, how they should be shared or protected. This paper analyses the issues related to data management starting from a review of the state of the art, in order to draw general trends or widespread approaches, that are then discussed and evaluated with respect to a practical implementation presented as a case study.
I. INTRODUCTION
Communication systems in Ambient Assisted Living (AAL) platforms have to deal with a huge variety of data types, that can be coarsely classified as behavioral (or habits-related) [1], [2], physiological [3], [4], environmental (or ambient-related) [5], [6], and healthcare data [7], [8]. Such a variety adds further complexity to data management in AAL, that has to cope also with other aspects, such as the amount of data that an AAL platform is able to collect from sensors (also known as volume), and the need of suitable performance in data transmission (also known as velocity), being some services expected to be delivered in real-time, like emergency notifications. The three attributes of variety, volume, and velocity are nowadays commonly mentioned in the field of Big Data [9]; the previous discussion highlights the strong connection existing between AAL and Big Data, in the perspective of data handling and management issues [10], [11].
Big Data, in its turn, is commonly referred to in conjunction with the growing impact of the Internet of Things (IoT) paradigm: physical objects and things are provided with an IP (Internet Protocol) identity, and connected to the Internet at an unprecedented fast pace. Once connected, objects can exchange information, take decisions to change their state, and act coordinately, without the need of human intervention. New protocols are needed to ensure communication and interop-erability among remarkably heterogeneous things, as well as new network architectures to support the proper circulation of huge amount of data generated and consumed by the connected objects [12].
The remarkable affinity between AAL and IoT, further enforced by the common underlying concept of Big Data, may easily lead to assimilating these two approaches, despite their chronological distance, being the AAL paradigm much older
than the IoT one. However, AAL exhibits specific requirements and constraints that shall be carefully accounted for, when adopting an IoT oriented approach for AAL design. Among them, data handling and management in AAL require a review of some commonly adopted strategies in IoT, with respect to processing (locally or remotely executed), delivery format (raw data or aggregated information), and sharing options. The main purpose of this paper is to investigate the emerging approaches to data handling and management in IoT oriented AAL platforms, by resorting to the state of the art literature, and to discuss the findings with respect to a practical AAL implementation, assumed as a case study. By this way, it is intended to highlight the peculiarities expressed by AAL in data handling, thus contributing to the still open and fervid discussion around IoT reference models and architectures.
The paper is organized as follows: Section II reviews and discusses the state of the art in the field of IoT applied in AAL platforms, in the perspectives of data management and communication. Strategies for data management in a practical AAL implementation are presented as a case study in Section III, and discussed with respect to the findings emerged from literature, in Section IV. Finally, Section V draws the main conclusions of the paper.
II. STATE OF THE ART
As discussed in [13], IoT in AAL may not only facilitate the collection of data, by means, for example, of easy-to-use enabling technologies such as Radio Frequency IDentification (RFID) and Near Field Communication (NFC), but also make the establishment of communication easier and more effective. In fact, collection and central storage of relevant health data may not be sufficient to increase the compliance with, and the success of a therapy. It is necessary to proactively send reminders and feedback to the patient, according to the so-called Closed Loop Principle. An IoT framework for AAL shall consequently support bidirectional flows of informa-tion: devices like smartphones can be used both to collect application-specific data by means of the embedded sensors, and as communication gateways to forward feedback to the pa-tient. Communication protocols for AAL have to be optimized in order to reach a trade-off among lifetime, security level, and pre-processing of the data from the sensors. In monitored physiological signals, the additional latency possibly incurred by pre-processing and security operations applied to the raw data generated from clinical sensors may become unacceptable. Original clinical sensors shall be adapted to IoT, by the
provisioning of Internet connectivity through communication interfaces (such as 6LoWPAN, ZigBee, BLE), and, at the same time, equipped with capability of data analysis to enable anomaly detection at the sensor level [14].
According to the IoT paradigm, data collected from the sensors should be accessible anytime and anywhere, which requires constant network connectivity. If the same idea is applied to remote healthcare monitoring applications, con-tinuous transmission would generate huge amount of data, and would contribute to a hyper connectivity scenario. How-ever, traditional mode of transmitting the data continuously would prevent from effective bandwidth usage, and lead to unacceptable data loss and delay due to buffer overloading. A possible solution to properly tune the IoT paradigm to healthcare applications is to reduce the amount of data to be transmitted, by resorting to event-based data transmission [15], by implementing processing tasks to aggregate data and provide a compact representation of the relevant information [16], and by learning from user’s decisions [17].
As for the majority of the envisioned IoT applications in many different vertical domains, IoT for AAL relies on cloud based big data management frameworks implementing the state of the art web scale data management technologies. This involves also the design and development of data mining and machine learning algorithms, to extract knowledge from the activity data collected by the AAL platform sensing capabilities. Data analytic algorithms have to support the real-time processing of large data volumes, looking into specific issues such as clustering, classification, and feature selection [18].
An alternative approach to the collection of massive data by distributed environmental sensors, delegating all the processing issues to cloud based big data management frameworks, is presented in [19], where a local data processing architecture is leveraged, to analyze collected data and validate its efficiency. The local processing capabilities may be exploited to classify the received data into static data, reflecting sensors’ status (i.e. environmental conditions), and real-time data streams, reflecting quality of life (e.g. patient-related parameters). Static data can be stored in a local database, whereas real-time data streams can be differently processed according to specific ser-vice requirements (e.g. alarm delivery, real-time physiological signals transmission). This approach decreases the workload of the remote platform side, the transmission capacity load, and improves processing speed. Such an approach seems to better meet the needs of AAL applications: heterogeneous data collected by AAL platforms cannot be efficiently supported by flat and data-agnostic management frameworks, but demand for differentiated processing, to ensure service-specific require-ments.
Having a local processing of the collected data before they are remotely delivered may also better support interoperability of the AAL system with other platforms, such as healthcare information infrastructures. Further, the local server can be also charged with the responsibility of applying the necessary algorithms and protocols to ensure data privacy, integrity, and access control, and to implement suitable security mechanisms to protect the data collected within the local databases [20].
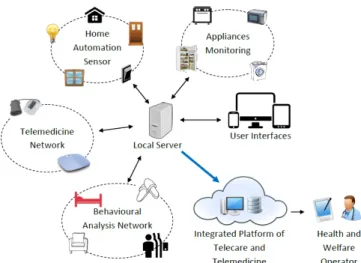
Fig. 1: Sub-systems corresponding to different domains in the reference AAL architecture
III. DATA MANAGEMENT INAAL:A CASE STUDY
A. System architecture
The AAL platform assumed as a case study in this paper [21] is composed by several sub-systems (i.e. networks) de-ployed within the home environment, and related to different functional domains, as shown in Fig. 1: home automation devices, sensors for behavior detection, biomedical devices for telemedicine, and a set of human-system interfaces. Each subsystem encompasses specific devices (sensors, appliances, smart objects) generating data that are all managed by cen-tralized applications, running on a so-called local server. The local server provides a unique integrated environment for data processing, and, in its turn, it is connected to a remote platform originally designed to host and provide health-related data and functions. The remote platform has been enriched to collect and support also data and information generated by the other sub-systems included in the AAL architecture.
Each sub-system collects data from a wide range of hetero-geneous devices, differing for type, transmission technology, processing and storage capabilities. Among the devices, it is possible to mention classic sensors (like Passive InfraRed -PIR, gas or smoke leakage sensors), home appliances (like a fridge or a stove, or even a light switch) equipped with sensing and data transmission capabilities, networks of devices acting as virtual sensors (like a network of NFC-enabled devices used for drugs and food intake monitoring), and smart objects (like a shoe equipped with a smart insole, or a smart power socket). From this list, though not exhaustive, the affinity to the IoT paradigm in terms of objects connected to the AAL platform is quite clear. From the perspective of the transmission technologies supported by the aforementioned set of heterogeneous objects, it is possible to mention, among others, the Controller Area Network (CAN) bus, Ethernet, Wi-Fi, Bluetooth, NFC, and SubGHz technologies. The considered AAL platform provides several interfaces to support both user-driven and event-user-driven interaction, and to meet the needs of different users and conditions. Smart TVs, portable touch-screen devices, NFC devices, and depth sensors are supported
to enable user interaction, to issue commands, to acquire data, and to request information from the system (e.g. on the current state of sensors and devices).
The local server collects all the data generated by the different sub-systems, in a common relational database (DB) that supports the development and application of data fusion algorithms. They are implemented by so-called aggregation tasks, i.e. REpresentational State Transfer (REST) services that use raw data to generate information, which is gathered in suit-able tsuit-ables in the same DB. From these tsuit-ables, so-calledreport tasks are in charge of generating a set of JavaScript Object Notation (JSON) objects, named reports, that are transferred to the remote platform on a daily basis.
B. Sensor-generated data and aggregated information The unified DB hosted by the local server includes a set of tables; some of them are populated by each single sensor, other are generated by the aggregation tasks, and are consequently identified as aggregated data tables. Even if, in its current deployment, the AAL platform considered cannot be referred to as a true IoT platform, as the single devices (sensors, actuators, interfaces,...) are not natively supporting IP-based connection, they are still able to access and deliver data to the local database, thanks to gateways, acting as interfaces between each specific sub-system and the local server. As an example, all the nodes belonging to the home automation sub-system that relies on CAN bus communication technology, can access the database with their specific identifiers and deliver data, through a CAN-to-Ethernet interface provided by a gateway connected to the same sub-system.
Among the tables collecting sensor-generated data, the following ones can be mentioned:
• power consumptiontable: each smart plug equipped with a power meter board can access this table and populate it with records of the form shown in Table I. Among the fields listed in each record: bnode
identifies the home automation gateway that controls the specific smart plug; level identifies each smart plug as a terminal one (physically located in a socket), or a root one (physically located at the main power supply in the home); timestamp is the time label associated to each record by the local server, that acts as a synchronization master in the heterogeneous architecture;poweris the amount of absorbed power in Watt, measured by the smart plug;
• sensors table: each ambient sensor in the AAL plat-form can populate this table with the same records listed in Table I for the power consumption table, with the exception of the level andpowerfields, that are replaced by a new field named state, of type int(3), that identifies the activated or non-activated state of the sensor itself;
• user statetable: this table collects data generated by the smart shoes. In details, the record state listed in Table I as a varchar(20) may take values as: walking, standing, sitting, or not wearing the shoe. These states are defined for the left and the right shoes, as identified by the shoe typerecord;
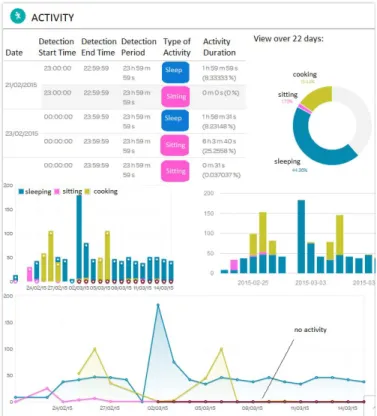
Fig. 2: Graphical representations of the aggregated information transferred to the remote cloud-based platform and accessible via a web interface
• reminders table: this table lists the reminders that have been set for the user, related to the time and amount of each drug assumption. The same reminders are notified through the system interfaces, for example by means of pop-up messages displayed on the smart TV screen;
• Body Sensor Network Concentrator (BSNC)table: this table is populated by the events generated by a wearable device, located on the user’s belt, to monitor possible fall events, but also the number of steps performed, and distance covered along the day. The records listed in Table I allows to identify the device and the specific type of event notified by it.
The aggregation tasks, implemented as a set of REST services, process the data collected into the tables described above and, in their turn, populate other tables, the so-called aggregated data tables. They include:
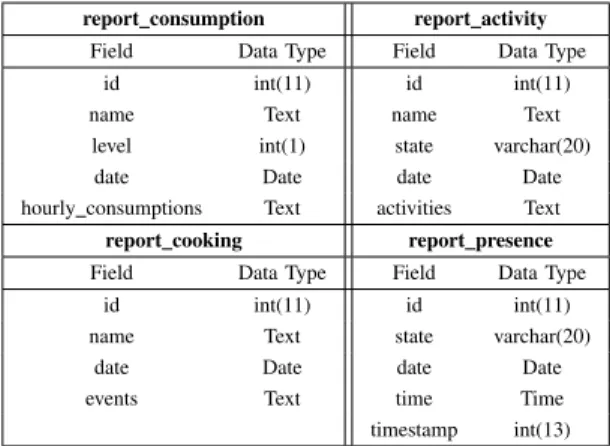
• report consumption: this table lists the average power consumption measured each hour in a day, by each single power meter; this information is stored in textual form, as a list of 24 comma-separated values. The specific power meter is identified by the fieldid, as shown in Table II;
• report activities: this table describes the percent amount of daily activity of the monitored subject, ac-cording to the data generated by specific ambient sen-sors, i.e. two Force Sensing Resistors (FSR) located in the bed and in the sofa. The aggregated information
TABLE I: Records in the local DB tables hosting sensor-generated data
power consumption user state Field Data Type Field Data Type
id int(11) id int(11) id meter int(5) shoe type varchar(20)
bnode varchar(20) state varchar(20) name varchar(50) date Date
type varchar(50) time Time level int(2) timestamp bigint(20)
date Date date Date
time Time timestamp int(13)
power int(11)
reminders BSNC
Field Data Type Field Data Type drug varchar(30) id int(11) quantity Text date / time Date / Time
time Time family varchar(32) device varchar(32) code varchar(16) description varchar(64)
date Date
describes the initial time and the duration of each type of activity monitored, referred to resting or being in/out of bed, as reported in the fieldactivities, shown in Table II;
• report cooking: this table provides information about the activities performed by the monitored user and related to cooking, that are detected by processing the raw data generated by several sensors, like a gas flow meter applied to burner, a power meter located on the plug used to feed the microwave oven, a couple of PIR sensors located in the kitchen area, and a magnetic sensor used to monitor opening and closing of the fridge door. For each cooking activity detected, the starting time and duration are provided;
• report presence: this table provides information on the amount of time the monitored user spends at home each day, by exploiting the data generated by a set of sensors, among which it is possible to mention several PIR sensors spread in the home environment, FSRs applied onto chairs and sofa, and all the buttons or switches controlled by the home automation sub-system, as any action performed on the home automa-tion system reveals the presence of a user acting on it.
The aggregated data tables discussed above include the records listed in Table II. The information saved within the aggregated data tables are transferred on a daily basis to a remote cloud based platform, where further processing may take place, for example to generate reports and statistics about the monitored user’s behaviors, like the graphs shown in Fig. 2.
C. Data management policies
Data exchanges within the AAL platform, and towards the remote cloud-based entity, are managed by the local server,
TABLE II: Records in the local DB tables hosting aggregated data
report consumption report activity Field Data Type Field Data Type
id int(11) id int(11)
name Text name Text
level int(1) state varchar(20)
date Date date Date
hourly consumptions Text activities Text report cooking report presence Field Data Type Field Data Type
id int(11) id int(11)
name Text state varchar(20)
date Date date Date
events Text time Time
timestamp int(13)
together with the operations related to sensor data collection and DB management. The local data flow within the AAL platform is bidirectional, and mostly supported by the local Wi-Fi and Ethernet networks.
The software applications running on the different physical interfaces available within the system may issue requests to the local server, adopting the HTTP protocol. The URLs encap-sulated in HTTP strings contain the local server IP address, the port number on which the server is reachable, and some parameters related to the specific service queried. The local server replies to each request by sending the corresponding information formatted as JSON objects. As an example, when the user interacts with the home automation sub-system by means of any of the available interfaces, three types of requests may be issued to the server: configure, to get information about the sub-system configuration; state, to get information about the current state of specific sensors within the sub-system; command, to issue commands to loads controlled by the home automation sub-system (single loads, or multiple ones within a scenario). Each HTTP request is formatted as http://[IP address: port number]/*, where the wildcard * may take different values, like: /domotic/configure/bnode, /domotic/state/meter/current, or/domotic/command?type=[...], where the last string shall be completed with other parameters, according to the specific command it is intended to issue.
In addition to data exchanges originated by user’s requests, other information shall be automatically delivered, for example on the basis of time triggers. An example is given by the drugs assumption reminder service. In this case, interface applica-tions periodically poll the REST service on the local server devoted to the management of reminders. The REST service compares the current time of the request to the prescribed time of assumption listed in a specific DB table; in the case one or more matches are found, the JSON object transferred from the server to the system interfaces contains the list of the drugs for which a reminder shall be delivered to the user, through the interfaces available in that moment. Further, the local server manages the data exchanges required by the NFC service that allows the user to easily collect information on foods and drugs by tapping a NFC-enabled reader to the box. The information is then delivered to the users by means of the available interfaces, like the Smart TV screen, or the
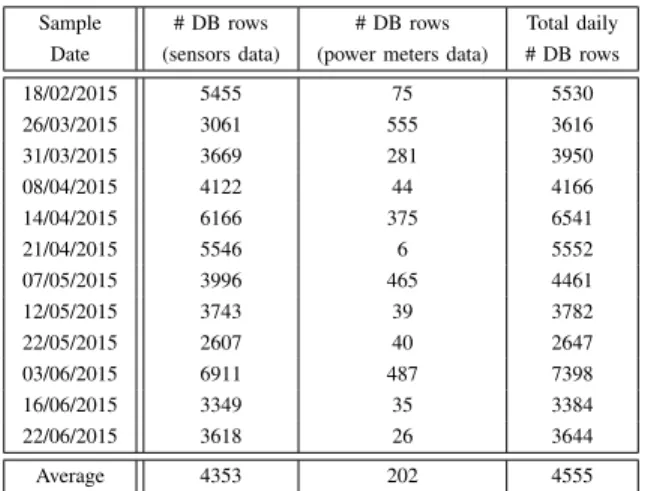
TABLE III: Daily and average amount of DB rows generated by devices of the AAL platform (sensors and power meters), and stored in the local database. Data refer to days chosen randomly over a period of four months
Sample # DB rows # DB rows Total daily Date (sensors data) (power meters data) # DB rows
18/02/2015 5455 75 5530 26/03/2015 3061 555 3616 31/03/2015 3669 281 3950 08/04/2015 4122 44 4166 14/04/2015 6166 375 6541 21/04/2015 5546 6 5552 07/05/2015 3996 465 4461 12/05/2015 3743 39 3782 22/05/2015 2607 40 2647 03/06/2015 6911 487 7398 16/06/2015 3349 35 3384 22/06/2015 3618 26 3644 Average 4353 202 4555
touchscreen devices. The identification code of the food or drug is collected by the NFC reader and Wi-Fi transmitted to the local server, where the proper REST service uses the code to query the DB tables listing the food or drugs information. A JSON object containing the information is generated and transmitted by the server to the available local interfaces, to be properly delivered to the user. All the data exchanges described above take place within the local architecture of the AAL platform; the data flow towards the remote cloud-based entity is unidirectional, and consists in the transmission of JSON objects generated by the local REST services, taking as input the aggregated data tables described in Section III-B.
IV. RESULTS AND DISCUSSION
With the aim of evaluating the issues to face in data handling when moving towards an IoT approach for the deployment of the considered AAL platform, here we provide some experimental evaluation of the data volumes generated by the devices and currently managed according to the procedures discussed in the previous Section. The reported values refer to a living lab deployment of the aforementioned platform; for this reason, results will be provided for environmental sensors and power meters, as the amount of data collected from the BSNC or the smart insoles is not significant. Nevertheless, the available results may be assumed as a reliable picture of a real-life implementation, being the lab used by people during the day to perform common activities of daily living, such as cooking at lunch time.
1) Raw sensor data: Table III shows the number of DB rows recorded daily in two specific tables of the database, concerning, respectively, data collected by the set of sensors included in the platform, and by the power meters installed in the Living Lab premise. The dates have been selected randomly over a period of four months, and refer to days of the week from Monday to Friday. When the Lab is closed, i.e. during the weekend or holidays, around 300 rows are collected daily, due to alive messages generated by the sensors. If we consider only the relevant information (data and timestamp), thealivemessages alone take approximately 20 KB of memory
space per day, compared to an average amount of 300 KB on the other days, due to the activations of the AAL sensors. If all the records mentioned in Table III are considered, the amount of required memory increases to 30 KB and 400 KB, respectively. The sensors table includes events detected by: i) 3 presence sensors (PIR); ii) 3 magnetic sensors (applied on door, window, refrigerator door); iii) 2 force sensors (sofa, bed); iv) gas and smoke detection sensors; v) water and gas flux meters. Gas, smoke and flux sensors transmit a few data, while the number of activations of force and magnetic sensors is around 50 per day. Consequently, almost all the collected data are generated by the presence sensors, which transmit an activation message every time a presence is detected, and a deactivation message after that.
The power meters table contains the values detected by five power meter nodes: four of them are connected to wall sockets, and one is applied on the general power supply line. Each node transmits the measured power value every minute, which is recorded in the database only if it is different from the previous one. Due to this data handling procedure, the number of rows populated daily could increase, for example, if the devices powered from the monitored sockets are switched on and off frequently. Thus, the amount of row generated by power meters can vary widely, depending on the activities performed in the Lab, and on the specific load connected to each smart socket. This behavior is clearly shown by the varying data reported within the Table III. Conversely, the activation profile of a specific smart socket may disclosure information on the nature of the load connected to it.
2) Aggregated data: Every night, at around 1:00 AM, the server application executes some aggregation tasks, with the aim to process the data collected the day before, and to save the results both in dedicated tables of the local database, and in files that are sent to a remote platform. As for the database, each new row occupies almost 2 KB. By supposing to delete raw data after the creation of aggregated data, several KB of disk space may be saved every day thanks to this operation. Obviously, the larger the amount of data collected during the day, the greater the gain in terms of memory space.
Following the aggregation processing, the server generates three reports formatted as JSON files, containing aggregated data referred to: activity performed during the day, presence in/out of home, energy consumption. Each file of the same type has the same dimension every day, because it has a fixed structure and only the specific values change. The reports are organized as follows:
- Activity: This file reports the daily percentages of the following activities: sleeping, sitting, cooking, walking, stasis. The values are obtained as the sum of the activation intervals detected by the corresponding sensors. The sum of the values does not cover the 100% of daily time, however the aim of the analysis is to monitor some activities of daily living of interest. The file dimension is around 1,3 KB;
-Presence: This file amounts to less than 1 KB, as it con-tains only the indoor/outdoor time percentages, representing the total time in a day that the user spends inside or outside the home (in our case the Lab). The values are calculated as the sum of intervals of presence/non presence, extracted from the raw sensor data by means of a proper algorithm;
-Energy: This file contains data referred to the five power meters previously mentioned, and its dimension is around 41,3 KB. For each device, the following values are provided: minimum, maximum, and average power consumption for each hour. So, for a single power meter, 72 values are generated, in addition to other fields needed for its identification.
3) Discussion: The AAL platform presented in Section III allows to monitor and assist the daily activities of the elder living alone at home, in order to obtain information on his/her behavior. From the analysis of the massive collected data, it is possible to deduce any progressive worsening in the state of health, potential risks, and emergency situations. One of the strengths of the platform is the ability to unobtrusively collect a large amount of behavioral data, without the need for any user action. The fusion of the data obtained from heterogeneous sensors allows to determine the activities carried out by the user. Three types of behavioral analyses are available: Activity, Presence, and Energy usage. While the last concerns only the power consumption and may be derived directly by collecting the data generated from the power meters (static data), without the need of any complex processing algorithms, the former exploit more complex methods of data analysis.
The proposed case study adopts a data management ap-proach based on the primary role of a local server, physically located within the AAL platform, which is able to differentiate the flow of operations to be performed on data, according to a pre-defined set of rules. By this way, for example, static data related to environmental conditions may be stored in a structured repository within the server, and used to take local decisions (like opening or closing windows, to improve air quality). The same data, once merged to other data (e.g. coming from behavioral sensors) are processed on a daily basis, and the extracted information is transferred to a remote, cloud based data analytics platform, for long term observation and feature extraction. On the other hand, time-sensitive data, such as those generated by sensors used to monitor possibly dangerous conditions like falls or anomalous behaviors, can be promptly managed by the local server, to trigger specific actions very fast (like sending immediate alarms to pre-defined recipients), and, later on, transferred to the remote framework. Interoperability of AAL-related data with data originated from certified biomedical sensors and healthcare information systems may be an issue, due to the heterogeneous nature of AAL data, and the variety of formats AAL data may assume. It is well-known that the lack of common data formats and exchange interfaces even among healthcare information systems prevents from an efficient integration of the available patient’s data and, consequently, from the true implementation of connected health services [22]. If other types of data, like those generated and collected by an AAL system, are to be added and merged to clinical data formatted according to standard rules (e.g. HL7, DICOM, ...), it is important to ensure that the required formatting operations are performed before the AAL data transfer occurs. When certified biomedical devices are included in the AAL system, it is important to ensure that the collected data remain compliant to the format and integrity rules prescribed by the selected interoperability standard, thus avoiding the risk to break the certified data flow from the biomedical device to the healthcare information system (e.g. Electronic Health Record).
The simple analysis on data volumes provided above confirms that AAL platforms have to cope with quite different data requirements (see Table III), due to the heterogeneous sensors they host, which impact differently on the storage capacity needed, and the ability to create structured relations among data (see Table II). The approach suggested in [19], and implemented by the platform, is able to support the requested services, and emerges as a possible reference profile for IoT in AAL design.
V. CONCLUSION
This paper investigated the data handling and management issues arising from the adoption of the IoT paradigm in Ambient Assisted Living platforms. The analysis of the experi-ences available within the literature showed that AAL requires differentiated management of heterogenous data generated by sensors, according to the specific requirements of the services using the data itself. This finding has been further supported by the analysis of a practical AAL platform selected as a case study, from which the role of a local server in validating and orchestrating data processing emerged, in contrast to an agnostic data management framework typical of existing vertical applications of IoT. Future research activities will be focused on exploiting these outcomes to propose an AAL profile for data management in IoT.
ACKNOWLEDGMENT
The authors would like to acknowledge the contribution of the COST Action IC1303.
REFERENCES
[1] A. Aztiria, G. Farhadi, and H. Aghajan, “User behavior shift detection in ambient assisted living environments,”JMIR Mhealth Uhealth, vol. 1, no. 1, Jun 2013.
[2] K. Park, Y. Lin, V. Metsis, Z. Le, and F. Makedon, “Abnormal human behavioral pattern detection in assisted living environments,” in Proceedings of the 3rd International Conference on PErvasive Technologies Related to Assistive Environments, ser. PETRA ’10. New York, NY, USA: ACM, 2010, pp. 9:1–9:8. [Online]. Available: http://doi.acm.org/10.1145/1839294.1839305
[3] O. Gama and R. Simoes, “A platform to emulate ambient assisted living environments,” in e-Health Networking, Applications Services (Healthcom), 2013 IEEE 15th International Conference on, Oct 2013, pp. 46–50.
[4] F. Palumbo, J. Ullberg, A. Stimec, F. Furfari, L. Karlsson, and S. Coradeschi, “Sensor network infrastructure for a home care monitoring system,”Sensors, vol. 14, no. 3, p. 3833, 2014. [Online]. Available: http://www.mdpi.com/1424-8220/14/3/3833
[5] C. Nugent, L. Galway, L. Chen, M. Donnelly, S. McClean, S. Zhang, B. Scotney, and G. Parr, “Managing sensor data in ambient assisted living,”Journal of Computer Science and Engineering, vol. 5, no. 3, pp. 237–245, 2011.
[6] F. Corno and F. Razzak, “Real-time monitoring of high-level states in smart environments,” Journal of Ambient Intelligence and Smart Environments, vol. 7, no. 2, pp. 133–153, 2015.
[7] M. M., S. Wagner, C. Pedersen, F. Beevi, and F. Hansen, “Ambient assisted living healthcare frameworks, platforms, standards, and quality attributes,”Sensors, vol. 14, no. 3, pp. 4312–4341, 2014.
[8] D. Rodrigues, E. Horta, B. Silva, F. Guedes, and J. Rodrigues, “A mobile healthcare solution for ambient assisted living environments,” ine-Health Networking, Applications and Services (Healthcom), 2014 IEEE 16th International Conference on, Oct 2014, pp. 170–175.
[9] A. Sheth, “Transforming big data into smart data: Deriving value via harnessing volume, variety, and velocity using semantic techniques and technologies,” in Data Engineering (ICDE), 2014 IEEE 30th International Conference on, March 2014.
[10] R. Mao, H. Xu, W. Wu, J. Li, Y. Li, and M. Lu, “Overcoming the challenge of variety: big data abstraction, the next evolution of data management for aal communication systems,” Communications Magazine, IEEE, vol. 53, no. 1, pp. 42–47, January 2015.
[11] V. Vimarlund and S. Wass, “Big data, smart homes and ambient assisted living,”Yearbook of Medical Informatics, vol. 9, no. 1, pp. 143–149, 2014.
[12] A. Al-Fuqaha, M. Guizani, M. Mohammadi, M. Aledhari, and M. Ayyash, “Internet of things: A survey on enabling technologies, protocols and applications,”Communications Surveys Tutorials, IEEE, 2015.
[13] A. Dohr, R. Modre-Opsrian, M. Drobics, D. Hayn, and G. Schreier, “The internet of things for ambient assisted living,” in Information Technology: New Generations (ITNG), 2010 Seventh International Conference on, April 2010, pp. 804–809.
[14] A. Jara, M. Zamora, and A. Skarmeta, “Knowledge acquisition and management architecture for mobile and personal health environments based on the internet of things,” inTrust, Security and Privacy in Com-puting and Communications (TrustCom), 2012 IEEE 11th International Conference on, June 2012, pp. 1811–1818.
[15] M. Kiran, P. Rajalakshmi, K. Bharadwaj, and A. Acharyya, “Adaptive rule engine based iot enabled remote health care data acquisition and smart transmission system,” inInternet of Things (WF-IoT), 2014 IEEE World Forum on, March 2014, pp. 253–258.
[16] C. Tsirmpas, A. Anastasiou, P. Bountris, and D. Koutsouris, “A new method for profile generation in an internet of things environment:
An application in ambient assisted living,”Internet of Things Journal, IEEE, vol. PP, no. 99, pp. 1–1, 2015.
[17] J. Lloret, A. Canovas, S. Sendra, and L. Parra, “A smart communication architecture for ambient assisted living,” Communications Magazine, IEEE, vol. 53, no. 1, pp. 26–33, January 2015.
[18] H. Alemdar, “Multi-resident human behaviour identification in ambient assisted living environments,” in Proceedings of the 16th International Conference on Multimodal Interaction, ser. ICMI ’14. New York, NY, USA: ACM, 2014, pp. 369–373. [Online]. Available: http://doi.acm.org/10.1145/2663204.2666286
[19] W. Kun, S. Yun, S. Lei, H. Guangjie, and Z. Chunsheng, “Ldpa: a local data processing architecture in ambient assisted living communications,” Communications Magazine, IEEE, vol. 53, no. 1, pp. 56–63, January 2015.
[20] Q. Tan, N. El-Bendary, F. Pivot, and A. Lam, “Elderly healthcare data protection application for ambient assisted living,” in Advances in Security of Information and Communication Networks, ser. Communications in Computer and Information Science, A. Awad, A. Hassanien, and K. Baba, Eds. Springer Berlin Heidelberg, 2013, vol. 381, pp. 196–203. [Online]. Available: http://dx.doi.org/10.1007/ 978-3-642-40597-6 17
[21] S. Spinsante, E. Cippitelli, A. De Santis, E. Gambi, S. Gasparrini, L. Montanini, and L. Raffaeli, “Multimodal interaction in a elderly-friendly smart home: A case study,” in Mobile Networks and Management, ser. Lecture Notes of the Institute for Computer Sciences, Social Informatics and Telecommunications Engineering, R. Agero, T. Zinner, R. Goleva, A. Timm-Giel, and P. Tran-Gia, Eds. Springer International Publishing, 2015, vol. 141, pp. 373–386. [Online]. Available: http://dx.doi.org/10.1007/978-3-319-16292-8 27 [22] Y.-F. Lee, “An interoperability solution for legacy healthcare devices,”