
i
DON MVUDUDU
A dissertation submitted to the Faculty of Science, University of the
Witwatersrand, in fulfillment of the requirements for the degree of Master of
Science in the School of Molecular and Cell Biology.
Johannesburg 2017
Screening of cassava improved
germplasm for potential resistance
ii
Declaration
I, Don Mvududu (1008190), am a student registered for the degree of Master of Science (MCBG8002) in the academic year 2016. I hereby declare the following:
• I am aware that plagiarism (the use of someone else’s work without their permission and/or without acknowledging the original source) is wrong.
• I confirm that the work submitted for assessment for the above degree is my own unaided work except where explicitly indicated otherwise and acknowledged.
• I have not submitted this work before for any other degree or examination at this or any other University.
• The information used in the Thesis HAS NOT been obtained by me while employed by, or working under the aegis of, any person or organisation other than the University.
• I have followed the required conventions in referencing the thoughts and ideas of others. • I understand that the University of the Witwatersrand may take disciplinary action against me if there is a belief that this is not my own unaided work or that I have failed to acknowledge the source of the ideas or words in my writing.
iii
Acknowledgements
I would like to extend my deepest gratitude to my supervisor, Professor Chrissie Rey for the opportunity to work in her laboratory, valuable advice and guidance during the last two years.
I would like to thank the University of the Witwatersrand for the Postgraduate merit award and scholarship, Gauteng Department of Agriculture and Rural Development (GDARD) and Wits Seed Fund for financial support.
I am deeply indebted to my colleagues (past and current) in the Cassava Biotechnology Laboratory for their support, assistance and advice.
Special thanks to my parents, siblings and my better half Eunice for their endless support, encouragement and unweavering belief in me. I am grateful for their love and ongoing prayers throughout this challenging academic journey.
Last but not least, my God, for this wonderful experience and opportunity. For everything comes from him, exists by his power and is intended for his glory.
iv
Research Outputs
Conferences
Rey, M.E.C., Mvududu, D. Moralo, M. (2015). Improved virus-resistant cassava for small-scale and commercial farmers. Oral presentation at the 8th Annual Agriculture Symposium, 04 June 2015, Pretoria.
Rey, M.E.C., Mvududu, D., Moralo, M. (2016). Screening of CMM6 and AMM2 transgenic cassava lines for resistance to cassava mosaic disease. 19th Biennial SASM conference. Coastlands Umhlanga Durban 17-20 January 2016 (Poster presentation).
Rey, M.E.C., Mvududu, D., Moralo, M. (2016). Screening of cassava expressing stacked non-mismatched or mismatched inverted repeat constructs derived from African cassava mosaic virus ORFs. Oral presentation at the 9th Annual Agriculture Symposium, 02 June 2016, Pretoria.
v
Abstract
With growing populations and climate change associated drought predicted for the future, cassava can provide one solution for food security and a source of starch for industrial use and biofuels in South Africa, and other countries in the SADC region. One of the severe constraints on cassava production is cassava mosaic disease (CMD) caused by cassava infecting begomoviruse species, including African cassava mosaic virus (ACMV), South African cassava mosaic virus (SACMV) and East African cassava mosaic virus (EACMV). Cassava begomoviruses (CBVs) are responsible for significant yield loss of the starchy tubers. Since no chemical control of virus diseases of plants is possible, one approach to develop virus resistance is via biotechnology, through genetic engineering (GE) of cassava with hairpin RNA (hpRNA) silencing constructs that express small interfering RNAs targeting CBVs and preventing severe disease development. The aim of this project was to subject previously transformed five CMM6 cassava lines (cv. 60444 transformed with a non-mismatched Africa cassava mosaic virus-[Nigeria:Ogorocco;1990] ([NG:Ogo:90])-derived hpRNA construct, six AMM2 (cv. 60444 transformed with a mismatched ACMV-[NG:Ogo:90]-derived hpRNA construct), six CMM8 cassava lines (cv.60444 transformed with a non-mismatched SACMV BC1-derived hpRNA construct) and seven AMM4 cassava lines (cv.604444 transformed with a mismatched SACMV BC1-derived hpRNA construct) to reproducible trials, and evaluate for response to virus challenge. The ACMV-[NG:Ogo:90] hpRNAi constructs target 4 overlapping virus open reading frames (ORFs) (AC1 replication associated protein/AC4 and AC2 transcriptional/AC3 replication enhancer), while the SACMV hpRNAi constructs target the cell-to cell movement BC1 ORF. Non mismatched constructs consist of a transformation cassette that has an intron separating the sense and antisense arms of the viral transgene whilst mismatched constructs have the sense arm of the viral transgene treated with bisulfite to induce base mutation. This mutated sense arm is then separated from the non mutated antisense arm by a small spacer. Furthermore, a 229 bp inverted repeat hpRNA construct (DM-AES) was designed to target ACMV-[NG:Ogo:90] 117 nt putative promoter region (2714-49 nt), a 91 nt overlapping sequence (1530-1620 nt) between ACMV-[NG:Ogo:90] AC1 3’ end and AC2 5’ end (AC1 3’/AC2 5’-ter) as well as being efficient against SACMV and EACMV due to the inclusion of a 21 nt conserved sequence (1970-1990) of AC1/Rep shared between ACMV, EACMV and SACMV. Cassava landrace T200 friable embryogenic callus (FEC) were transformed with this construct. The
vi selected transgenic lines were infected with either ACMV-[NG:Ogo:90] (CMM6 and AMM2 transgenic lines) or SACMV (CMM8 and AMM4 transgenic lines) by agro-inoculation and monitored at 14, 36 and 56, 180 and 365 days post infection (dpi) for symptom development, plant growth and viral load. From the ACMV trials 3 lines (CMM6-2, CMM6-6 and line AMM2-52) showed significantly lower symptom scores and lower viral load at 36, 56 and 365 dpi, compared with viral challenged untransgenic cv.60444. This phenotype is described as tolerance, not resistance, as despite ameleriorated symptoms virus replication persists at lower levels. From the SACMV infectivity trials even though all CMM8 and AMM4 transgenic lines had lower symptom severities and viral loads compared with infected untransformed cv.60444, the results were not highly significant (p˃ 0.05). From this study, tolerance or reduction of viral load and symptoms was attributed to the accumulation of transgene-derived siRNAs prior to infection. However there was no observable correlation between levels (semi-qauntitative northern blots) of siRNAs and tolerance or susceptible phenotypes. Tuber yield evaluation of the three tolerant lines (CMM6-2, CMM6-6 and line AMM2-52) showed that the tuber fresh and dry weight at 365 dpi was not affected by the viral presence. These are promising lines for larger greenhouse and field trials. A comparison between the two different constructs showed that the two tolerant CMM6 lines-2 and 6 appeared to perform better (viral load) compared with AMM2 tolerant line-52 with regards to levels of viral amplification. The mismatched construct in AMM4 lines and the non-mismatched construct in CMM8 lines induced the same viral and symptom severity score (sss) reduction. Transformation of T200 FECs with the DM-AES construct was unsuccessful due to the age (more than six months old) of the FECs. FECs are more likely to lose their regeneration and totipotent nature with age. We therefore propose the use of fresh T200 FECs in future transformation studies to test the DM-AES construct.
vii Table of contents
Screening of cassava improved germplasm for potential resistance against cassava
mosaic disease ... i Declaration ... ii Acknowledgements ... iii Research Outputs... iv Abstract ... v List of Figures ... ix List of Tables ... xx
List of Appendices ... xxi
List of Abbreviations ... xxii
Chapter 1 Literature Review ... 1
1.1. Cassava ... 1
1.2. Agricultural Importance of Cassava ... 1
1.3 Constraints of Cassava ... 2
1.4 Geminiviruses... 5
1.5 Plants response to viral infection ... 7
1.6 RNA silencing ... 8
1.7 Viral RNA silencing suppressors ... 12
1.8 Manipulation of RNA silencing mechanisms to combat plant diseases ... 14
1.9 Resistance strategies against cassava mosaic disease ... 16
1.10 Genetic engineering... 18
1.11 Public perception on GM crops and the state of GM technology in Africa ... 20
1.12 Rationale for study ... 21
1.13 Research Objective and Specific aims ... 23
Specific aims ... 23
Chapter 2 Screening of cassava expressing stacked non-mismatched or mismatched hairpin RNA constructs derived from African cassava mosaic virus [NG] ORFs ... 26
2.1 Introduction ... 26
2.1.1 Specific Aims ... 29
2.2 Methodology flow chart ... 30
2.3 Materials and Methods ... 31
2.4 Results ... 38
viii Chapter 3 Screening of cassava expressing mismatched or non-mismatched hairpin RNA constructs derived from South African cassava mosaic virus BC1/Cell-to-cell
movement ORF ... 68
3.1 Introduction ... 68
3.1.1 Specific Aims ... 70
3.2 Methodology flow chart ... 71
3.3 Materials and Methods ... 72
3.4 Results ... 74
3.5 Discussion ... 92
Chapter 4 Transformation of cassava landrace T200 with a hairpin RNA silencing construct against African cassava mosaic virus, East African cassava mosaic virus and South African cassava mosaic virus ... 96
4.1 Introduction ... 96
4.1.1 Specific Aims ... 99
4.2 Methodology flow chart ... 100
4.3 Materials and Methods ... 101
4.4 Results ... 108
4.5. Discussion ... 120
Chapter 5: Conclusions ... 124
References ... 127
ix
List of Figures
Chapter 1
Figure 1. 1 Cassava (Manihot esculenta Crantz) plant (left) and high carbohydrate tuberous roots (right) (Stupak et al., 2006)... 1
Figure 1. 2 Map showing Geographical distribution of cassava-infecting begomoviruses together with all the species and strains of cassava mosaic begomoviruses (CB8Vs) in Africa as well as the Indian subcontinent. The green coloured regions indicate areas under cassava cultivation and different coloured dots represent specific specie (Patil and Fauquet, 2009). ... 4
Figure 1. 3 The whitefly Bemisia tabaci (Gennadius) (Cuthbertson, 2013) ... 5
Figure 1 4 Symptoms of CMD: A green leaf mosaic B, yellow leaf mosaic, C severe leaf deformation (Vanitharani et al., 2005) ... 6
Figure 1. 5 Bipartite genome of begomoviruses showing their respective open reading frames (Palmer and Rybicki, 1997) ... 7
Figure 1. 6 Overview of steps involved in RNAi pathway involving (1, 2) processing of dsRNA intermediates by Dicer into primary siRNA production. (3, 4) siRNA unwinding and incorporation into RISC complex (5) sequence-specific degradation of complementary mRNA (Sherman et al., 2015) ... 10
Figure 1. 7 Model of antiviral RNA silencing mechanism in plants and its suppression by virus-encoded silencing suppressors. The model shows the various target area on the silencing mechanism were certain VSRs (i.e. P14, P38, 2b, P6, P21, P0) interact with the silencing pathways (Burgyan and Havelda, 2011) ... 13
Figure 1. 8 An overview of the Hellsgate cloning strategy. The target gene is amplified and attB1 sites are added to both flanks of the gene. The target gene is then cloned into the attP1/attP2 or attP2/attP1 in sense or antisense orientation in respect to the intron using Gateway recombination. The recombination sites have a ccdB gene for easy selection. The
x pHellsgate backbone has a Cauliflower mosaic virus (CaMV) 35S promoter that drives the IR cassette, Agrobacterium nopaline synthase gene; OCS terminator, the terminator sequence of the Agrobacterium octopine synthase gene, Right border and left border sequence from the
Agrobacterium Ti plasmid (Wang and Waterhouse, 2001) ... 16 Chapter 2
Figure 2. 1 Work flow diagram for screening of transgenic cassava lines for resistance ... 30
Figure 2. 2 1% agarose gel of PCR DIG labeled unmodified ACMV-[NG:Ogo:90] IR, hyg
and GUSPLUS fragment probes. M= O’GeneRuler 1 kb Plus DNA ladder (Fermentas). DIG-labeled GUSPLUS probe (lane b) unlabeled GUSPLUS PCR amplicon (lane a) DIG-labeled
hyg probe (lane d) unlabeled 485 bp hyg fragment (lane c) and unmodified ACMV-[NG:Ogo:90] IR DIG-probes (lane f) unlabeled 319 bp ACMV-ACMV-[NG:Ogo:90] IR PCR amplicon (lane e)... 39
Figure 2. 3 Southern blot analysis of CMM6 transgenic lines 2, 3, 5, 6 and 7 for transgene integration using DIG-labeled probes. M = DIG molecular weight marker (Roche), cv. = non-infected healthy cv.60444 and +ve C = pC1305.1/CaMV35S- ACMV-[NG:Ogo:90] IR (a)
HindIII and EcoRI-double digested genomic DNA probed with ACMV-[NG:Ogo:90] IR fragment and (b) HindIII-digested genomic DNA, probed with hyg probe ... 40
Figure 2. 4 Southern blot analysis of AMM2 transgenic lines 30, 41, 44, 52, 53 and 54 for transgene integration using DIG-labeled probes. M = DIG molecular weight marker (Roche), cv. = non-infected healthy cv.60444 and +ve C = HindIII and EcoRI-double digested pTZR5/T containing MM2hp cassette (a) HindIIIand EcoRI-double digested genomic DNA probed with ACMV-[NG:Ogo:90] IR fragment and (b) HindIII-digested genomic DNA, probed with hyg probe. ... 41
Figure 2. 5 PCR confirmation of the transgenic status of CMM6 lines. M= O’GeneRuler 1 kb Plus DNA ladder (Fermentas), (-) = untransformed healthy cv.60444 and +ve = positive pC1305.1/CaMV35S- ACMV-[NG:Ogo:90] IR and NTC = non template control. Lines were screened for (b) 181 bp GUSPLUS fragment; fragment was successfully amplified in all lines screened and the 485 bp hyg fragment was detected in all lines tested. (a) PCR amplification
xi of both the 331 bp XbaI-arm and the 339 bp XhoI-arm of the construct ACMV-[NG:Ogo:90] IR... 42
Figure 2. 6 1% agarose gel electrophoresis of hyg, GUSPLUS and ACMV-[NG:Ogo:90] IR construct PCR amplicons of the six AMM2 transgenic lines 30, 41, 44, 52, 53 and 54. M= O’GeneRuler 1 kb Plus DNA ladder (Fermentas), (-) = untransformed healthy cv.60444 and + ve = positive pC1305.1/CaMV35S- ACMV-[NG:Ogo:90]-NOg IR. Lines were screened for the (a) 337 bp mutated sense-arm amplicon and the 331 bp non-mutated antisense-arm amplicon. (b) 181 bp GUSPLUS gene amplicon and 485 bp hyg gene amplicon ... 43
Figure 2. 7 Cassava mosaic disease symptomatic leaves from trials in this study. A 0-3 scoring scale was used for evaluation. Each image represents each score level (0 being healthy asymptomatic leaves and 3 being fully symptomatic) ... 44
Figure 2. 8 Symptom severity score of CMM6 and AMM2 transgenic lines, infected untransformed cv.60444 and infected ACMV-[NG:Ogo:90] resistant transgenic line dsAC1 agro-inoculated with infectious ACMV-[NG:Ogo:90] clones. Plants were evaluated at 14 dpi (blue), 36 dpi (red) and 56 dpi (green) (a) CMM6 mean symptom severity scores (b) AMM2 mean symptom severity score ... 45
Figure 2. 9 Viral load of CMM6 and AMM2 transgenic lines, infected untransformed cv.60444 and infected ACMV-[NG:Ogo:90] resistant transgenic line dsAC1 agroinoculated with infectious ACMV-[NG:Ogo:90] clones. Plants were evaluated at 36 dpi (blue), 56 dpi (red) for (a) CMM6 mean absolute viral load quantification (mean viral molecules/g DNA) (b) AMM2 mean absolute viral load quantification (mean viral molecules/g DNA) ... 47
Figure 2. 10 Height evaluations for CMM6 and AMM2 transgenic lines, infected untransformed cv.60444 and infected ACMV-[NG:Ogo:90] resistant line dsAC1. Plants were evaluated at 14 dpi (blue), 36 dpi (red) and 56 dpi (green) (a) CMM6 mean average height (b) AMM2 mean average height. ... 49
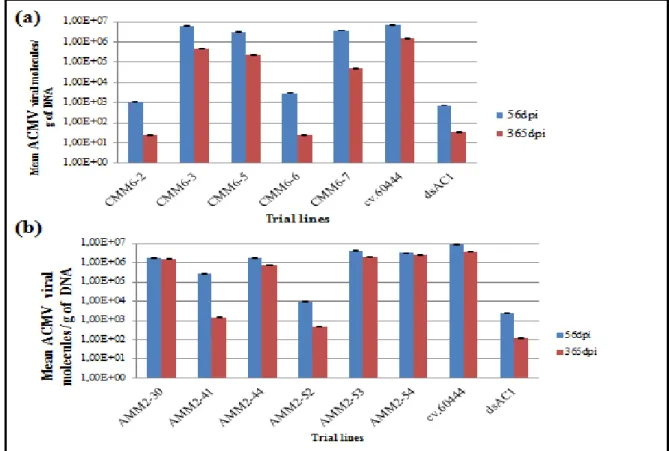
Figure 2. 11 Mean ACMV viral molecules/g of DNA at 365 dpi compared to mean viral molecules/g of DNA at 56 dpi, quantified using real time absolute qPCR, (a) ACMV infected
xii CMM6 transgenic lines, infected untransformed cv.60444 and infected ACMV-[NG:Ogo:90] resistant transgenic line dsAC1 (b) ACMV infected AMM2 transgenic lines, infected untransformed cv.60444 and infected ACMV-[NG:Ogo:90] resistant transgenic line dsAC1 ... 50
Figure 2. 12 Pictorial representation of the tuber exhibiting the highest yield from each of the CMM6 trangenic lines 2, 3, 5, 6 and 7, infected untransformed cv.60444, non-infected healthy cv.60444 and infected ACMV-[NG:Ogo:90] resistant transgenic line dsAC1 ... 51
Figure 2. 13 Pictorial representation of the tuber exhibiting the highest yield from each of the AMM2 trangenic lines 30, 41, 44, 52, 53 and 54, infected untransformed cv.60444, non-infected healthy cv.60444 and ACMV-[NG:Ogo:90] resistant transgenic line dsAC1 ... 52
Figure 2. 14 Mean tuber fresh weight (blue) and mean tuber dry weight (red) of (a) CMM6 transgenic lines, infected untransformed cv.60444, non-infected healthy cv.60444 and infected ACMV-[NG:Ogo:90] resistant transgenic line dsAC1 (b) AMM2 transgenic lines, infected untransformed cv.60444, non-infected healthy cv.60444 and infected ACMV-[NG:Ogo:90] resistant transgenic line dsAC1 ... 54
Figure 2. 15 Mean percentage tuber dry weight of (a) CMM6 and (b) AMM2 trial lines, infected untransformed cv.60444, non-infected healthy cv.60444 and ACMV-[NG:Ogo:90] resistant transgenic line dsAC1. The percentage was calculated from the difference between the tuber fresh weight and dry weight... 55
Figure 2. 16 1.2% agarose gel electrophoresis of total RNA extracted from (a) CMM6 transgenic lines 2, 3, 5, 6, 7, non-infected healthy cv.60444. (b) AMM2 transgenic lines 30, 41, 44, 52, 53, 54 and non-infected healthy cv.60444 ... 56
Figure 2. 17 RT-PCR amplification of transgene sense arm, GUSPLUS and hyg genes from CMM6, AMM2 and non-infected healthy cv.60444 negative control. M= O’GeneRuler 1 kb Plus DNA ladder (Fermentas). cv. = non-infected healthy cv.60444 negative control. + = positive control transgene plasmid (a) amplication of CMM6 transgenic lines sense arm (ai) amplification of endogenous ubiquitin gene from CMM6 cDNA (b) amplification of AMM2
xiii transgenic lines mutated sense arm (bii) amplification of endogenous ubiquitin gene from AMM2 cDNA (c) amplification of 181 bp GUSPLUS and 485 bp hyg from CMM6 transgenic lines cDNA (d) amplification of 181 bp GUSPLUS and 485 bp hyg from AMM2 transgenic lines cDNA... 57
Figure 2. 18 Determination of the DIG labeling efficiency on (a) ACMV-[NG:Ogo:90] AC1/4:AC2/3 IR sense arm (b) ACMV-[NG:Ogo:90] AC1/4;AC2/3 antisense arm (a) a Northern Starter Kit (Roche) labelled RNA control.(d) labeled DIG oligonucleotide tailing kit 2nd generation (Roche) 30 nt control (d) labeled 24 nt oligonucleotide and (e) labeled 21 nt
Arabidopsis mi167 ... 58
Figure 2. 19 Northern blot siRNA detection (a) CMM6 transgenic lines and healthy cv.60444 probed with DIG-labeled ACMV-[NG:Ogo:90] IR derived probe (b) AMM2 transgenic lines and healthy cv.60444 probed with DIG-labeled ACMV-[NG:Ogo:90] IR derived probe. (ai) CMM6 and (bi) AMM2 transgenic lines and healthy cv.60444 probed with DIG labeled
Arabidopsis miRNA 167 probe. The percentage numbers above represent relative accumulation levels of the siRNAs ... 59
Figure 2. 20 Northern blot for siRNA detection (a) CMM6 transgenic lines, infected untransformed cv.60444 and non-infected healthy cv.60444 probed with DIG labeled ACMV-[NG:Ogo:90] IR derived probe (b) AMM2 transgenic lines, infected untransformed cv.60444 and non-infected healthy cv.60444 probed with DIG labeled ACMV-[NG:Ogo:90] IR derived probe. (ai) CMM6 and (aii) AMM2 transgenic lines and controls probed with DIG labeled Arabidopsis miRNA 167 probe. The percentage numbers above represent relative accumulation levels of the siRNAs ... 60 Chapter 3
Figure 3. 1 Work flow diagram for screening of transgenic cassava lines for resistance/tolerance to SACMV ... 71
Figure 3. 2 1% agarose gel of DIG labeled unmodified BC1 PCR fragments, hyg and
GUSPLUS PCR fragments probes. M= O’GeneRuler 1 kb Plus DNA ladder (Fermentas). DIG-labeled GUSPLUS PCR amplicon (lane b) unlabeled GUSPLUS PCR amplicon (lane a)
xiv DIG-labeled hyg probe (lane d) unlabeled 485 bp hyg PCR fragment (lane c) and unmodified BC1 DIG-probes (lane f) unlabeled 221 bp BC1 amplicon (lane e)... 75
Figure 3. 3 Southern blot analysis of CMM8 transgenic lines for transgene integration using DIG-labeled probes. M = DIG molecular weight marker (Roche), cv. = untransformed healthy cv.60444 and +veC = pC1305.1/CaMV35S BC1 IR (a) HindIII and EcoRI-double digested genomic DNA probed with BC1 probe and (b) HindIII-digested genomic DNA, probed with hyg probe ... 76
Figure 3. 4 Southern blot analysis of AMM4 transgenic lines for transgene integration using DIG-labeled probes. M = DIG molecular weight marker (Roche), cv. = untransformed healthy cv.60444 and +ve = HindIII and EcoRI-double digested pTZR5/T containing MM4hp cassette (a) HindIIIand EcoRI-double digested genomic DNA probed with BC1 IR probe and (b) HindIII-digested genomic DNA, probed with hyg probe ... 77
Figure 3. 5 PCR confirmation of the transformation cassette in CMM8 lines transgenic status. M= O’GeneRuler 1 kb Plus DNA ladder (Fermentas), cv. = negative control untransformed cv.60444. Transgenic lines were screened for (b) 181 bp GUSPLUS fragment was successfully amplified in all lines screened and the 485 bp hyg gene fragment was detected in all lines tested.(b) PCR amplification of both the 221 bp sense and antisense-arm of the BC1 IR construct in CMM8 transgenic lines ... 78
Figure 3. 6 1% agarose gel electrophoresis of hyg, GUSPLUS and the BC1 RNAi construct PCR amplicons of AMM4 transgenic lines. M= O’GeneRuler 1 kb Plus DNA ladder (Fermentas), cv. = untransformed cv.60444 and +ve = positive plasmid controls. Transgenic lines were screened for the (a) 221 bp mutated sense-arm amplicon and the 221 bp non-mutated antisense-arm. (b) 181 bp GUSPLUS gene fragment and 485 bp hyg gene ... 79
Figure 3. 7 Cassava mosaic disease symptomatic leaves from trials in this study. 0-3 scoring scale used for evaluation ... 80
Figure 3. 8 Symptom severity score of CMM8, AMM4 transgenic lines, infected untransformed cv.60444 and ACMV-[NG:Ogo:90] resistant transgenic line dsAC1
agro-xv inoculated with infectious SACMV viral clones. Plants were evaluated at 14 dpi (blue), 36 dpi (red) and 56 dpi (green) (a) CMM8 mean symptom severity scores (b) AMM4 mean symptom severity score... 81
Figure 3. 9 Viral load evaluation for CMM8, AMM4 transgenic lines, infected untransformed cv.60444 and ACMV-[NG:Ogo:90] resistant transgenic line dsAC1 agro-inoculated with infectious SACMV clones. Plants were evaluated at 36 dpi (blue) and 56 dpi (red) (a) CMM8 mean absolute viral load quantification (mean viral molecules/g DNA) (b) AMM4 mean absolute viral load quantification (mean viral molecules/g DNA) ... 83
Figure 3. 10 Plant height evaluation of CMM8, AMM2 transgenic lines, untransformed cv.60444 and ACMV-[NG:Ogo:90] resistant transgenic line dsAC1. Plants were evaluated at 14 dpi (blue), 36 dpi (red) and 56 dpi (green) (a) CMM8 mean average height (b) AMM4 mean average height ... 84
Figure 3. 11 Mean viral molecules/g of DNA at 180 dpi compared with mean viral molecules/g of DNA at 56 dpi, quantified using absolute real time qPCR, (a) Viral load of SACMV infected CMM8 transgenic lines, infected untransformed cv.60444 and infected ACMV-[NG:Ogo:90] resistant transgenic line dsAC1 (b) SACMV infected AMM4 transgenic lines, infected untransformed cv.60444 and infected ACMV-[NG:Ogo:90] resistant transgenic line dsAC1 ... 85
Figure 3. 12 1.2% agarose gel electrophoresis (10mg/ml EtBr) of total RNA extracted from (a) CMM8 transgenic lines and non-infected untransformed cv.60444. (b) AMM4 transgenic lines and non-infected untransformed cv.60444 ... 86
Figure 3. 13 RT-PCR amplification of the BC1 IR transgene, GUSPLUS and hyg genes from CMM8, AMM4 transgenic lines and healthy cv.60444 negative control. M= O’GeneRuler 1 kb Plus DNA ladder (Fermentas). cv. = healthy cv.60444 negative control. + = positive control transgene plasmid (a) amplication of CMM8 transgenic lines sense arm (aii) amplification of endogenous ubiquitin gene from CMM8 cDNA (b) amplication of CMM8 transgenic lines antisense arm (bii) amplification of endogenous ubiquitin gene from CMM8
xvi cDNA. (c) amplification of 181 bp GUSPLUS from CMM8 transgenic lines cDNA. (d) amplification of 485 bp hyg from CMM8 transgenic lines cDNA ... 87
Figure 3. 14 RT-PCR amplification of BC1 IR transgene, GUSPLUS and hyg genes from AMM4 and healthy cv.60444 negative control. M= O’GeneRuler 1 kb Plus DNA ladder (Fermentas). cv. = healthy cv.60444. + = positive control transgene plasmid (a) amplication of AMM4 transgenic lines non-mutated antisense arm (aii) amplification of endogenous
ubiquitin gene from CMM8 cDNA (b) amplication of AMM4 transgenic lines mutated sense arm (bii) amplification of endogenous ubiquitin gene from AMM4 cDNA. (c) amplification of 181 bp GUSPLUS from AMM4 transgenic lines cDNA. (d) amplification of 485 bp hyg
from AMM4 transgenic lines cDNA ... 88
Figure 3. 15 Determination of the DIG labeling efficiency of the BC1 RNA as well as the marker nucleotides (a) a Northern Starter Kit (Roche) positive RNA control. (b) BC1 IR sense arm (c) labeled 24 nt primer and (d) labeled 21 nt Arabidopsis mi167 ... 89
Figure 3. 16 siRNA detection (a) CMM8 transgenic lines and non-infected healthy cv.60444 probed with DIG labeled BC1 derived probe (b) AMM4 transgenic lines and non-infected healthy cv.60444 probed with DIG labeled BC1 derived probe. (ai) CMM8 and (bi) AMM4 transgenic lines and non-infected healthy cv.60444 probed with DIG labeled Arabidopsis
miRNA 167 probe. The numbers above represent each trial line ... 90
Figure 3. 17 siRNA detection (a) CMM8 transgenic lines, infected untransformed cv.60444 (cv I) and non-infected healthy cv.60444 (cv NI) probed with DIG labeled BC1 derived probe (b) AMM4 transgenic lines, infected untransformed cv.60444 (cv I) and non-infected healthy cv.60444 (cv NI) probed with DIG labeled BC1 derived probe. (ai) CMM8 and (bi) AMM4 transgenic lines and control line probed with DIG labeled Arabidopsis miRNA 167 probe. The numbers above represent each trial line ... 91
Chapter 4
Figure 4. 1 Flow diagram of the methodology in construct design cloning and transformation into cassava T200 FECs ... 100
xvii Figure 4. 2 A segment of the multiple sequence alignment output screen. Alignment was performed on 3 CBV isolates ACMV, SACMV and EACMV to identify the sequence similarity between the chosen putative promoter region on ACMV-[NG:Ogo:90] DNA-A and the corresponding region on SACMV DNA A and EACMV DNA A around the TATA box (circled) ... 108
Figure 4. 3 A segment of the multiple sequence alignment output screen. Showing the second chosen region, a 90 nt region between 1530-1620 nt on the overlapping region of ACMV-[NG:Ogo:90] DNA-A AC1 3’ end and AC2 5’ end (AC1 3’/AC2 5’-ter). Alignment was performed on 3 CBVs ACMV, SACMV and EACMV to identify the sequence similarity between this 90 nt AC1 3’/AC2 5’-ter overlapping region on ACMV-[NG:Ogo:90] DNA-A and the corresponding region on SACMV DNA A and EACMV DNA A. ... 109
Figure 4. 4 A segment of the multiple sequence alignment output screen. Alignment was performed on DNA-A AC1 ORFs of ACMV, SACMV and EACMV to identify a 21 nt conserved region along the AC1 genome ... 109
Figure 4. 5 Diagram of ACMV-[NG:Ogo:90] DNA-A highlighting the three transgene target areas, [NG:Ogo:90] 117 nt putative promoter region (2714-49 nt), 21 nt ACMV-[NG:Ogo:90], SACMV and EACMV AC1 conserved region (1970-1990) and the 91 nt ACMV-[NG:Ogo:90] AC1 3’/AC2 5’ter overlapping region (1530-1620) all shown in orange ... 110
Figure 4. 6 The combined (DM-AES) transgene sequence consisting of the [NG:Ogo:90] 117 nt putative promoter region (white background), the 21 nt ACMV-[NG:Ogo:90], SACMV and EACMV AC1 conserved region (yellow background) and the 91 nt ACMV-[NG:Ogo:90] AC1 3’/AC2 5’ter ... 111
Figure 4. 7 A schematic representation of the IR construct with the intron separating the sense transgene from the antisense transgene ... 112 Figure 4. 8 Computer predicted secondary structure of the IR construct sequence ... 113
xviii Figure 4. 9 1% agarose gel showing pMK-RQ/IR plasmid clones EcoRI and HindIII digestions. Lane 1= O’GeneRuler 1 kb Plus DNA ladder, Lane (a) Undigested pART7 Lane (b) Digested pART7 (c) Digested pMK-RQ/IR plasmid showing the released IR 543 bp fragment ... 113
Figure 4. 10 PCR amplification to screen for presence and orientation of inserts in the completed hairpin constructs. O’GeneRuler 1 kb Plus DNA (Fermentas) (a) 229 bp full transgene construct amplicon. (b) 85 bp intron amplicon (c) 314 bp amplicon to confirm the sense orientation (d) 314 bp amplicon to confirm the antisense orientation ... 114
Figure 4. 11 A schematic representation of the IR cassette between the CaMV promoter and the (NOS) terminator in pART7. The figure also shows the position of the primers used to confirm the orientation of the IR cassette between the CaMV promoter and the NOS terminator ... 114
Figure 4. 12 PCR amplification to screen for presence and orientation of inserts after.ligation. Lane 1 O’GeneRuler 1 kb Plus DNA (Fermentas) (a) (b) 229 bp transgene amplicon (c) (d) Sense orientation confirmation amplicons.(e) (f) Antisense orientation confirmation amplicons ... 115
Figure 4. 13 1% agarose gel showing pART7/IR plasmid digestion to screen clones for successful ligation of the IR. Lane 3= O’GeneRuler 1 kb Plus DNA ladder, Lane (a) NotI digest showing 2641 bp cassette (CaMV35S promoter, the two 229 bp sense and 229 bp antisense hairpin arms and the OCS terminator) Lane (b) EcoRI and HindIII digest showing 543 bp IR released fragment (lane b) ... 116
Figure 4. 14 1% agarose gel of, PCR amplified products to screen for successful ligation and presence of IR cassette in plant transformation vector p1305.1. Lane 1= O’GeneRuler 1 kb Plus DNA ladder (Fermentas), Lane 2, 181 bp GUSPLUS amplicon, Lane 3, 485 bp hyg
amplicon, Lane 4, transgene sense+ intron 314 bp amplicon, Lane 5, intron+ transgene antisense 314 bp amplicon ... 117
xix Figure 4 15 A schematic representation of the transformation cassette with CaMV 35S promoter and NOS terminator as well as the transgene IR within the pCambia left and right border. The figure also shows the location of the primers used to confirm the presents of the transgene ... 117
Figure 4. 16 1% agarose gel of, PCR amplified products to screen for successful ligation and presence of IR/pCambia in Agrobacterium. Lane 1= O’GeneRuler 1 kb Plus DNA ladder
(Fermentas); Lane 2, 181 bp GUSPLUS amplicon; Lane 3, 485 bp hyg amplicon; Lane 4, transgene sense+ intron 314 bp amplicon; Lane 5, intron+ transgene antisense 314 bp amplicon ... 118
Figure 4. 17 Steps in producing transgenic plants (a) T200 FECs chosen for transformation (b) FEC clumps following co-cultivation spread onto mesh on GD + C250 (c) Blue stained FEC after GUSPLUS assay (d) Small cotyledon (arrow) from untransformed T200 control cotyledon after 4 weeks on MSN+C250+H15 ... 119
xx
List of Tables
Table 2. 1 Primers used to amplify the ACMV-[NG:Ogo:90] DNA-A target region ... 33
Table 3. 1 Primers used to amplify BC1 sense and antisense amplicons... 72
Table 4. 1 Primers used to screen for the IR construct ... 103
Table 4. 2 siRNA scan computational results predicting regions along the ACMV-[NG:Ogo:90] 117 nt putative promoter region where effective siRNA could be generated . 111
Table 4. 3 siRNA scan computational results predicting regions along the 91 nt ACMV-[NG:Ogo:90] AC1 3’/AC2 5’ter overlapping region where effective siRNA could be generated ... 112
xxi
List of Appendices
Appendix A Student t-test determining the significance of symptom severity, height and viral load between CMM6 lines and cv.60444s at 14, 36, 56 and 180dpi. ... 158
Appendix B Student t-test determining the significance of symptom severity, height and viral load between AMM2 lines and cv.60444s at 14, 36, 56 and 360dpi. ... 158
Appendix C Student t-test determining the significance of symptom severity, height and viral load between CMM8 lines and cv.60444s at 14, 36, 56 and 180 dpi. ... 159
Appendix D Student t-test determining the significance of symptom severity, height and viral load between AMM4 lines and cv.60444s at 14, 36, 56 and 180 dpi. ... 159
Appendix E Student t-test determining the significance of the fresh yield weights obtained between CMM6, AMM2 lines and cv.60444s at 365 dpi. ... 160
Appendix F Student t-test determining the significance of the viral load of CMM6, AMM2, CMM8 and AMM4 at 180 and 365 dpi against wild type cv.60444. ... 161
Appendix G Pearson’s correlation coefficient measuring the relationships (correlation) between our three test parameters, symptom severity score (sss), plant height, and viral load for A-MM2, A-MM4, C-MM6 and C-MM8, at 14, 36 and 56 dpi. ... 162
xxii
List of Abbreviations
AC2, AC4: Complementary-sense genes found in begomovirus genomes on DNA-A ACMV: African cassava mosaic virus
ACMV-[NG:Ogo:90]: [Africa cassava mosaic virus-[Nigeria:Ogorocco;1990] AGO: Argonaute protein
ARC: Agriculture Research Council
AV1, AV2: Virion-sense genes found in begomovirus genomes on DNA-A BAP: 6-Benzylaminopurine
BC1: Complementary-sense gene found in begomovirus genomes on DNA-B CaLCuv: Cabbage Leaf curl virus
CaMV: Cauliflower mosaic virus CBV: cassava begomovirus CEM: cassava elongation medium CIM: callus induction medium
CIASA: Cassava Industry Association of Southern Africa
BV1: Virion-sense gene found in begomovirus genomes on DNA-B CMD: Cassava mosaic disease
CMB: Cassava mosaic begomovirus CMV: Cucumber mosaic virus
CP: Coat protein
CTAB: Cetyltrimethylammonium bromide
CR: Common region shared by DNA-A and DNA-B components of begomovirus genomes
xxiii DCL: Dicer-like protein
DNA: Deoxyribose nucleic acid DNA-A: Bipartite genomic component A DNA-B: Bipartite genomic component B dpi: Days post-inoculation
ds: Double stranded
DTI: Department of Trade and Industry
EACMCV: East African cassava mosaic Cameroon virus
EACMKV: East African cassava mosaic Kenya virus
EACMMV: East African cassava mosaic Malawi virus
EACMV: East African cassava mosaic virus
EACMZV: East African cassava mosaic Zanzibar virus
EDTA: ethylene diamine tetra-acetate FEC: Friable Embryonic cells GD: Gresshoff and Doy GE: Genetic engineering GFP: Green fluorescent protein GM: Genetically modified GV: Geminivirus
hp: hairpin
hyg: hygromycin
ICMV: Indian cassava mosaic Virus
IR: Inverted repeat
xxiv LB: Luria broth
mRNA: messenger RNA miRNA: Micro RNA
MS2: Murashige and Skoog medium 2
MSN Murashige and Skoog Media with 1mg/ml naphthaleneacetic acid NAA: α-naphthaleneacetic acid
NOP: Non profit organisation NOS Nopaline synthase NSP: Nuclear shuttle protein nt: nucleotide
OD: optical density ORF: Open reading frame ori: Origin of replication PCR: Polymerase chain reaction PDR: Pathogen derived resistance
PTGS: Post-transcriptional gene silencing qPCR: Quantitative / Real time PCR RdRp: RNA dependent RNA polymerase REn: Replication enhancement protein Rep: Replication initiation protein
RISC: RNA-induced transcriptional silencing RNA: Ribose nucleic acid
RNAi: RNA interference
xxv SA: South Africa
SACMV: South African cassava mosaic virus
siRNA: Small interfering RNA
SLCMV: Sri Lankan cassava mosaic virus
sRNA: Small RNA ss: Single stranded
SSE: Secondary Somatic Embryo sss: Symptom severity score SqCLV Squash leaf curl virus
T-DNA: Transfer DNA
TGS: Transcriptional gene silencing TIA: Technical Innovation Agency TMV: Tomato mosaic virus
TNA: Total nucleic acid ToLCV: Tomato leaf curl virus TMV: Tobbaco mosaic virus
TNA: Total nucleic acid TuMV: Turnip mosaic virus
TYLCSV Tomato yellow leaf curl Sardina virus
1
Chapter 1 Literature Review
1.1. Cassava
Cassava (Manihot esculenta Crantz) is a tropical, perennial root crop mostly grown in subtropical regions of Africa, Asia and Latin America (Lebot, 2009; Legg et al., 2015). It belongs to the Family Euphorbiaceae which is most common in the tropics and exists either as shrubs, herbs or trees. The Euphorbiaceae family includes rubber, castor beans and cassava (Puonti-Kaelas, 1998). Cassava origins traces back to tropical Southern America and it was introduced in Africa in the 16th century and later Asia by Portuguese traders (Leotard
et al., 2009; Olsen et al., 1999).
The cassava plant grows to between one and three meters in height. Cassava tuber root is cylindrical in shape and has a circular cross section (Sayre et al., 2011). The cross section of the root shows three distinct sections, the bark also called periderm, the peel layer also called phelloderm and the parenchyma which represents the greater percentage of the root and a major hub of starch storage (Lebot, 2004).
Figure 1. 1 Cassava (Manihot esculenta Crantz) plant (left) and high carbohydrate tuberous roots (right) (Stupak et al., 2006)
1.2. Agricultural Importance of Cassava
Cassava is mainly cultivated for its starchy roots. As the cassava plant grows a few of its roots develop into tubers which act as its major storage unit, and this is the edible portion. Cassava is important because 85% of its tuberous root dry weight is starch. In tropical regions cassava is ranked as the third most important food crop behind maize and rice (FAOSTATS, 2013). Among these top ranked important crops, cassava over the period 1980 to 2013 has had the highest increase in global harvest area, amounting to a 44% expansion. In this same
2 period 1980-2013 global cassava tuber production has increased from 124 million tonnes to 255 million tonnes (FAOSTATS, 2013). In the wake of climate change, cassava has become a vital crop for food security in Sub-Saharan African. Cassava has an added advantage of being able to grow in poor soils and to survive prolonged dry spells (El Shawkawy, 2004). Mature cassava can be stored 2 to 3 years in the ground making it easy to be drawn upon in times of drought or social challenges. It is these advantages that make it a very reliable subsistent crop for low income farmers (FAOSTATS, 2013; Lebot, 2004).
In most developing countries such as Africa, 90% of the crop harvest is for human consumption, and this is mainly because it is the cheapest source of calories of all the staple crops (Pounti-Kaelas, 2004). Despite its importance as a food source, cassava has growing industrial potential especially as a source of industrial starch and ethanol. The production of ethanol from cassava and utilization of its waste products (peels) is being explored by various cassava-producing countries. According to Adelekan. (2012) the total cassava production from tropical countries could potentially produce 133 million gallons of ethanol per year. Cassava is also being used to produce starch for industrial and food additive purposes. Maize, wheat and rice are major raw materials sources for starch production, but the usage of cassava starch is increasing due to its large starch content, and it has become a major raw material for paper production, detergent manufacturing and bond agents for tablets (Tonukari et al., 2015). Nigeria recently embarked on new projects for the production of adhesives from cassava starch and it was found to be equally effective as common chemical adhesives (Ozemoya, 2007).
1.3 Constraints of Cassava
Despite several steps being taken to elevate its importance and establishment of a diverse cassava based industry, several issues still challenge such establishment. Cassava production suffers from several biotic (pests and diseases) and abiotic challenges. One post harvest challenge of cassava is the short storage life of the harvest roots (Bull et al., 2011). Biotic stresses that affect cassava include pests and diseases. Although a number of crop protection methods can be implemented to reduce the occurrence of diseases, such as crop rotation and using healthy planting material, cassava still remains vulnerable to many diseases. Among the chief menacing diseases is bacterial blight caused by a proteobacterium, Xanthomonas axonopodis, which is mainly transmitted from plant to plant (Bart et al., 2012). The other major challenges of cassava are viral diseases, including cassava brown streak disease and cassava mosaic disease (CMD). To date, based on homologous demarcations eleven cassava
3 mosaic geminiviruses are known to cause CMD (fig 1.2), two being Asian species, namely
Indian cassava mosaic virus (ICMV) and Sri Lanka cassava mosaic (SLCMV). Africa has the highest dynamism of CBVs with nine different species: African cassava mosaic virus
(ACMV), East African cassava mosaic Malawi virus (EACMMV), East African cassava mosaic Zanzibar virus (EACMZV), South African cassava mosaic virus (SACMV), East African cassava Cameroon virus (EACMCV), East African cassava mosaic virus (EACMV),
East African cassava mosaic Kenya virus (EACMKV), African cassava mosaic Burkina Faso virus (ACMBFV) and Cassava mosaic Madagascar virus (CMMGV) (Fauquet et al., 2007; Legg et al., 2015). Three distinct cassava geminivirus species are more prevalent in Southern Africa (Zimbabwe, South Africa and Mozambique) namely EACMV, ACMV and SACMV (Berry and Rey, 2001).
1.3.1 Cassava Mosaic Disease (CMD)
Cassava mosaic disease is currently one of the most endemic viral diseases for cassava in Africa (Legg et al., 2015; Patil and Fauquet, 2009). The virus induced disease mainly occurs in India and Africa, but was first reported in Tanzania in 1894 by Warburg. It was only in 1906 that Zimmerman suggested that CMD was a direct result of virus infection. CMD has been reported in India, central, eastern and southern Africa causing loses of over US$1 billion annually (IITA, 2014; SciDev, 2016). Cassava mosaic disease is spread by the use of infected plant material or by an infecting whitefly vector Bemisia tabaci (Gennadius) (fig 1.3) (Brown
et al., 1995; Carabali et al., 2010; Legg et al., 2015; Maruthi et al., 2004). Since cassava is vegetatively propagated transmission by infected plant material is widespread. B. tabaci is the only known vector to spread CMD, and is also responsible for the transmission of cassava brown streak viruses (CBSVs) (Maruthi et al., 2004). Several B. tabaci haplotypes forming distinct sub-Saharan clades have been shown to transmit CBVs in southern and eastern Africa (Berry et al., 2004; Esterhuizen et al., 2012; Sseruwagi et al., 2004). Whiteflies feed on phloem sap in all growth stages of the plant (Thresh, 1998). Whiteflies can be extensively spread in tropical regions with immigration of close to 7 km downwind (Hirano et al., 1993).
4
Figure 1. 2 Map showing Geographical distribution of cassava-infecting begomoviruses together with all the species and strains of cassava mosaic begomoviruses (CB8Vs) in Africa as well as the Indian subcontinent. The green coloured regions indicate areas under cassava cultivation and different coloured dots represent specific specie (Patil and Fauquet, 2009).
5 Figure 1. 3 The whitefly Bemisia tabaci (Gennadius) (Cuthbertson, 2013)
Cassava mosaic disease symptoms vary between varieties, cultivars and landraces, due to a number of factors such as plant age, temperature and differences in viral strains. Generally, CMD causes chlorotic mosaic on infected leaves. The mosaics are either yellow or green regions on the leaves. Green mosaics usually appear as alternating light and dark green regions on the leaf (Legg et al., 2004). Green mosaics are usually mild or moderate. The more severe mosaics appear as yellow and green regions. Yellow regions show areas where the leaves have lost photosynthetic ability this in turn results in reduction of leaf size and plant stunted growth (Vanitharani et al., 2005). ACMV and SACMV symptoms of leaf curling, twisting/malformation and blistering are often also observed (Legg et al., 2004; Vanitharani et al., 2005). Some of the symptoms are shown in fig 1.4. Infection with CMD greatly reduces yield and tuber size. In severe cases leaves may be distorted, this is because the chlorotic regions seize to grow whilst other surrounding regions grow causing uneven leaf expansions (Thresh et al., 1998).
1.4 Geminiviruses
Geminiviruses belong to the family Geminiviridae (Brown et al., 2015). Geminiviruses affect a range of dicots and monocots causing diseases and deformities. Geminiviruses are characterised by a geminate icosahedral structure, and their genome consist of a single stranded circular DNA (Gutierez, 2000). They replicate by a unique form called rolling circle mechanism in the host cell nucleus, where they rely on host cell replication mechanism (Stanley, 1995; Wang et al., 2008). The geminiviridae family is further divided into 7 genera based on genome organisation. The seven generas of geminiviruses are Begomovirus,
6
Mastrevirus, Curtovirus, Topocuvirus, Becurtovirus, Turncurtovirus and Eragrovirus
(Adams et al., 2013). Of these seven begomoviruses, mastreviruses, curtoviruses, topocuviruses have been extensively studied. Begomoviruses make up 80% of geminivirus species (Brown et al., 2015).
Figure 1 4 Symptoms of CMD: A green leaf mosaic B, yellow leaf mosaic, C severe leaf deformation (Vanitharani et al., 2005)
1.4.1 Begomoviruses
Begomoviruses exist as either mono-or bipartite viruses. Their genome sizes range from 2.5 to 5 kb and usually consist of 6 to 7 genes (Brown et al., 2015; Raja et al., 2010). Begomoviruses usually have 2 genetic components called DNA-A and DNA-B. DNA-A has six open reading frame coding for four complementary sense genes, namely AC1 to AC4 and two virion sense genes AV1 and AV2 (Brown et al., 2012; Vanitharani et al, 2005) (fig 1.5). AC1 codes for the Rep protein 358 aa in length, and is essential for initiation of replication. AC2 codes for a 135 aa protein (TrAP) which is essential for transcriptional activation, while AC3 codes for REn a 134 aa protein essential for replication enhancement. AC4 is reported in some geminiviruses as a suppressor of RNA silencing (Vanitharani et al., 2004). AV1 codes for a coat protein of 258 aa and AV2 encodes a pre-coat protein (Vanitharani et al., 2005; Wang et al., 2014). AV2 is also known to be a virus suppressor of silencing (VSR) and contribute to symptom severity (Vanitharani et al., 2004).
DNA-B has 2 open reading frames coding for a complementary sense gene (BC1) and a virion sense (BV1) gene. BV1 encodes a nuclear shuttle protein (NSP) and BC1 encodes a
7 cell-to-cell movement protein (MP) (Varma and Malathi, 2003). Geminivirus DNA is replicated in the nucleus so NSPs transport the DNA complex to the cytoplasm where MP is responsible for transportation from one cell to the other. Synonymous to both DNA-A and DNA-B is a 200bp common region within the intergenic region (IR) (Brown et al., 2015). In begomoviruse transcription occurs bi-directionally from the IR (Ashraf et al., 2014; Eagle and Harnley-Bowdoin, 1997; Stanley, 1995). Opposite oriented promoters exist on either side of the origin of replication site. The common region also contains a small hairpin structure which acts as the initiation site of the rolling circle replication (reviewed by Rizvi et al., 2014). The common region also consists of 2 TATA motifs and a Rep-associated protein binding sites called iterons (Ashraf et al., 2014;Varma and Malathi, 2003).
Figure 1. 5 Bipartite genome of begomoviruses showing their respective open reading frames (Palmer and Rybicki, 1997)
1.5 Plants response to viral infection
Plants offer resistance to viruses using various mechanisms. Once a virus has infected a plant, plants are able to counteract the infectivity. Plant resistance to viruses has been described to occur at four different levels by various mechanisms and these are inhibition of replication, inhibition of cell-to-cell movement, inhibition of systemic infection as well as defence response mechanisms (Reviwed by Palukaitis and Carr, 2008). The first line of defence for plants to viral infection is physical and chemical barriers. The second barrier of defence is the plants recognition of virus virulence factors. Once these virulence factors have been recognised the defence response would include the involvement of basal immunity or RNA
8 silencing (Pallas and Garcia, 2011). Despite these defence mechanisms viruses may overcome them by producing silencing suppressors (Pallas and Garcia, 2011).
1.6 RNA silencing
RNA silencing is a gene regulatory mechanism resulting in sequence specific mRNA degradation (Balcombe, 1999; Vantharani et al., 2005). RNA silencing involves two classes of short RNAs, namely small interfering RNAs (siRNA) and microRNAs (miRNA), 21 to 26 nucleotide (nt) in size, which are involved in the regulation of gene expression, regulation of chromatic structure and defence mechanisms against transposons and viruses in eukaryotic organisms (Baulcombe, 1999, 2004; Cerutti et al., 2011; Holoch and Moazed, 2015). The same mechanism occurs in fungi and animals where it is called quelling and RNA interference, respectively (Cogoni et al., 1997; Napoli et al., 1990). Plants main natural defence mechanism against viruses is by RNA silencing. This mechanism of RNA silencing in plants occurs as post transcriptional gene silencing (PTGS) or transcriptional gene silencing (TGS).
1.6.1 Post transcriptional gene silencing
PTGS occurs by cytoplasmic siRNA or miRNA silencing of endogenous mRNA (Baulcombe, 1999, 2004; Hammond et al., 2000). TGS downregulates gene expressions through siRNA guided methylation of gene promoters or histones resulting in inhibition of transcription. PTGS and TGS have similar mechanisms and both rely on initiation by recognition of double-stranded RNA (dsRNA) from within or outside the cell and their subsequent cleavage by Ribonuclease III like enzymes called Dicers into small nucleotides with size ranging from 21-26 nucleotides (Bernstein et al., 2001). Small interfering RNAs are divided into two classes, short class 21-22 nucleotides and longer class 24-26 nucleotides (Hamilton et al., 2002). These act as guides in sequence specific degradation of homologous target RNA for gene regulation or viral degradation (Hammond et al., 2000; Raja et al., 2010). Dicer structure has been reported to have a 10-residual segment consisting of an enzyme site that directly aligns with the dsRNA sequence (MacRae et al., 2007). Different Dicer-like enzymes (DCL) have been distinguished based on their different functions, DCL 1 is involved in miRNA biogenesis, DCL2 is involved in viral siRNA production and DCL 3 is involved in retroelements and transposon siRNA production (Garcia-Ruiz et al., 2010; Parent
et al., 2015; Xie et al., 2004). Unlike most viruses which have an RNA genome, geminiviruses have a single stranded DNA (ssDNA) genome. RNA silencing is triggered in
9 viruses with RNA genomes by dsRNA that exist as either viral replication intermediates or folding secondary structures by ssRNA or ssRNA-encoded mRNA (Vanitharani et al., 2005). Geminiviruses are circular single-stranded DNA and replicate through a dsDNA intermediate, and trigger PTGS. Double stranded viral genome induces PTGS in several ways. Firstly, the mRNA of the geminivirus which are a product of bi-directional transcription and overlap at the 3’end forming dsRNA by 3’ extension by RNA dependent RNA polymerase (RDRP) 1 or 6 which triggers PTGS. Secondly, early abarrent AC1 transcripts could also serve as templates for dsRNA formation leading to PTGS and lastly the strong tendency of geminiviruses transcripts to fold can easily attract Dicer to cleave the transcripts giving siRNA (Garcia-Luiz et al., 2010; Vanitharani et al., 2005; Wang et al., 2010). Duplex siRNA generated by Dicer act as effectors of the silencing mechanism (Brodersen and Voinnet, 2006). The siRNA duplexes are unwound by helicase activity into two separate strands and either the sense or antisense strand can be loaded into an effector complex called RNA induced silencing complex (RISC), consisting of Agonaute proteins (reviewed in Sherman et al., 2015; Vasquez and Hohn, 2013; Voinnet et al., 2009). The Agonaute proteins have dicing properties and it guides the siRNA to homologous mRNA where it binds to specific homologous sequences (21-26 nt). The specific mRNA is then subjected to enzymatic cleavage and subsequent degradation (reviewed in Vaucherets, 2008). Short class siRNAs (21-23 nt) are involved in mRNA degradation whilst longer siRNAs (24 nt) have been implicated in DNA methylation (Hamilton et al., 2002). The overview of the RNAi pathway is shown in (fig 1.6).
10 Figure 1. 6 Overview of steps involved in RNAi pathway involving (1, 2) processing of dsRNA intermediates by Dicer into primary siRNA production. (3, 4) siRNA unwinding and incorporation into RISC complex (5) sequence-specific degradation of complementary mRNA (Sherman et al., 2015)
1.6.2 Transcriptional gene silencing
Down regulation of transposons, chromosomes as well as protein coding gene is called transcriptional gene silencing (TGS) (Nishumura et al., 2012). TGS occurs by three methods (i) DNA methylation (ii) heterochromatic formation and (iii) programmed DNA elimination (Shah et al., 2012; Vaucherets et al., 2001). Heterochromatic formation occurs when changes are induced on the chromatin by deacetylation of Histone H3 and methylation at the lycin 9 of the chromatin (Shah et al., 2012). The methylated lycin is then bound by heterochromatic binding proteins which cause chromatic condensation and subsequent blocking of transcription (Shah et al., 2012). DNA methylation involves the addition of a methyl group to DNA base cytosine by DNA methyltransferase. Methyl binding proteins bind to the transcriptional factor binding site on the promoter and this inevitably stops transcription.
11 RNA dependent-DNA methylation involves the methylation of DNA regions homologous to dsRNA sequence (Vaucherets et al., 2001). RNA dependent-DNA methylation is initiated by dsRNA derived from transgene or subsequent siRNAs from that transgene. The siRNAs are then incorporated into the RNA induced initiation of transcriptional gene silencing (RITS). The RITS/siRNAs complex then directs methylation of target DNA that is homologous to the siRNAs (Wu et al., 2010; Xie et al., 2004). Plants infected by geminiviruses such as Tomato yellow leaf curl Sardinia virus (TYLCSV) and Cabbage Leaf curl virus (CaLCuv) have been shown to trigger TGS by hypermethylation or chromatic methylation of the virus (Paprotka et al., 2011; Raja et al., 2008). Transgenic plants with geminivirus promoter transgene have been shown to induce hypermethylation thereby reducing accumulation of infecting geminiviruses (Reviewed in Rodriguez-Negrete et al., 2013).
1.6.3 Role of miRNAs in silencing
Lee et al. (1993) reported Caenorhabditis elegans lin-4 gene produced small RNA instead of coding for a protein. These small RNAs were termed micro RNA (miRNA). Micro RNAs are small endogenous non coding RNAs found in plant animals and viruses. These 21-22 nucleotide are produced from ~70 nucleotide long endogenous precursors called pri-miRNA (Bartel and Bartel, 2003; Voinnet, 2009). DCL1 then processes the pri-miRNA into 21-22 nucleotide miRNA. In plants Dicer DCL1 has been implicated in miRNA precursor processing. Silencing by miRNA can occur in 2 pathways (i) the 3’UTR of the mRNA can base pair with miRNA/RISC complex and inhibit transcription (ii) they can degrade mRNA by sequence specific binding (Finnegan and Matzke, 2003). The complementarities of the miRNA to the target mRNA determines which silencing pathway is taken. In animals translation repression usually occur due to the imperfect base pairing between the miRNA and the target mRNA whilst mRNA degradation occurs in plants due to their high complementarity to target mRNA (Llave et al., 2002; Tang et al., 2003).
Unlike siRNA, miRNA are not only involved in gene expression regulation but are also response to virus infection. Host miRNA bra-miR158 and bra-miR1885 were upregulated when host Brassica rapa was infected with Turnip mosaic virus (TuMV) (He et al., 2008). Recently EACMV viral miRNA encoded from AC2 and AC4 ORFs targeting the host and itself were identified (Maghuly et al., 2014). The identification of premiRNA encoded from the viral ORF could be used to engineer plants against the virus.
12
1.7 Viral RNA silencing suppressors
To counteract plants’ viral RNA silencing mechanisms PTGS and TGS, viruses have developed suppressor proteins. The level of suppression exerted by different viruses varies, where some viruses suppress in all infected tissues of the leaves whilst some exert suppression in newly formed leaves (Voinnet et al., 1999). Viral suppressors of RNA (VSRs) are capable of stopping the silencing mechanism and generation of siRNA targeting the virus (vsiRNAs) at its most important stages such as RISC assembly, dsRNA recognition and translational inhibition (Burgya and Havelda, 2011). Brigneti et al. (1998) showed that
Cucumber mosaic virus (CMV) produced a protein 2b which suppresses PTGS in Nicotiana benthamiana. The model of suppression by the protein has since been implicated in disrupting silencing signal and disruption of the production secondary vsiRNAs (fig 1.7) (Diaz-Pandon et al., 2007; Guo and Ding, 2002). Since then several proteins have been shown to suppress silencing. Cauliflower mosaic virus (CaMV) P6 protein was shown to disrupt dsRNA-binding protein (Hass et al., 2008; Love et al., 2007). P14 and P38 proteins from Pothos latent auresvirus and Turnip crinkle virus have been proven to disrupt production of siRNAs (Merai et al., 2005, 2006). Double stranded siRNAs produced against the virus are also a target of VSR. The p19 protein from plant Tombusviruses have been proven by crystallography studies to attach with high degree of affinity to double stranded siRNAs thereby preventing siRNA/RISC complex formation (Silhavy et al., 2002).
13 Figure 1. 7 Model of antiviral RNA silencing mechanism in plants and its suppression by virus-encoded silencing suppressors. The model shows the various target area on the silencing mechanism were certain VSRs (i.e. P14, P38, 2b, P6, P21, P0) interact with the silencing pathways (Burgyan and Havelda, 2011)
1.7.1 Cassava infecting geminiviruses as silencing suppressors
Voinnet et al. (1999a) reported that ACMV AC2 open reading frame acted as a PTGS suppressor. Nicotiana benthamiana was transformed with a strain of Agrobacterium tumefaciens expressing a green fluorescent protein (GFP) transgene inserted into its Ti plasmid. A few days after transformation the N. benthamiana leaves, which had shown green fluorescence, showed red illumination because of PTGS. N. benthamiana was then transformed again with an AC2-PVX expression vector, and days after post infiltration N. benthamiana leaves showed green flourescence leading to the conclusion that GFP’s PTGS was being suppressed upon infection of N. benthamiana with the ACMV AC2 gene construct. The result showed that AC2 was a suppressor of PTGS.
Vanitharani et al. (2004) also reported using the similar GFP transgene method that the AC4 gene which lies in the Rep encoding region of ACMV was a suppressor of PTGS. Like previously done by Voinnet et al. (1999), N. benthamiana with a GFP trangene showed PTGS suppression when infected with an Agrobacterium tumefaciens baring an AC4 construct. Vanitharani et al. (2004) also showed that the silencing ability of AC4 was virus
14 specific. AC4 obtained from ACMV-[CM] showed no suppression activity whilst AC4 from ACMV and SLCMV both showed PTGS suppression.
1.8 Manipulation of RNA silencing mechanisms to combat plant diseases
Advances in plant biotechnology and understanding of silencing mechanisms in the late 1990 lead to the development of molecular tools for possible introduction of foreign genes. Introduction of foreign genes into plants is termed genetic engineering (GE). Using the siRNA-mediated RNA silencing molecular mechanisms, introduction of a transgene consisting of a partial fragment from the pathogen genome results in production of trangene-derived siRNAs which aid the plants natural defence mechanism PTGS subsequently leading to resistance. This mechanism of introducing pathogen genes in plants is called pathogen derived resistance (PDR) (Peele et al., 2001).
1.8.1 Pathogen Derived Resistance (PDR)
PDR was first suggested by Sanford and Johnson (1985). Two methods are popular for pathogen derived resistance; the use of a viral gene coding for a protein which offers (protein-mediated resistance) and the use of viral genomic sequences which offer resistance (Peele et al., 2001). Powell-Abel et al. (1986) first demonstrated the use of Tobacco mosaic virus (TMV) coat protein gene for transgenic protein-mediated resistance. Their finding showed that transgenic tobacco with TMV coat protein genes offered resistance to TMV. Since then several viral proteins including movement proteins and replication-associated proteins have been used to induce resistance (Canto et al., 1998; Challappan et al., 2004; Sjen
et al., 1996). At first it was believed that expression of the complete viral protein was necessary for silencing to occur but it has since been shown that the transcribed viral sense or antisense only can induce resistance (Fagoaga et al., 2006; Harrison et al., 1987). It became clear that silencing was being brought about by the transgenic-expressed RNA rather than the protein itself as expression of mutated proteins work too.
1.8.2 RNA silencing constructs
The use of sense or antisense transgenes was extensively studied in the early 1990s to compare their efficacy in inducing viral resistance (Fire et al., 1991; Smith et al., 1990; Takayami et al., 1990). Antisense RNA-mediated resistance uses an antisense strand which is specific to a viral sense strand, and complimentary binding of the expressed transgene antisense strand and the viral sense strand results in dsRNA which can be degraded via PTGS. The resulting siRNAs can then act as guide to degradation of homologous infecting
15 viral molecules. Smith et al. (1990) experimented with transforming tomato with
polygalactoronase (PG) gene with either sense or antisense strand. Both methods resulted in reduction in expression of PG protein. However, the use of sense or antisense transgene has been reported to be unstable due to the low accumulation of siRNAs (Duan et al., 2000). Waterhouse et al. 1999 reported that simultaneous expression of a trangene with antisense and sense viral sequence in a plant induces more efficient virus silencing than antisense or sense alone. They reported that N. benthamiana plants transformed with a transgene expressing both arms of the Nia-Protease (Pro) gene of potato virus Y (PVY) had higher resistance compared with transgenes expressing either the sense or antisense polarity. The ability of the transgene to transcribe a RNA that can form a duplex/inverted repeat or hairpin meant it was more plausible for gene degradation to occur at a higher degree. Complete resistance could not be reached because the homologous nature of the sense and antisense strands meant secondary structures in the form of cruciform or Holliday junction like structures could easily form (Eichman et al., 2000; Holliday et al., 1985).
To circumvent the formation of secondary structures, intron sequences were introduced between the sense and antisense sequence to form inverted repeat (IR) constructs (Smith et al., 2000). Due to the ability of the intron to align the sense and antisense arm in perfect complementarity these IR constructs have been reported to confer higher levels of resistance to viruses (Smith et al., 2000; Wesley et al., 2001). Using this model several generic vectors for IR/Hairpin constructs have been made. Helliwell and Waterhouse (2003) made pHANNIBAL, pKANNIBAL and pHELLSGATE generic vectors. These generic vectors require the insertion of de novo amplified arm of the transgene with suitable flanking sites, into the vectors by using the Gateway directed recombination.


![Figure 2. 8 Symptom severity score of CMM6 and AMM2 transgenic lines, infected untransformed cv.60444 and infected ACMV-[NG:Ogo:90] resistant transgenic line dsAC1 agro-inoculated with infectious ACMV-[NG:Ogo:90] clones](https://thumb-us.123doks.com/thumbv2/123dok_us/10203749.2923360/70.892.113.786.370.797/symptom-severity-transgenic-untransformed-resistant-transgenic-inoculated-infectious.webp)
![Figure 2. 9 Viral load of CMM6 and AMM2 transgenic lines, infected untransformed cv.60444 and infected ACMV-[NG:Ogo:90] resistant transgenic line dsAC1 agroinoculated with infectious ACMV-[NG:Ogo:90] clones](https://thumb-us.123doks.com/thumbv2/123dok_us/10203749.2923360/72.892.122.777.252.655/transgenic-infected-untransformed-infected-resistant-transgenic-agroinoculated-infectious.webp)
![Figure 2. 12 Pictorial representation of the tuber exhibiting the highest yield from each of the CMM6 trangenic lines 2, 3, 5, 6 and 7, infected untransformed cv.60444, non-infected healthy cv.60444 and infected ACMV-[NG:Ogo:90] resistant tra](https://thumb-us.123doks.com/thumbv2/123dok_us/10203749.2923360/76.892.112.777.726.998/pictorial-representation-exhibiting-trangenic-infected-untransformed-infected-resistant.webp)
