UNCECOMP 2017 2nd ECCOMAS Thematic Conference on Uncertainty Quantification in Computational Sciences and Engineering M. Papadrakakis, V. Papadopoulos, G. Stefanou (eds.) Rhodes Island, Greece, 15–17 June 2017
VULNERABILITY OF HYDROPOWER INSTALLATIONS TO
CLIMATE CHANGE: PRELIMINARY STUDY
Silvia Tolo1, Edoardo Patelli1, and Diyi Chen2 1Institute for Risk and Uncertainty
University of Liverpool, UK
e-mail:{s.tolo, edoardo.patelli}@liverpool.ac.uk
2College of Water Resources and Architectural Engineering
Northwest A&F University, CH e-mail: [email protected]
Keywords: Hydropower, Imprecise Probabilisties, Bayesian Networks, Credal Networks, Cli-mate Change
Abstract. The climate trends observed worldwide over the past few decades appear to corrob-orate the concerns of the scientific community about the many threats posed by global warm-ing. Future changes of the current climate are expected to occur on different scales all around the globe, hence modifying the environmental background on the basis of which technological installations have been designed and operated. This can potentially threat the safety of the in-stallations as well as their. The development of suitable tools aiming to predict the impact of climate change on technological installations is then essential in the wider context of climate change mitigation.
Hydropower installations play often a crucial role not only as a long-term renewable resource of energy but also for flood control and water supply in the case of droughts. All these aspects highlight the increasing importance of such installations as well as their growing vulnerability to natural hazards. It is hence essential to enlarge the current understanding of the interaction mechanisms between such installations and the changing surrounding environment in order to take adequate measures for climate change adaptation and ensure the future safety and produc-tivity of hydropower production.
The current study aims to provide a novel model for the evaluation of the impact of climate change on the safety of hydropower stations. The approach adopted allows to include in the model the uncertainty inevitably associated with the input variables and to propagate such un-certainty within the analysis. The model proposed is finally applied to a realistic case-study in order to highlight its potential and limitations.
©2017The Authors. Published by Eccomas Proceedia.
1 INTRODUCTION
Hydropower is currently the most common source of renewable energy, accounting for about 20% of global electricity production and for over 50% of the electricity generation of one third of all countries worldwide [8]. The large success of water resources for the electricity produc-tion, which has been often accompanied by the rapid growth of developing countries such as Brazil and China (today among the six biggest producers worldwide), has several reasons. First of all, it is a long-term renewable resource able to provide predictable and non-polluting en-ergy. Secondly, hydropower systems such as dams and reservoirs can assist in flood control or, by the same token, provide water supply in the case of droughts [7]. Moreover, the conversion efficiency of hydroelectric generation can reach values over 90% (with peaks of 95% for large installations), greatly larger than fossil-fuelled production whose efficiency is generally around 30-40%. Finally the low operating and maintenance cost of hydropower and the long projected life span (up to 70 years) make this technology attractive and extremely cost-effective. On the other hand, these same strengths (e.g. the use of natural resources, the flood prevention purpose, the long operational life) make hydropower potentially sensitive to climate change, threatening the efficiency and safety of installations [4]. Indeed, the threat of climate change of worsening the occurrence of extreme weather events, both in terms of intensity and frequency, as well as the rise of temperatures are expected to have a significant impact on the water resources world-wide, affecting negatively the performance of hydroelectric systems as well as subjecting them to new and unquantified risks. Despite the importance of hydropower production and the further hazards introduced by climatic change, relatively few studies have addressed these issues and no methodology for the analysis of such impact has ever reached a general consensus [16]. The main aim of the current work is to implement a probabilistic framework for the evaluation of the impact of extreme weather events on hydroelectric systems, focusing on the scale of a single station. The climate variables are included in the analysis in light of future projections, allowing to carry the analysis with regards to future possible scenarios and trends. At this phase, the study is limited to the analysis of the impact of future precipitation trends, while other vari-ables, such as temperature rise or occurrence of droughts are currently behind the purpose of the implementation.
In the following sections, the theoretical background of the methodology used is presented to-gether with a brief overview of the computational tools adopted for the implementation. The proposed model, and its application to a simple case-study, are then described in Section 3. 2 Methodology and computational tools
The methodology selected for the implementation of such a model consists of the general-ization of the so called Enhanced Bayesian Networks approach [17]. This latter is based on the integration of the well-known Bayesian Networks (BNs) with structural reliability meth-ods (SRMs). Similarly, the methodology adopted integrates the use of Credal Networks (CNs), which can be regarded as a generalization of BNs able to include imprecise probabilities in the framework, with cutting-edge and robust SRMs. The choice of this particular methodology is justified by its large potential in the representation of the interaction between weather events and technological installations, as proved in former studies [19][20]. Indeed the approach allows to embody the aleatory character of natural events as well as the epistemic uncertainty associated (in particular in the case of climate projections), through the use of probabilistic models, in-tervals or imprecise random variables. Also, the uncertainty affecting the output (as well as discrete probabilities) is quantified and expressed in terms of probability bounds. These latter
are a crucial information for decision-makers or more generally analysts using the model: not only they express a measure of the meaningfulness of the results computed but also highlight the degree of ignorance which characterizes the estimation. Conversely, to exclude uncertainties from the analysis would lead to an unsound approach and unreliable results. Finally, a further advantage of the methodology is the use of external and existent numerical and physical models which can be easily integrated in the overall framework without affecting the congruence of the model. In the following sections, the basics of such methodology are briefly introduced. 2.1 Credal and Bayesian Networks
Credal Networks are a generalization of the well known Bayesian Networks. These latter present a graphical structure which consists of nodes and directed edges. Each node represents a variable of the model while the directed edges connecting the nodes capture the relationship (generally of a causal nature) existent between the variables. Commonly, the network structure is referred to employing a family metaphor: a nodeX2 is said to be achildof a nodeX1 if the
edge connecting the two is originated inX2 and points towardX1; in this case,X2 is also said
to be aparent of X1. Nodes without parents are said to be rootsof the network, while nodes
without children and not receiving any evidence are referred to asbarren nodes.
These considerations regarding the structure of BNs are valid also for CNs, which present the same graphical framework. Indeed, the difference between CNs and BNs does not concern the graphical nature of the approach but its numerical aspect. The main aim of both BNs and CNs is to factorize the joint probability of complex events exploiting the information available regard-ing the sregard-ingle variables of the problem under study and their mutual relationships. Moreover, the most attractive aspect of this methodology is the capability of updating the belief regarding the event of interest when more information is available about other variables of the network. Hence, once selected the event of interest, its probability can be computed taking into account the knowledge available regarding the remaining variables of the model. Such knowledge is referred to asevidenceand the overall process is known asbelief updating. This task can be ful-filled through the use of inference algorithms, which can be of an analytical (i.e. exact inference algorithms) or approximate (i.e. approximate inference algorithms) nature. For both BNs and CNs, the input of such algorithms are, beyond the structure of the network, the conditional prob-ability distributions (CPDs) that are associated with each node and quantify the strength of the relationships existent between the node itself and its parents (not having any parent, root nodes are associated with marginal probability distributions). In BNs such conditional probabilities are either crisp values (in this case the CPDs are referred to as CPTs, i.e. conditional proba-bility tables) or continuous probabilistic distributions. In CNs the requirements regarding the nature of the input parameters are relaxed and embrace also imprecise probabilities and hence probability values known only with a certain degree of uncertainty (i.e. interval probabilities). This type of representation enhanced significantly the robustness and accuracy of the approach since allows to capture the uncertainty in input and to propagate it within the model avoiding the introduction of biases and assumptions not fully justified by the available data. Moreover, computing the uncertainty of the output, CNs provide a numerical context for the answer of the model which allows analysts to make decision acknowledging the significance and accuracy of the information obtained. On the other hand, the adoption of input parameters such as contin-uous distributions or imprecise probabilities increases the computational effort associated with the inference computation and can limit the availability of suitable algorithms. In many cases, in particular for CNs or more generally when continuous probabilistic distribution are involved, it is necessary to adopt approximate inference algorithms in order to deal with the complexity
of the model at the cost of a lower (or even unknown) degree of accuracy. 2.2 CNs reduction with SRMs
Several numerical strategies and algorithms have been suggested in the scientific literature in order to overcome the limitations associated with the inference computation over CNs. The approach adopted in the current study aims to preserve the flexibility and accuracy of such methodology at the lowest computational cost. This is obtained integrating the CN framework with numerical methods imported from the field of structural reliability and involved in the reduction of the initial model. The main idea is to allow the initial network to embrace a large variety of mathematical frameworks for the representation of the data in input, such as crisp probability values, probability bounds, continuous probabilistic distributions, intervals and imprecise probabilistic distributions (i.e. continuous distributions whose parameters are known with some uncertainty and hence represented as intervals). Such initial model is then subject to a reduction procedure that results in an equivalent network containing only discrete nodes associated with either crisp or interval probability values and on which inference is finally computed. Hence, the reduction procedure consists of eliminating all the non-discrete nodes present in the initial model. The initial assumption at the basis of such procedure is that every node child of at least one non-discrete node must be defined as a domain in the outcome space of its continuous parents: when such condition is verified the elimination of the mentioned nodes can be obtained by integration. In other words, the elimination of a non-discrete node implies the reconstruction of its children’s CPDs in which the result of the integration is stored. This ensure the preservation of the information associated with the initial network that is not lost but simply reformulated and stored in the nodes of the final model.
The efficiency of the reduction procedure is obtained through the adoption of robust numerical methods commonly used in the field of structural reliability.
2.3 Computational Tool
The algorithms related to the methodology outlined in the former section have been im-plemented computationally in the general purpose software OpenCossan [15][6], obtaining a complete tool for the reduction and analysis of CNs. The toolbox provides the graphical and numerical implementation of the models as well as the reduction of EBNs to traditional BNs. The software allows four main types of nodes: discrete, probabilistic, bounded and hybrid. On the basis of the variables involved and the level of accuracy required, several options are available for the structural reliability methods to be adopted. In more detail, traditional and advanced Monte Carlo methods (such as Line Sampling, Subset Simulations) are suitable when no interval or hybrid nodes are involved in the computation. Conversely, the most generalized approach available consists of the adoption of Advanced Line Sampling which can compute all the possible combination of variables kinds in input [2]. Different options are also available for performing the inference computation on the reduced network. Such algorithms, both built-in or from third parties [12], are characterized by different degrees of accuracy and different com-putational costs. The toolbox integrates also methods for the sensitivity analysis of the models, allowing to identify the best possible strategy to effectively tune single network parameters in order to obtain the required level of imprecision in output.
TimeScenario EmissionScenario ProjectedRainfall PrecipitationTrend WindTrend ProjectedWindSpeed WindFetch ExternalPowerGrid BackupDiesel TurbineOperationalState OnSitePower PowerSupplies ControlSystem1 ControlSystem2 ControlSystem3 Machinery1 Machinery2 Machinery3 LiftingMechanism1 LiftingMechanism2 LiftingMechanism3
Gate1 Gate2 Gate3
SpillwayState SpillwayFlow UnitTransformer DamHeight DamSlope EmbankmentRoughness ReservoirSurface InitialLevel TurbineRelease ReservoirInFlow DamOvertopping OtherFailure LoadRejection InitialLoadDegreeCoefficient WicketGateClosureTime PipeLength PipeDiameter PipeThickness ValveClosureTime ValveVelocityCoefficient YieldingStrength PermanentLoad PenstockStructuralDamage MaintainanceOutage
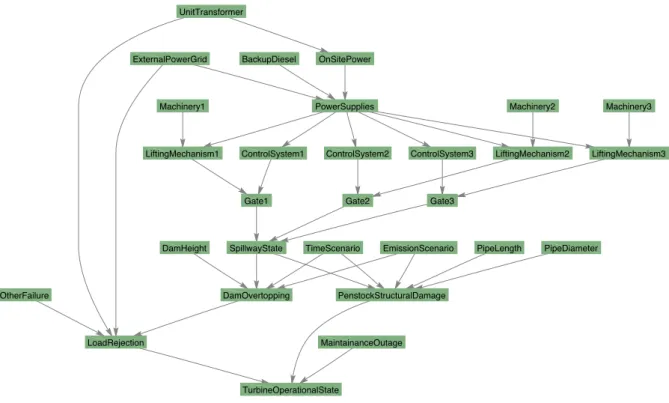
Figure 1: Overview of the proposed model
3 Proposed Model
The model proposed refers to the vulnerability analysis of an impoundment facility and takes into account the structural safety of the dam as well as of the systems dedicated to the power generation. The network, shown in Fig.3, has been applied to a simple case-study, whose imple-mentation and anaysis is described in the following section. The case-study refers to a facility located in the north-western region of China and considers a single turbine unit. The data adopted where partly collected from a real installation of compatible size and location (such as for the reservoir, dam and penstock structural parameters as well as for the water levels, in-flow, comsumption, rainfall records etc). In the case of missing information (e.g. the unit transformer failure rate), realistic data have been adopted on the basis of the existing literature and represented through suitable mathematical frameworks able to account for the uncertainty of the information. The network provides the modelling of the reservoir in order to evaluate the probaility of overtopping of the dam, as described in Section 3.2 under the different climate scenarios described in Section 3.1. The overtopping of the dam is assumed to potentially re-sult in the load rejection, which can also be caused by the failure of the external power grid, on-site trasformer malfunction, human action or mechanical accidents in turbine units [21]. The section of the network modelling these failure mechanisms (Section 3.3) considers also the eventual occurrence of water hammer in the penstock of the station due to load rejection. 3.1 Climate Scenarios
Two time scenarios, one related to the period 2021-2050 the other to 2071-2100, have been analyzed. Similarly, different assumptions have been considered regarding future trends for the emission of greenhouse gases: the first (SRES B1 according to the IPCC nomenclature [13]) considers the combination of a rapid economic growth with the introduction of clean and ef-ficient technologies, able to ensure social and environmental stability; conversely, the second scenario (SRES A2) assumes a less ecologically-friendly and more divided world, resulting in a regionally oriented economic development and a significant increase of the greenhouse
emis-sions. The combination of the possible states of the nodesTimeScenarioandEmissionScenario
defines the overall scenario of reference, on the basis of which future trends for climate vari-ables such as wind (WindTrendnode) and precipitations (PrecipitationTrendnode) are selected. These predictions are then combined with baseline probabilistic distributions for the relative variables obtaining the projected distribution of the wind (ProjectedWind) and rainfall ( Project-edRainfall) for all different scenarios. Due to the uncertainty unavoidably associated with future projections, the nodesProjectedRainfall and ProjectedWindSpeedare described by imprecise random variables. Climate data projections for the north-western region of China have been deduced from the available literature [5] as well as the baseline for the wind speed distribution [1]. Conversely, the probability distribution of rainfall has been defined on the basis of the data collected close to the station of reference.
3.2 Dam Structural Safety
The overtopping of the dam occurs when the maximum level of the water in the reservoir overcomes the height of the dam. In order to compute the vulnerability of the dam to such mechanim, a structural reliability problem was defined[14]. According to the model adopted for such purpose, the overtopping mechanism can be triggered by the combination of several factors, such as the reservoir level (which can be influenced by precipitations) and the correct operation of the spillways. Moreover, the effect of waves originated in the reservoir by the wind is considered, assuming the wind to be uniform and costant over the fetch. Due to the lack of data the value of the fetch length has been assumed to be an interval (WindFetchnode) whose bounds have been calculated on the basis of a simplified shape of the reservoir. Sim-ilarly, the dam slope has been assumed to be smooth (EmbankmentRoughness) and have an inclination (DamSlope) in the interval [0.78, 1.05] rad. On the contrary, the amount of water in-flow (ReservoirInFlow), the initial level of the reservoir (InitialLevel), the spillways flow (SpillwayFlow) and the water flow to the turbine (TurbineRelease) are described by probabilis-tic nodes designed on the basis of the real data available for the station of reference.
The dam modelled has three spillways: the correct operation of these (SpillwayState) depends on the correct functioning of the gates associated to each spillways (Gate1, Gate2, Gate3). Each of these is assumed operational only if the associated control system (ControlSystem1,
ControlSystem2,ControlSystem3) and lifting mechanism (LiftingMechanism1, LiftingMecha-nism2,LiftingMechanism3) are available. The failure rate for the control systems has been de-duced from previous literature as for the lifting mechanisms, whose unavailability is considered in terms of failure of the related machinery [10]. Moreover, the operation of the control system is bound to the availability of electrical power produced on-site (OnSitePower) or avaiable ei-ther from the external grid (ExternalPowerGrid) or backup diesels (BackupDiesel). The failure rates for the nodesExternalPowerGrid and BackupDiesel have been deduced from the litera-ture, adopting probability bounds in order to integrate multiple sources and possible set-up of the systems [3][11]. Similarly, the production ofOnSitePoweris associated with the availabil-ity of the on-site transformer and hence to the nodeUnitTransformerfor which the probability bounds have been also deduced from former studies [18]. Clearly, the production of power on-site depends also on the availability of the turbine unit (TurbineOperationalState) but, as it is possible to see in Fig. 3, the two events have not been considered directly dependent. In-deed, the link between the nodesTurbineOperationalStateandPowerSupplieswould originate a cycle within the graph, contraddicting the basic rules of BNs (and CNs) that rely on the use of acyclic directed graph. Graph theory offers possible solutions for this kind of issues, such as arc inversion, but in the current phase of the study these strategies have not been implemented.
TimeScenario EmissionScenario ExternalPowerGrid BackupDiesel
TurbineOperationalState OnSitePower
PowerSupplies
ControlSystem1 ControlSystem2 ControlSystem3
Machinery1 Machinery2 Machinery3
LiftingMechanism1 LiftingMechanism2 LiftingMechanism3
Gate1 Gate2 Gate3
SpillwayState UnitTransformer DamHeight DamOvertopping OtherFailure LoadRejection PipeLength PipeDiameter PenstockStructuralDamage MaintainanceOutage
Figure 2: Overview of the reduced network
3.3 Penstock Structural Reliability and Turbine Operation
Rapid load rejection, can cause the occurrence of pressure waves within the pipelines of the facility. This phenomenon, generally known as water hammer, threatens the structural safety of the station penstock and can trigger more critical accident scenarios jeopardizing the safety of the entire facility. In order to take into account the occurrence of the water hammer in the model, a stochastic approach was adopted on the basis of former studies [21]. Structural damages are assumed to occur when the combination loads acting on the penstock results higher than the yielding strength of the pipe material. In the case-study analyzed, this latter has been assumed to be 16 MN steel and to have a yielding coefficient normally distributed with mean equal to 390 MPa and standard deviation of 25.3 MPa. Moreover, the pipe is considered to be 216 m long and to have a diameter of 5 m. In order to take into account the effect of internal erosion occurring in the penstock, the thickness of the pipe has been assume uncertain, with values included between 12 mm and 16 mm. If the occurrence of water hammer results in the structural damage of the pipe, the facility is assumed to shut-down and hence the turbine would stop being operational (TurbineOperationalState). Apart from the occurrence of this kind of accident scenario, the turbine is assumed to be out of service also in the case of simple load rejection (LoadRejection) not resulting in the occurrence of water hammer or structural damages and in the case of maintenance (MaintenanceOutage).
3.4 Results
Fig. 3.4 shows the reduced CN obtained from the initial model (Fig. 3). Inference has been computed in the network, mainly aiming to quantify the probability of dam overtopping and of outage of the turbine unit for the different cases considered. In all of the scenarios analyzed
the probability of the occurrence of structural damages in the penstock remained largely ne-glectable. Also the probability of overtopping of the dam remains quite low for both the time scenarios considered, as shown in Table 1, while the probability of load rejection results quite signficant. This value is coherent with the historical average frequency of load rejection cal-culated on the basis of eight hydroelectric stations in China [21]. The overall results can be interpreted as proof of the robustness of the facility to rapid transients: even if a sudden rejec-tion of the load is required the structural safety of the penstock is guaranteed. Hence the design of the pipe results robust and the occurrence of pressure waves within the penstocks does not significantly threaten the overall safety of the facility. The probability of overtopping of the
Table 1: Inference computation results for the different time scenarios considered
Event 2021-2050 2071-2100
Dam Overtopping [1.84·10 6,2.35·10 4] [<10 22,2.67·10 4]
Load Rejection [6.92·10 1,6.98·10 1] [6.92·10 1,6.98·10 1]
Turbine not Operational [6.98·10 1,7.0·10 1] [6.98·10 1,7.0·10 1]
dam, even if it remains low in all the scenarios considered, appears to be strongly affected by uncertainty for the time period 2071-2100: this highlights the lower quality of the information available for this time scenario. The probability of overtopping was also quantified for the spe-cific emission scenarios considered, as shown in Table 2: it results higher for the high emission scenario in the first part of the time domain, while the upper bound of the probability appears lower for the SRES A2 scenario in the time period2071 2100. Nevertheless, due to the large
uncertainty affecting the output, the difference between the two trends appears not significant enough to deduce a clear path for the risk of overtopping in the two emission scenarios: more investigation, including further climate factors, is needed. In order to better comprehend the
Table 2: Inference computation results for the different time and emission scenarios considered
Medium Emission Scenario
Event 2021-2050 2071-2100
Dam Overtopping [1.29·10 5,1.06·10 4] [<10 22,2.96·10 4]
High Emission Scenario
2021-2050 2071-2100
Dam Overtopping [2.72·10 5,2.98·10 4] [<10 22,2.01·10 4]
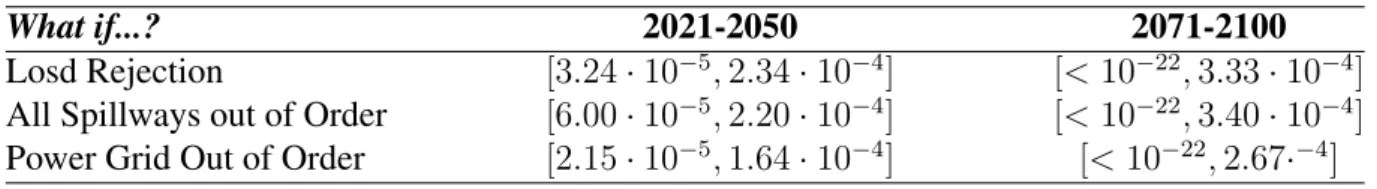
behaviour of the system, the probability of overtopping has been computed also in the case of several what-if scenarios, such as the occurrence of load rejection, the malfunctioning of the spillways and the loss of electric power from the external grid. In all these cases, shown in Table 3, the probability of overtopping grows sligthly with respect to the values shown in Table 1, demonstrating the robustness of the system with regards to these events.
Table 3: Probability of dam overtopping in the case of malfunction of specific subsystems
What if...? 2021-2050 2071-2100
Losd Rejection [3.24·10 5,2.34·10 4] [<10 22,3.33·10 4]
All Spillways out of Order [6.00·10 5,2.20·10 4] [<10 22,3.40·10 4]
4 Conclusions
A model for the vulnerability analysis of hydropower impoundment facilities was proposed. The suggested approach is based on the combination of Credal Networks with system reliability methods and takes into account the risk of overtopping of the dam, the structural safety of the penstock as well as the reliability of the power generation and connection systems. Further-more, thanks to the flexibility of the methodology adopted, the model allows to estimate the future risks related to the facility in view of climate change projections.
To test the validity of the model this has been applied to a simple case-study based on an existent hydropower station located in the north-west region of China. The analysis was carried out for the time periods2021 2050and2071 2100and for two different emission scenarios (SRES
B1 and A2). The results highlight the robustness of the facility to rapid transients (and hence to the risk of water hammer occurring in the penstock) on the one hand but result affected by strong uncertainty on the other. This can be attributed mainly to the high imprecision associated with the climate change projections.
Future research will focus on overcoming the current limitations of the model and on its further development in order to include other factors having the potential to affect the safety and pro-ductivity of the stations (e.g. temperature rise, droughts etc.). Indeed, the inclusion of further climate variables could result helpful in order to better track the evolution of the risk in time and hence in defining suitable precautionary measures able to effectively tackle future risks threatening both existing and new facilities.
5 Acknowledgement
This work has been supported by the the Newton Fund PhD Placement Programme and carried out with the collaboration of Northwest A&F University, YangLing, CH.
REFERENCES
[1] L Chen, D Li, and SC Pryor. Wind speed trends over china: quantifying the magnitude and assessing causality. International Journal of Climatology, 33(11):2579–2590, 2013. [2] M. de Angelis, E. Patelli, and M. Beer. Advanced line sampling for efficient robust
relia-bility analysis. Structural Safety, 52:170–182, 2015.
[3] S A Eide. Historical perspective on failure rates for us commercial reactor components.
Reliability Engineering & System Safety, 80(2):123–132, 2003.
[4] Finn R Forsund. Hydropower economics, volume 217. Springer, 2015.
[5] Congbin Fu, Zhihong Jiang, Zhaoyong Guan, Jinghai He, and Zhong-feng Xu. Regional climate studies of China. Springer Science & Business Media, 2008.
[6] R. Ghanem, D. Higdon, and H. Owhadi, editors.Handbook of Uncertainty Quantification, chapter COSSAN: A Multidisciplinary Software Suite for Uncertainty Quantification and Risk Management, pages 1–69. Springer, New York, U.S.A., 1 edition, 2017.
[7] Anders Hjort-af Ornas. Turning hydropower social: where global sustainability conven-tions matter. Springer Science & Business Media, 2007.
[8] W Jonker Klunne. Hydropower. In Encyclopedia of Energy, pages 651–655. SALEM Press: Hackensack, 2012.
[9] Magnus Thor Jonsson. A new approach for managing outages at hydro power plants using dependency structure matrix. Journal of Industrial and Intelligent Information Vol, 3(4), 2015.
[10] Jack Lewin, Geoffrey Ballard, and David S Bowles. Spillway gate reliability in the context of overall dam failure risk. USSD Annual Lecture, pages 1–17, 2003.
[11] B Mrowca. Emergency diesel generator failure review 1999 - 2001. Technical report, INFORMATION SYSTEMS LABORATORIES, Rockville, September 2011.
[12] K. Murphy. The Bayes net toolbox for MATLAB. Computing Science and Statistics, 33(2):1024–1034, 2001.
[13] Nebojsa Nakicenovic and Robert Swart. Special report on emissions scenarios. Spe-cial Report on Emissions Scenarios, Edited by Nebojsa Nakicenovic and Robert Swart, pp. 612. ISBN 0521804930. Cambridge, UK: Cambridge University Press, July 2000., 1, 2000.
[14] United States. Bureau of Reclamation. Freeboard criteria and guidelines for computing freeboard allowances for storage dams. Denver, Colo. : U.S. Dept. of the Interior, Bureau of Reclamation, 1981.
[15] E. Patelli, M. Broggi, M. de Angelis, and M. Beer. OpenCossan: an efficient open tool for dealing with epistemic and aleatory uncertainties. Vulnerability, Uncertainty, and Risk: Analysis, Modeling, and Management, pages 2564–2573, 2014.
[16] Bettina Schaefli, Benoˆıt Hingray, and Andr´e Musy. Climate change and hydropower pro-duction in the swiss alps: quantification of potential impacts and related modelling uncer-tainties. Hydrology and Earth System Sciences Discussions, 11(3):1191–1205, 2007. [17] D. Straub and Der Kiureghian. Bayesian network enhanced with structural reliability
methods: methodology. Journal of engineering mechanics, 136(10):12481258, 2010. [18] Glenn Swift and Tom Molinski. Power transformer life-cycle cost reduction. In
Pro-ceedings of the Minnesota Power Systems Conference (MIPSYCON), Minneapolis, USA, volume 111, 1996.
[19] S. Tolo, E. Patelli, and M. Beer. Risk assessment of spent nuclear fuel facilities considering climate change. ASCE-ASME Journal of Risk and Uncertainty in Engineering Systems, Part A: Civil Engineering, page G4016003, 2016.
[20] Silvia Tolo, Edoardo Patelli, and Michael Beer. Robust vulnerability analysis of nuclear facilities subject to external hazards.Stochastic Environmental Research and Risk Assess-ment, pages 1–24.
[21] Qinfen Zhang, Bryan Karney, Lisheng Suo, and Andrew F Colombo. Stochastic analysis of water hammer and applications in reliability-based structural design for hydro turbine penstocks. Journal of Hydraulic Engineering, 137(11):1509–1521, 2011.