The role of Germline-Encoded T cell
Receptor Complementarity Determining
Regions in T cell Selection and Function
By
Stephen Holland
Submitted for award of the degree:
Doctor of Philosophy
Department of Immunology
Hammersmith Campus
Imperial College London
This work was performed in the
T cell Development Group
Transplantation Biology Laboratory
Department of Immunology
Division of Medicine
Imperial College London
Hammersmith Campus
Du Cane Road
London W12 0NN
This work was carried out under the supervision of Professor Julian Dyson and
funded by the Wellcome Trust.
I certify that:
1. The thesis being submitted for examination is my own account of my research;
2. The research was carried out in an ethical manner;
3. The data and results presented are genuine and obtained by myself during the duration
of the research;
4. Where I have drawn on the work and ideas of others, that it has been appropriately cited in the thesis;
5. In instances where materials are provided from other sources or carried out on my behalf that these have been acknowledged at appropriate points in the text;
6. This thesis is within the required word limit as defined by Imperial College London
Graduate School of Life Sciences and Medicine.
The total word count of this thesis including appendices and references is: 74,343 words
I dedicate this thesis to my family, in particular my father Michael Holland, mother June Holland and brother Alistair Holland. Your endless support and unconditional sacrifice are
what have allowed me to reach this point. You have never shown me anything but encouragement regardless of where my choices have taken me and for that I will remain eternally grateful and continuously inspired, thank you. I would also like to dedicate this to
my partner Ireen, thank you for your understanding and strength throughout our time apart and I look forward to putting us before work and not the other way about.
Abstract
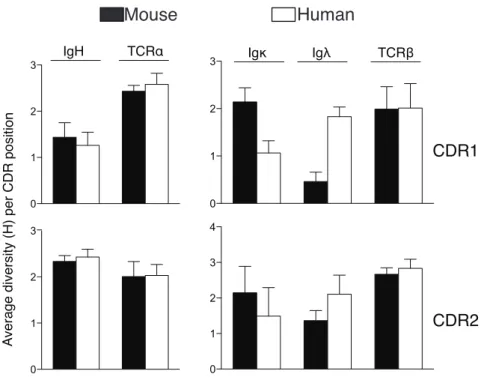
αβ T cell Receptors (TCR) recognise peptide antigen (p) presented on Major Histocompatability Complexes (MHC) via Complementarity Determining Regions (CDRs). TCRs are required to respond to a vast plethora of differing antigens and the CDR regions are suitably diverse, encoded by an array of gene-segments, which recombine during T cell development to generate diverse repertoires of TCRs. CDR1 and 2, which predominantly interact with the MHC, are encoded within gene-segments, and are subject to evolutionary pressure. However, CDR3 loops are non-germline and created through junctional diversity. TCRs are ‘MHC restricted’ and only respond to antigen in the context of MHC. An influential theory proposes that CDR1 and 2 have co-evolved with MHC and as such are inherently predisposed towards MHC recognition. This thesis used preliminary data derived from whole genome analysis of TCR CDR1 and 2 diversity relative to those of related immunoglobulins (which are not MHC restricted) to determine if there is any relationship between germline CDR diversity and MHC restriction. Conventional mutagenesis involving substituting CDR1 and 2 with artificial peptide linkers and replacement of βCDR1 and 2 with those of the related yet MHC unrestricted γTCR chain was carried out in concert with a novel system that embedded recombination cassettes into the CDR1 or 2 allowing in vivo generation and selection of a library of non-germline CDR1 or 2 mutants. Collectively, these data strongly infer a lack of requirement of germline CDR sequences in mediating MHC recognition in both pMHC-mediated T cell development and function. However, alteration of the germline sequence did affect the efficiency of T cell development, preference of MHC class type and the diversity of the subsequent T cell repertoire. Thus, germline CDR structures may facilitate a more diverse array of MHC docking modes to maximise the resultant TCR repertoire, contributing to an increased capacity for cross-reactivity, rather than imposing MHC restriction.
Acknowledgements
I would like to first and foremost acknowledge Julian for all his help, supervision and encouragement for the past three and a half years. I greatly appreciate your enthusiasm for my project and that from my very first week as a Masters student that you were open and interested in my ideas and opinions. Thank you also for the support you gave me when undertaking things not directly related to my project including my internship and presentations at the Houses of Parliament. (Also, thanks for the Bob Dylan tickets!).
In terms of technical assistance, I would like to thank Julian, Chai and Cristina for carrying out mouse work while I was being trained. I sincerely thank David for carrying out the skin grafting operations used for this work and teaching me how to score the experiments. This lab is truly the most altruistic I have come across and I am very much indebted to all your help over the last 3 and half years. I thank the previous students who contributed to making some of the original TCR constructs during their Masters projects, namely Matt, Eleni and Ed. I am indebted to our collaborators, Immanuel Luescher and Raphael Genolet for running my cDNA samples through their TCRβ V-segment qRT-PCR analysis. Ashkenaz Richard, an MSc student under my supervision, generated the βCDR1γ2γ3Δ constructs based on my design
and tested the constructs in vitro. Immunohistochemistry was kindly carried out by Fang-Ping and autoantibody ELISAs with Marta Szajna. Most of all I would like to thank Istvan, who designed and optimised the retrogenic approach for modified TCRs used in our lab and who literally taught me almost every technical aspect that was required to carry out this work during my own Masters rotation and at the beginning of my PhD.
Finally, I would like to acknowledge the fellow PhD students from the Wellcome Trust course for the fantastic sense of camaraderie and co-workers from the 10th floor immunology department for making the day to day working in the lab as enjoyable as it was. In particular I would like to acknowledge Eoin, Nick and Sonja for experiencing London and beyond with me over the past 4 years and I look forward to the inevitable crossing of paths in the future. Thanks to Chris and Graeme for indulging in my request to play some final gigs in 2010 and 2011 back up home, it was by the far the most enjoyable time I think we had and is no doubt not over yet.
List of papers submitted and published as a result of the work carried out during this thesis
• Bartok, I., S. J. Holland, H. W. Kessels, J. D. Silk, M. Alkhinji & J. Dyson, (2010) T
cell receptor CDR3 loops influence alphabeta pairing. Mol Immunol47: 1613-1618.
• Furmanski, A. L., I. Bartok, J. G. Chai, Y. Singh, C. Ferreira, D. Scott, S. J. Holland,
C. Bourdeaux, T. Crompton & J. Dyson, Peptide-specific, TCR-alpha-driven, coreceptor-independent negative selection in TCR alpha-chain transgenic mice. J Immunol184: 650-657.
• Holland, S.J., I. Bartok, M. Attaf, R. Genolet, I.F. Luescher, E. Kotsiou, A. Richard,
E. Wang, M. White, D. Coe, J-G. Chai, C. Ferreira and J. Dyson. The αβTCR uses an
antibody-like strategy to engage MHC ligands, Submitted.
Table of Contents
ABSTRACT... 5 ACKNOWLEDGEMENTS... 6 LIST OF PAPERS SUBMITTED AND PUBLISHED AS A RESULT OF THE WORK CARRIED OUT DURING THIS THESIS... 7 TABLE OF FIGURES...11 LIST OF TABLES...13 ABBREVIATIONS ...14 CHAPTER 1: INTRODUCTION...18
1.1 OVERVIEW OF ADAPTIVE IMMUNITY RECEPTOR EVOLUTION, THE T CELL RECEPTOR AND MHC RESTRICTION...18 1.1.1 Evolution of adaptive immunity receptor diversity...18 1.1.2 T cells and the αβTCR ...21 1.1.3 Discovery and characterisation of MHC restriction ...25 1.2 T CELL DEVELOPMENT AND THYMIC SELECTION...26 1.2.1 Overview of the thymus and homing of stem cells for T cell development ...26 1.2.2 Early development and commitment to the αβ lineage ...28 1.2.3 T cell selection, CD4/8 lineage choice and postthymic development...31 1.2.4 Development and selection of nTregs and other T cell subtypes...34 1.3 GENERATION OF THE TCR REPERTOIRE...37 1.3.1 Genetic structure of the αβ TCR loci in mice and humans...37 1.3.2 V(D)J recombination ...39 1.3.3 Maximising and maintaining TCR repertoire diversity ...41 1.4 TCR‐PMHC INTERACTIONS...44 1.4.1 The MHC – an overview...44 1.4.2 TCR binding to pMHC complexes ...48 1.4.3 CD4 and CD8: Structure, ligand binding and function...53 1.4.4 TCR binding and triggering mechanisms...56 1.4.5 TCRpMHC in disease: Alloreactivity and autoreactivity ...61 1.5 THE MECHANISM OF TCR RESTRICTION TO MHC...66 1.5.1 Germline encoded restriction of TCR CDR1 and 2 to MHC ...66 1.5.2 Evidence against germline restriction of TCR to MHC and alternative theories...74 1.6 AIM OF PROJECT...82 CHAPTER 2: GERMLINE TCR CDR ANALYSIS AND OVERVIEW OF EXPERIMENTAL APPROACH ...83
2.1 COMPARISON OF TCR AND IG GERMLINE CDR1 AND 2 REPERTOIRES...83
2.1.1 Overview ...83 2.1.2 Comparison of CDR1 and 2 lengths in TCR and Ig molecules...84 2.1.3 Analysis of germline CDR1 and 2 diversity in TCR and Ig molecules ...86 2.1.4 Conservation of CDR position is not directly related to MHC recognition...94 2.2 DESIGN AND OVERVIEW OF RETROGENIC APPROACH USED TO STUDY TCR CDR1 AND 2 ...95 2.2.1 Overview ...95 2.2.2 Overview of retrogenic system...95
2.2.3 Generation of modified TCRα and β chains...99
2.2.4 General comments on using a retrogenic approach ...102
2.3 CHAPTER SUMMARY... 104
CHAPTER 3: DESIGN AND USE OF A NOVEL IN VIVO MEDIATED RECOMBINATION SYSTEM TO MUTATE TCR CDR1 AND 2 ... 106
3.1 REDIRECTION OF V(D)J RECOMBINATION TO WT TCRβ CDR1 AND 2 GENERATES FUNCTIONAL TCRS IN VIVO THAT CAN MEDIATE MHC RECOGNITION... 106
3.1.2 Adoptive transfer of transduced HSC and detection of T cell selection...107
3.2 MATURE T CELLS GENERATED FROM RECOMBINATION CASSETTES INSERTED INTO WT TCRβ CDR1 AND 2 HAVE A DIVERSE NON‐GERMLINE REPERTOIRE... 109
3.2.1 Sorting of peripheral T cells and detection of recombined TCRβ chains ...109
3.2.2 Analysis of in vivo generated nongermline CDR1 and 2 repertoires ...110
3.2.3 Increase in net positive charge detected in modified CDR1 and CDR2 ...117
3.3 REDIRECTION OF V(D)J RECOMBINATION TO THE CDR1 OF A TCRβ CHAIN LACKING BOTH GERMLINE CDRS PRODUCES A NON‐GERMLINE REPERTOIRE INDEPENDENT OF WT SEQUENCE... 120
3.3.1 Overview of construct ...120 3.3.2 Adoptive transfer of transduced HSC and detection of T cell selection...121 3.4 MATURE T CELLS GENERATED FROM RECOMBINATION CASSETTES INSERTED INTO A TCRβ CDR1 GENERATE DIVERSE CDR1 REGIONS INDEPENDENT OF ANY GERMLINE STRUCTURE... 123 3.4.1 Sorting of peripheral T cells and detection of recombined TCRβ chains ...123 3.4.2 Analysis of in vivo generated WT CDR independent CDR1 repertoire...124 3.5 CHAPTER SUMMARY... 129
CHAPTER 4: FUNCTIONAL ANALYSIS OF TCRα AND TCRβ CDR1 AND 2 ... 132
4.1 DESIGN, GENERATION AND TESTING OF TCR MUTANTS... 132
4.1.1 Design of TCRα and TCRβ CDR1 and 2 mutants...132
4.1.2 Generation of TCRα and TCRβ CDR1 and 2 mutants...135
4.1.3 TCRs with modified CDR1 and 2 can form surface expressed TCRs with an endogenous partner chain repertoire...136
4.2 ANALYSIS OF THYMIC DEVELOPMENT OF T CELLS IN MICE LACKING TCRα AND TCRβ CDR1 AND 2. 138 4.2.1 Mice expressing exogenous TCRα chains have delayed T cell development and lower numbers of peripheral T cells than mice expressing exogenous TCRβ chains ...138
4.2.2 Analysis of thymi from mice expressing TCRβ chains lacking WT CDR1 and 2 have reduced selection efficiency and MHC class bias...143
4.2.3 Competition between GFP+ and GFP cells results in poor T cell selection in retrogenic TCRα mice...147
4.2.4 Removal of TCRβ but not TCRα CDR1 and 2 may inhibit Treg development...151
4.2.5 Removal of TCRα or TCRβ CDR1 and 2 results in a decrease in endogenous partner chain CDR3, but not Vsegment, diversity...155
4.2.6 Section summary...166
4.3 EXPRESSION OF TCRβ CHAINS GRAFTED WITH TCRγ CDR1 AND 2 RESTORES WT PHENOTYPE... 166
4.3.1 Overview ...166
4.3.2 Design, generation and testing of the βCDR1γCDR2γCDR3Δ mutant ...168
4.3.3 Mice expressing TCRβ with TCRγ CDR1 and 2 display thymic selection comparable to mice with WT TCRβ CDR1 and 2...170
4.4 FUNCTIONAL ANALYSIS OF T CELLS LACKING TCRα AND TCRβ CDR1 AND 2... 172
4.4.1 Overview ...172
4.4.2 T cells lacking TCRα or TCRβ CDR1 and 2 can still mediate Th2 responses...173
4.4.3 Loss of TCRα or TCRβ CDR1 and 2 does not prevent alloresponses...174
4.5 ISOLATED CASE OF LUPUS LIKE AUTOIMMUNITY IN MICE LACKING TCRβ CDR1 AND 2... 180 4.5.1 Mice repopulated with βCDR1Δ2Δ3Δ expressing T cells displayed significant weight loss and skin pathogenesis...180 4.5.2 Autoimmune phenotype was not induced by loss of Tregs but may have been related to increased antidsDNA antibody titres...182 CHAPTER 5: DISCUSSION... 184 5.1 OVERVIEW... 184 5.2 LIMITATIONS OF THE RETROGENIC APPROACH... 184
5.3 ANALYSIS OF GERMLINE AND CASSETTE GENERATED CDR1 AND 2 SUPPORT A REQUIREMENT FOR DIVERSITY OF MHC ENGAGEMENT... 185
5.4 FURTHER USES OF THE RECOMBINATION CASSETTES IN MHC RESTRICTION AND IMMUNOTHERAPY.. 188
5.6 IMPLICATIONS FOR ALLOREACTIVITY AND TOLERANCE TO SELF‐MHC... 192
5.7 TCR DOCKING ANGLE AND TCR BINDING AND TRIGGERING... 193
5.8 GENERAL FEATURES OF CDR BIOLOGY MAY BE IMPORTANT IN OPTIMAL MHC ENGAGEMENT... 194
5.9 COMMENT ON THE ISOLATED CASE OF AUTOIMMUNITY IN βCDR1Δ2Δ3Δ MICE AND MHC CLASS BIAS... 196
5.11 SUMMARY... 200 CHAPTER 6: METHODS AND MATERIALS ... 203 6.1 TCR NOMENCLATURE... 203 6.2 TCR RESIDUE NUMBERING... 203 6.3 C6 TCR... 203 6.4 CELL COUNTS... 203 6.5 MICE... 203
6.6 ANALYSIS OF GERMLINE TCR AND IG REPERTOIRE... 204
6.7 MOLECULAR BIOLOGY... 204 6.7.1 RNA extraction and generation of cDNA...204 6.7.2 TCR repertoire analysis...205 6.7.3 Mutant TCR generation by overlap PCR mutagenesis...206 6.7.4 Recombination cassette design and synthesis...207 6.7.5 Cloning of modified TCRs into pMigR1 vector...207 6.7.6 DNA sequencing...208
6.8 TRANSFECTION OF PHOENIX ECOTROPIC CELL LINE... 208
6.9 TRANSDUCTION OF PRIMARY CELLS WITH VIRAL SUPERNATANT... 209 6.9.1 HSC ...209 6.9.2 ConA blasts ...209 6.10 CELL PURIFICATION... 210 6.11 GENERATION OF BMDC ... 210 6.12 IN VITRO PROLIFERATION ASSAY... 210 6.13 FLOW CYTOMETRY... 211 6.13.1 Antibodies and hardware used ...211 6.13.2 Preparation of tissues ...211 6.13.3 Surface staining ...211 6.13.4 Internal staining...212 6.13.5 Secondary staining after serum incubation ...212 6.13.6 Fluorescence activated cell sorting (FACS) ...212 6.14 HISTOLOGY... 213
6.15 ENZYME‐LINKED IMMUNOSORBENT ASSAY (ELISA)... 213
6.15.1 Class switching ELISA...213 6.15.2 Autoimmune ELISA ...213 6.16 SKIN GRAFTING... 214 6.17 STATISTICAL ANALYSIS... 214 6.17.1 Shannon’s entropy analysis ...214 6.17.2 Unpaired student’s ttest and Oneway ANOVA...215 REFERENCES... 216 APPENDICES ... 237
Table of figures
Figure 1. 1: Overview of TCR structure...24
Figure 1. 2: Summary of T cell development in the thymus....28
Figure 1. 3: Only TCRs that bind pMHC within a narrow range of affinities are positively selected....34
Figure 1. 4: Chromosomal organisation of the murine TCRα/δ and TCRβ loci....38
Figure 1. 5: Overview of V(D)J recombination....40
Figure 1. 6: The structures of MHC class I and II....46
Figure 1. 7: The TCR binds pMHC with varying docking angles....53
Figure 1. 8: Structure of the CD4 and CD8 co-receptors....56
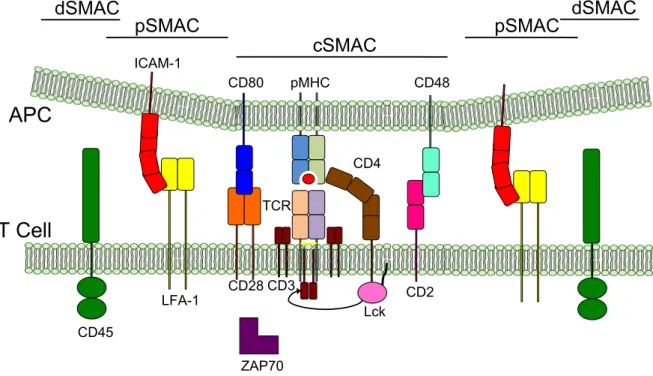
Figure 1. 9: The TCR signals as part of the immunological synapse....60
Figure 1. 10: Autoreactive TCRs can bind pMHC with abnormal topologies....65
Figure 1. 11: Conserved germline CDR interactions form interaction codons....69
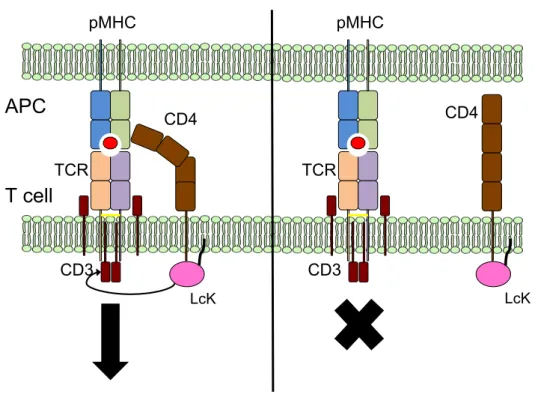
Figure 1. 12: Sequestering of signalling molecules by co-receptors may enforce TCR restriction to MHC....79
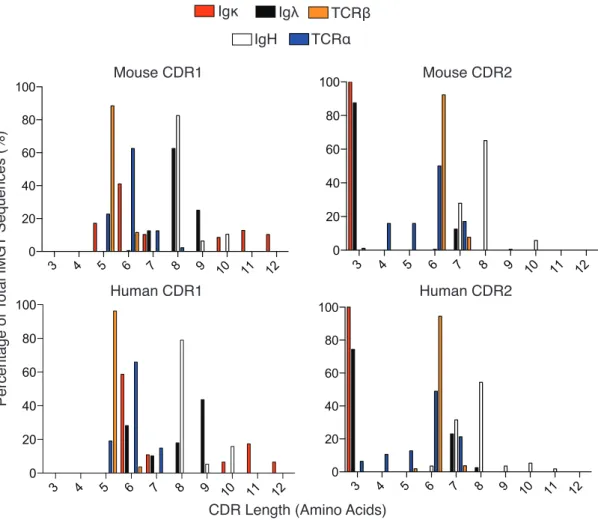
Figure 2. 1: Analysis of TCR and Ig germline CDR1 and 2 from mice and humans....86
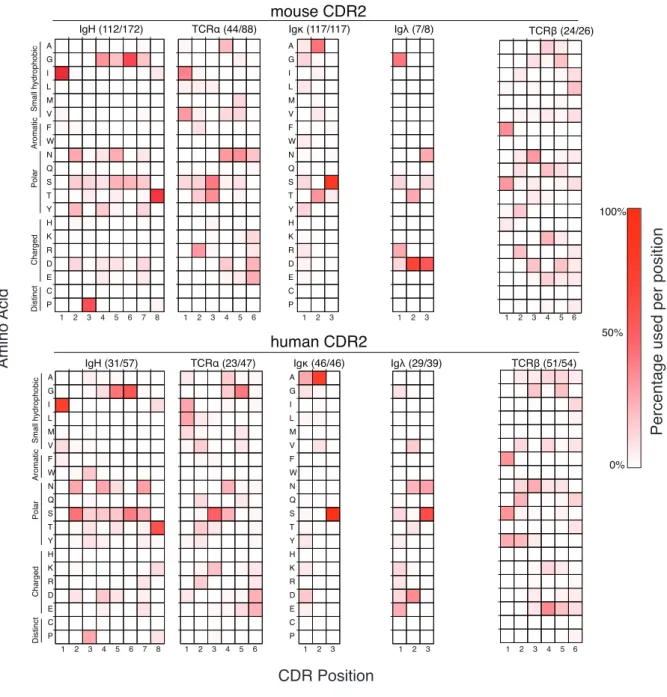
Figure 2. 2: Amino acid use within germline CDRs of mouse and human TCR and Ig variable gene segments..89 Figure 2. 3: Summary of average number of amino acids used per CDR position in TCR and Ig molecules....90
Figure 2. 4: Summary of average amino acid diversity per CDR position in TCR and Ig molecules....93
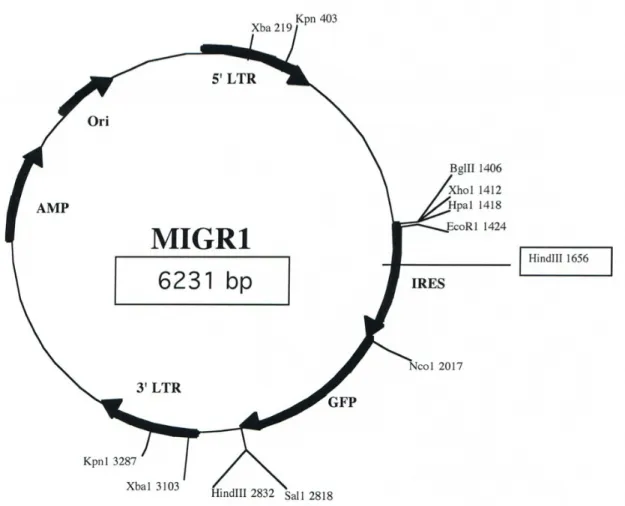
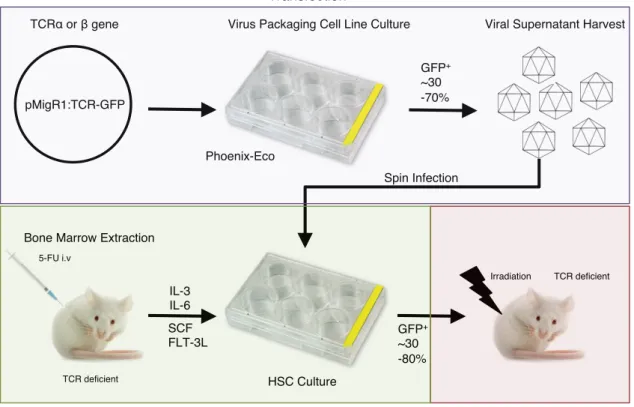
Figure 2. 5: Schematic of pMigR1 retroviral vector used for cloning of WT and modified TCRα and β chains.97 Figure 2. 6: Overview of the retrogenic system used to analysis TCR CDR function in vivo....98
Figure 2. 7: Summary of transfection efficiency into a packaging cell line of TCRα or β chain genes cloned into the pMigR1 retroviral vector....99
Figure 2. 8: Schematic overview of overlap PCR used to modify TCR CDR regions.... 100
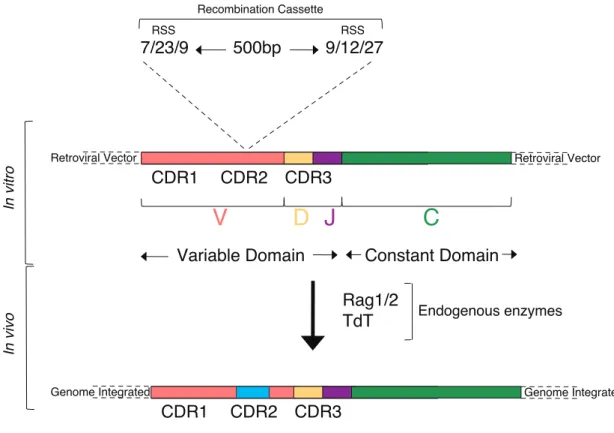
Figure 2. 9: Schematic overview of novel recombination cassette TCR CDR modification system.... 102
Figure 2. 10: The inherent variation in the retrogenic system results in adoptive transfer of varying numbers of GFP+ HSC.... 104
Figure 3. 1: Insertion of recombination cassettes into the WT CDR1 and 2 of βCDR3Δ. ... 107
Figure 3. 2: Generation of GFP+ T cells from βCDR1WT-Rec and βCDR2WT-Rec mice. ... 108
Figure 3. 3: Detection of splenic GFP+V β11+ T cells in TCRβδ-/- mice using βCDR1WT-Rec and βCDR2WT-Rec constructs. ... 109
Figure 3. 4: Analysis of cDNA from mice using βCDR1WT-Rec and βCDR2WT-Rec constructs confirms cassette recombination... 110
Figure 3. 5: Overall diversity of non-germline CDR1 and CDR2 mutants generated in vivo from βCDR1WT-Rec and βCDR2WT-Rec mice. ... 115
Figure 3. 6: Redirected V(D)J recombination to germline CDRs generates a restricted CDR1 but not CDR2 loop length... 116
Figure 3. 7: Amino acid and nucleotide modifications generated from WT TCRβ CDR1 and 2. ... 117
Figure 3. 8: In vivo generation of random non-germline CDR1 and 2 mutations result in an increase in net positive charge. ... 119
Figure 3. 9: Insertion of recombination cassettes into the CDR1 of a TCR βCDR3Δlacking germline CDR1 and 2 ... 121
Figure 3. 10: Generation of GFP+ T cells from βCDR1Δ-Rec mice... 122
Figure 3. 11: Detection of splenic GFP+V β11+ T cells in TCRβ-/- mice using βCDR1Δ-Rec construct... 122
Figure 3. 12: Analysis of cDNA from mice using the βCDR1Δ-Rec construct confirms cassette recombination. .... 123
Figure 3. 13: Overall diversity of non-germline CDR1 mutants generated in vivo from βCDR1Δ-Rec mice... 126
Figure 3. 14: Redirected V(D)J recombination to non-germline CDR1 generates a restricted CDR1 length.... 127
Figure 3. 15: Amino acid and nucleotide modifications generated from non-germline TCRβ CDR1. ... 127
Figure 3. 16: In vivo generation of random non-germline CDR1 mutations in the absence of any WT CDR sequence also results in an increase in net positive charge... 129
Figure 4. 1: Overview of CDR modification design to the C6 TCRα and β chain templates. ... 133
Figure 4. 2: Generation of TCRα and TCRβ CDR mutants and sub-cloning to the pMigR1 vector... 136 Figure 4. 3: TCRα and β germline CDR mutants can form surface expressed TCR with an endogenous partner
chain repertoire... 137 Figure 4. 4: Generation of mice expressing WT and CDR modified TCRα and TCRβ chains... 139
Figure 4. 5: Retrogenic mice expressing exogenous WT or mutant TCRα chains develop few GFP+ T cells.... 141 Figure 4. 6: Loss of TCRβ CDR1 and 2 results in increased homeostatic expansion of CD4 and CD8 T cells. 142
Figure 4. 7: Replacement of germline CDR1 and 2 structures with glycine-alanine linkers results in decreased selection efficency... 144 Figure 4. 8: Removal of germline βCDR1 and 2 results in a CD4 bias selected in the thymus... 146
Figure 4. 9: The thymically selected CD4 bias in βCDR1Δ2Δ3Δ mice is maintained in peripheral lymphoid organs. ... 147 Figure 4. 10: T cell selection in WT and mutant TCRα retrogenic mice is poor, regardless of the selecting
haplotype. ... 148 Figure 4. 11: GFP- cells from TCRα retrogenic mice progress through T cell development and populate the DP
compartment... 149 Figure 4. 12: Removal of TCRα germline CDR1 and 2 results in a slight CD8 bias in peripheral lymphoid organs... 150 Figure 4. 13: Replacement of germline CDR1 and 2 flattens the interaction surface of TCR. ... 151 Figure 4. 14: Removal of germline TCRβ CDR1 and 2 does not prevent thymic generation of nTregs... 152 Figure 4. 15: TCRα and TCRβ retrogenic mice contain both induced and natural Tregs based on FoxP3 and
helios expression. ... 154 Figure 4. 16: Removal of TCRα CDR1 and 2 does not alter endogenous TCRβ V-segment diversity... 156 Figure 4. 17: Removal of TCRβ CDR1 and 2 does not alter endogenous TCRα V-segment diversity... 157
Figure 4. 18: Schematic depicting the definition of TCRα and TCRβ CDR3 boundaries as used in this study. 158 Figure 4. 19: Removal of germline TCRα or TCRβ CDR1 and 2 results in a decrease in endogenous J-segment
usage... 164 Figure 4. 20: Removal of germline TCRα or TCRβ CDR1 and 2 results in a decrease in endogenous CDR3
diversity. ... 165 Figure 4. 21: Design and creation of the βCDR1γ2γ3Δ construct. ... 169 Figure 4. 22: T cells using the βCDR1γ2γ3Δ chain can be selected in vivo. ... 170 Figure 4. 23: Replacement of germline TCRβ CDR1 and 2 with TCRγ CDR1 and 2 maintains WT selection efficiency... 171 Figure 4. 24: Replacement of germline βCDR1 and 2 with non-germline, structured CDR1 and 2 regions retains a WT like T cell development phenotype. ... 172 Figure 4. 25: TCRs lacking germline α or βCDR1 and 2 can still adapt to induce Th2 responses. ... 174
Figure 4. 26: TCRs lacking germline α or βCDR1 and 2 maintain the ability to distinguish self and non-self MHC in vitro. ... 175 Figure 4. 27: TCRβ chains lacking germline CDR1 and 2 maintain the ability to reject allogeneic skin in vivo.
... 177 Figure 4. 28: Less efficient allo-recognition in βCDR1Δ2Δ3Δ is related to sub-optimal repopulation of the grafted mice. ... 179 Figure 4. 29: Indication of autoimmunity in mice adoptively transferred with βCDR1Δ2Δ3Δ T cells... 181 Figure 4. 30: βCDR1Δ2Δ3Δ mice displaying autoimmune phenotype had increased titres of autoantibodies. ... 183
Figure 5. 1: Replacement of C6 TCRα and TCRβ CDR1 and 2 with glycine-alanine linkers polarises the net charge of each chain.... 200
List of Tables Table 1. 1: T cell lineages...36 Table 1. 2: Number of TCR gene segments encoded in the mouse and human genome...39 Table 1. 3: Forms of TCR crossreactivity...43 Table 1. 4: Summary of common polymorphic MHC alleles ...44 Table 1. 5: Summary of known common HLA allele numbers...47 Table 1. 6: Overview of proposed mechanisms for TCR signal triggering...59 Table 1. 7: Summary of autoimmune TCRs...65
Table 1. 8: Vβ8.2 TCRs with unique TCRα or βDJCDR3 usage maintain germline contacts...69
Table 1. 9: Summary of key germline TCR CDR positions and corresponding MHC interactions highlighted by Marrack et al, 2008...70 Table 1. 10: Summary of further evidence supporting a form of germlineencoded restriction of TCR to MHC ...73 Table 1. 11: Summary of proposed nonMHC αβTCR ligands ...81 Table 2. 1: Calculated diversity of most common length CDR in Ig and TCR chains in mice and humans ...92 Table 2. 2: Brief overview of TCR genes cloned into pMigR1 vector...96
Table 3. 1: Full repertoire of sequences generated from βCDR1WTRec mice... 111
Table 3. 2: Full repertoire of sequences generated from βCDR2WTRec mice... 113
Table 3. 3: Sample sequences from the whole thymus of a βCDR2WTRec mouse ... 120
Table 3. 4: Full repertoire of sequences generated from βCDR1ΔRec mice ... 125
Table 4. 1: Summary of common mouse strain haplotype and MHC allele use ... 135
Table 4. 2: Summary of unique CDR3 sequences associated with Vα9 in TCRβ retrogenic mice ... 161
Table 4. 3: Summary of unique CDR3 sequences associated with Vβ7 in TCRα retrogenic mice ... 163
Table 6. 1: Forward (F) and reverse (R) primers used to analyse TCR repertoires via sequencing ... 205
Table 6. 2: Forward (F) and reverse (R) primer sequences for overlap mutagenesis... 207
Abbreviations Abbreviation Definition °C Degrees Celsius 5-FU 5-Fluorouracil Å Angstroms Ag Antigen
AID Activation-induced Cytidine Deaminase AIRE Autoimmune Regulatory Protein
APC Antigen Presenting Cell
Be Beryllium
BM Bone Marrow
BMDC Bone Marrow derived Dendritic Cell bp Base Pairs
BSA Bovine Serum Albumin c-Kit Tyrosine Protein-kinase Kit CBD Chronic Beryllium Disease CCR Chemokine Receptor
CD Cluster of Differentiation Gene cDNA Complementary DNA
CDR Complementarity Determining Region Ci Curie Sievert
cm2 Centimetres Squared CNS Central Nervous System CO2 Carbon Dioxide ConA Concanavalin A cSMAC Central SMAC
cTEC Cortical Thymic Epithelial Cell CTL Cytotoxic Lymphocyte
CXCL C-X-C Motif Ligand CXCR C-X-C Motif Receptor
D Diversity
DC Dendritic Cell
ddH20 Double Distilled Water DN Double Negative DNA Deoxyribonucleic Acid
DP Double Positive ds Double Stranded dSMAC Distal SMAC
E Enhancer
EBV Epstein Barr Virus
EDTA Ethylenediaminetetraacetic Acid ELISA Enzyme Linked Immunosorbent Assay
ETP Early Thymocyte Progenitor FACS Fluorescence Activated Cell Sorting
FasL Fas Ligand FCS Foetal Calf Serum
FLT3 Fms-related Tyrosine Kinase 3 FTOC Foetal Thymic Organ Culture
GM-CSF Granulocyte Macrophage-Colony Stimulating Factor GPCR G-protein Coupled Receptor
H SA Heat Stable Antigen HEL Hen Egg Lysozyme HLA Human Leukocyte Antigen HMGB High Mobility Group Protein B
HPRT Hypoxanthine-guanine Phosphoribosyltransferase HTLV-1 Human T cell Lymphotrophic Virus 1
HV Hypervariable Region i.p. Intraperitoneal i.v. Intraveneous
ICAM-1 Intracellular Adhesion Molecule 1 IEL Intra-epithelial Lymphocyte IFN Interferon
Ig Immunoglobulin
IgSF Immunoglobulin Super Family IL Interleukin
IMDM Iscove’s Modified Dubeccos Medium IRES Internal Ribosomal Entry Site
IS Immunological Synapse iSP Immature Single Positive
ITAM Immunoreceptor Tyrosine-based Activation Motif ITC Isothermal Titration Calorimetry
iTregs Inducible Regulatory T cells
J Joining
kg Kilogram
KO Knockout
Lck Lymphocyte-Specific Protein Tyrosine Kinase LCMV Lymphocytic Choriomeningitis Virus
LFA-1 Lymphocyte Function-associated Antigen 1
LN Lymph Node
LPS Lipopolysaccharide LTR Long Terminal Repeats MBP Myelin Basic Protein
mg Milligram
MHC Major Histocompatibility Complex ml Millilitre
MLP Myeloid Lymphoid Progenitors MLR Mixed Lymphocyte Response
mM Millimolar MP Matrix Protein MS Multiple Sclerosis
MSEP Mean Surface Electrostatic Potential MST Median Survival Time
mTEC Medullary Thymic Epithelial Cell
mϕ Macrophage
nM Nanomolar
nm Nanometres
nTregs Natural Regulatory T cells OH Hydroxyl Group
PBS Phosphate Buffer Solution PCR Polymerase Chain Reaction PEco Phoenix Ecotropic
pMHC Peptide-MHC complex PSGL-1 P-selectin Ligand 1 pSMAC Peripheral SMAC
pTα Pre-TCRα Chain
RAG Recombinase Activating Genes RNA Ribonucleic Acid
RPM Revolutions Per minute
RPMI Roswell Park Memorial Institute RSS Recombination Signal Sequence
RT Room Temperature RTE Recent Thymic Emigrants
s.c. Subcutaneous
S.E.M Standard Error of the Mean SCF Stem Cell Factor
SCZ Sub-capsular Zone SD Standard Deviation
SLE Systemic Lupus Erythematosus SMAC Supramolecular Activation Complex
SN Supernatant
SPF Specific Pathogen Free SPR Surface Plasmon Resonance
TAP Transporter Associated with Antigen Processing TCR T cell receptor
TdT Terminal Deoxynucleotidyl Transferase TEA T Early Alpha
Th T Helper Cell
TM Transmembrane
TREC TCR Excision Circles Tregs Regulatory T cells
UTR Untranslated Region
V Variable
ZAP70 Zeta Chain-association Protein Kinase 70 β2m β2-Microglobulin
µg Microgram
µl Microlitre
Chapter 1: Introduction
1.1 Overview of adaptive immunity receptor evolution, the T cell receptor and MHC restriction
1.1.1 Evolution of adaptive immunity receptor diversity
The immune system is the second most complex studied after the central nervous system (CNS). The multifarious nature of the immune system is underpinned by its ability to rid the body of pathogens both through effective innate and exquisitely specific adaptive means, with these branches often cooperating across almost every tissue and organ in the body. The fundamental property of an adaptive immune system is the generation of diversity in lymphocytic cell receptors: facilitating potent but targeted responses to clear specific infections. Coupled to this effector role is the requirement to self‐regulate, both against over‐reaction to infection and unintentional reaction to self. In all jawed vertebrates, the adaptive immune response is mediated through cellular and humoral arms, which are controlled by T cell and B cell lymphocytes respectively. Diversity is created via the generation of clonal repertoires through recombination of loci that contain multiple related, but distinct gene‐segments that are recombined in unique combinations in each lymphocyte. An adjunct to this generation of combinatorial diversity is that of junctional diversity, whereby the addition and subtraction of random nucleotides upon segment joining creates hypervariable, non‐germline junctions. While evolution and speciation inevitably results in adaption and specialisation of organs and systems, the adaptive immune system has remained incredibly conserved in terms of basic features and machinery, with evolution instead working within a common framework (Pancer and Cooper, 2006).
In jawed vertebrates the adaptive machinery is formed from three distinct but related heterodimeric molecules from the immunoglobulin superfamily (IgSF) which all contain structurally similar immunoglobulin (Ig) domains (see the next section). The IgSF domains are the most common used in immune defence molecules (Barclay, 2003). These molecules include the Immunoglobulins (Ig) and the two T cell receptor (TCR) isotypes, αβ and γδTCRs, expressed on B cells and T cells respectively. All three receptor types and their associated immune responses are conserved from the earliest cartilaginous fish (Rumfelt et al 2001 and Criscitiello et al, 2010) and share the same
form of recombination process (See Section 1.3.2). Further, the presence of both primary (lymphocyte developing) and secondary (lymphocyte responding) organs in jawed vertebrates is also maintained. Very few modifications of these basic constituents have been selected for during evolution. Perhaps the most extreme adjustment is the organisation of the lymphoid organs themselves, which can vary anatomically (Boehm and Bleul, 2007). Indeed, a functional second thymus (where TCR recombination occurs during T cell development) was discovered in mice (Terszowski et al, 2006). Also, a mammalian specific novel TCR locus termed TCRµ has been discovered in the ancient
monotreme, the duck‐billed platypus, that is absent from all marsupial and placental mammals studied and other jawed vertebrates (Wang et al, 2011).
Such is the overall evolutionary “success”, however, of the adaptive immune system that a remarkable occurrence of convergent evolution has been recently defined in jawless chordates, which include lampreys and hagfish. Jawless fish while containing IgSF molecules, do not appear to express diverse Ig or TCR related molecules, yet could conduct immune responses that infer the presence of diverse and specific repertoire (Finstad and Good, 1964). RNA extracted from lamprey larvae immunised with a heterogeneic bacterial mixture was discovered to contain a diverse repertoire of leucine rich repeat (LRR) containing receptors, now termed variable lymphocyte receptors (VLRs; Pancer et al, 2004). These unique but similarly diverse proteins have now been shown to contain distinct but comparable recombination loci structures, recombination processes (Rogozin et al, 2007) and have even been shown to demonstrate analogous humoral and cellular B and T‐like lineages and show evidence of primary lymphoid thymus‐like structures (Alder et al, 2005; Kim et al, 2007 and Bajoghili et al, 2011).
Igs consist of a heavy (H) and a light (κ or λ) chain, each of which are encoded through the rearrangement of distinct loci. Similarly, the α, β, γ and δ TCR chains are also encoded by distinct loci. However, evidence suggests cross‐loci recombination may have been prevalent in ancestral systems (Criscitiello et al, 2010). Based on the processes of recombination to create the variable domain of these proteins, the IgH, TCRα and TCRγ can be considered comparable chains, as can the partner Igκ, Igλ, TCRβ and TCRδ. The former group’s variable domains are generated from variable (V) and joining (J) segments and the latter V, J and diversity (D) segments in a process called V(D)J recombination. These are then spliced to the constant (C) domain (see Section 1.3 for
details). Phylogenetic analysis comparing the constant domains of each chain has proposed that the γδTCR loci pre‐empted the evolution of the Ig and αβTCR (Richards and Nelson, 2000). Another model based on comparison of mouse and human genomes predicted a primordial heterodimer consisting of one V‐J‐C and one V‐D‐J‐C chain underwent a duplication to generate Ig and TCRαβ loci and a second duplication of the αβTCR loci resulted in the γδ loci (Glusman et al, 2001).
Regardless of the original source of the variable IgSF based receptor, three key events underlie the subsequent evolution of repertoire generation: the “space” and pressure to generate a variety of gene‐segments, a mechanism with which to facilitate combinatorial diversity via recombination and a system to introduce the hypervariable sequences at the non‐homologous segment joins. As with any genome diversification, gene duplication is required to loosen the constraints on maintaining the original genes’ sequence. However it is the duplication of the whole chordate genome, termed the 2R hypothesis that is proposed to have heeded the emergence and subsequent diversification of adaptive immune genes (Kasahara, 2007). In order to generate gene segments, one assumes a proto‐immune receptor would need to be split. The basic process of recombination is centred on the function of two DNA repair enzymes called recombination activating genes (RAG) 1 and 2, which have been characterised for the majority of vertebrates. These enzymes catalyse the breaking of DNA between gene‐ segments through recognition of recombination signal sequence (RSS; Section 1.3.2). It is believed these genes were acquired through horizontal transfer from commensal or pathogenic bacteria and are most related, in terms of sequence, gene orientation and RSS to a transposon called transib (Kapitonov and Jurka, 2005 and Fugmann et al, 2006). It is likely that the horizontal transfer process resulted in insertion into an ancestral antigen receptor gene that consisted of exons encoding for proto‐V and C like domains. Transposon insertion to the proto‐V exon would result in splitting into a proto‐V and proto‐J segment for example (Lewis and Wu, 1997; Schatz, 2004 and Mazza and Malissen, 2007). As will be discussed, the generation of hypervariaibilty through non‐ homologous end joining during recombination is arguably the most important feature facilitating antigen (Ag) recognition in the adaptive immune response. This process during Ig and TCR loci recombination is mediated by terminal deoxynucleotidyl transferase (TdT; Section 1.3.2). As with the RAG1/2 complex, TdT is an early progenitor that is highly conserved throughout jawed chordates that was discovered upon sequencing of the purple sea urchin genome, which also contained other factors
required for V(D)J recombination including xrrC4, Ku70, Ku80 and DNA ligase IV (Hibino et al, 2006; Section 1.3.2). Overall, the nature of adaptive immunity has been favoured from a very basic evolutionary point in chordata evolution, thus emphasising the benefits of diverse immune receptors. Despite the wasteful nature of loci recombination, the changing and evolving nature of host‐pathogen interactions no doubt underpin the retention of such a diverse system. As discussed in the next two sections however, despite common evolutionary starting points, related structures and identical recombination processes, the αβTCR has evolved a very unique and complex form of Ag recognition relative to Ig and most likely γδ T cells also.
1.1.2 T cells and the αβTCR
In mice and humans, αβ T cells form approximately 90‐95% of the total T cell population (Davis et al, 1998) with the remaining 5‐10% made up by the γδ lineage. αβ T cells fall under two major functional lineages, the decision of which is imparted during T cell selection in the thymus (Section 1.2). These lineages are defined by the expression of a CD4 or CD8 co‐receptor, which aid the TCRs in antigen recognition and downstream signalling (see Section 1.4.3). CD8 T cells, also known as cytotoxic T lymphocytes (CTLs), kill cells infected with intracellular pathogens, such as viruses. Upon engagement of the TCR with its ligand, a class I major histocompatibility complex presenting an antigenic peptide (pMHC; see next section), CD8 T cell responses include production of the cytokine interleukin (IL)‐2 resulting in proliferation of the activated cells. Infected cells up‐regulate cell surface expression of Fas ligand (FasL), which is recognised by its receptor, Fas, on activated CD8 T cells ultimately inducing apoptosis (Nagata, 1994). IL‐ 2 also induces expression of perforin which inserts into the target cell’s membrane (Podack and Konigsberg, 1984) facilitating the entry of effector molecules such as granzyme B, a serine protease that activates caspase enzymes, which subsequently cleave cathepsin substrates leading to DNA degradation and thus apoptosis (Jenne and Tschopp, 1988).
CD4 T cells were for a long time divided into two helper subsets, Th1 and Th2 that could be induced upon TCR engagement with class II pMHC. The classic Th1 response is mediated through TCR engagement coupled to interferon‐γ (IFNγ) and IL‐12 production from the MHC expressing antigen presenting cells (APC) such as dendritic cells (DC). Th1 lineage commitment is defined by expression of the transcription factor Tbet (Szabo
controlling macrophage (mΦ) activation and T cell proliferation respectively. The Th2 response is also defined by expression of a dominant transcription factor, GATA‐3 (Yamashita et al, 2004). The classic Th2 response is characterised by autocrine IL‐2 and IL‐4 loops. Production of IL‐4 and IL‐5 results in induction of the humoral immune response through activation of B cells and subsequent production of Igs. In the past decade or so, several additional T cell lineages have been defined including those that are induced in the periphery and those that develop in the thymus and possess effector and regulatory functions (Section 1.2.3). The majority of T cell responses, both effector and regulatory, are mediated through the αβTCR and its recognition of class I or class II pMHC complexes in conjunction with the CD4 or CD8 co‐receptor. The αβ TCR chains were first isolated and identified as being variable by Kappler et al (Kappler et al, 1983) through tryptic peptide fingerprint analyses of isolated protein from T cell hybridomas. Here, fingerprints from the same T cell clone contained identical readouts that differed from other clones. Analysis of T cell specific cDNA sequences and comparison to known Ig sequences in three parallel landmark studies published in Nature, for the first time defined chains of the T cell antigen receptor (Hedrick et al, 1984; Hedrick et al, 1984b and Yanagi et al, 1984). The studies also predicted these receptors would be structurally comparable to the antigen recognition portion of Ig molecules, the so‐called Fab portion, which incorporates the IgC and IgV domains of the light chain and the IgV and terminal IgC domains of the heavy chain. Mutagenesis of a TCR specific for pigeon cytochrome‐c presented on H2‐Ek MHC
molecule (see Section 1.4.1 for MHC nomenclature) found that alteration of a residue in the proposed βCDR1 region prevented recognition of the cognate ligand, further supporting the Fab basis for TCR structure and Ag recognition (White et al, 1993).
The first isolated TCR chains were crystallised in 1995 from the 14.3.d (Bentley et al, 1995) and 1934.4 (Fields et al, 1995) TCRs. The first structures of αβ TCR heterodimers containing the Vα and Vβ domains were solved a year later (Garboczi et al, 1996 and Garcia et al, 1996). The αβTCR is a heterodimer of the TCRα and β chains, which contain two Ig domains each, termed the constant and variable domains. The IgSF family fold consists of two anti‐parallel β‐sheets that are sandwiched together by internal hydrophobic interactions and disulphide links. Two members of the IgSF make up TCRα and β chains. IgC1 domains, which generally contain 7 relatively shorter strands in their sheets, form the constant domains of both chains. The variable domains are made from
IgV domains, which consist of 9 strands in the β sheets and are generally longer. The β‐ sheet strands are labelled A, B, C, C’, C”, D, E, F and G (Figure 1.1A). The loops protruding from the surface of the Vα and Vβ domains are termed complementarity determining regions (CDR). These are the regions where diversity is focused as a result of the aforementioned combinatorial and junctional variation. Both chains contain two germline CDRs (CDR1 and 2) that are encoded entirely within the variable V‐segments and constitute the peptide loops linking strands B‐C and C’‐C” respectively. Strand F is also encoded within the germline V‐segments and links to strand G. Strand G is encoded entirely by (D)J segments and the resultant loop that forms between them during V(D)J recombination encodes for the hypervariable CDR3. Jα and Jβ segments contain a di‐ glycine motif (GXG) that serves to bulge the peptide loop ensuring proper orientation of the CDR3 and pairing of the Vα and Vβ domains in the heterodimer (Figure 1.1B). The TCRβ chain also contains a fourth region of hypervariability, often termed hypervariable (HV) 4 or CDR4. This region was determined by Jores et al (Jores et al, 1990) through application of the Wu‐Kabat variability coefficient on collated sequences of 119 TCRβ chains and proposed to exist between strands D‐E. CDR switching and structural studies have demonstrated that CDR4 is rarely implemented in any form of Ag recognition with the exception of some superantigens – pathogen or genome encoded proteins that interact with pMHC and TCR ectopically, relative to normal Ag recognition (Irwin et al, 1993; White et al, 1993; Asmuss et al, 1996 and Papageorgiou et al, 2009). As discussed in Section 1.4, αβ TCRs can undergo conformational changes upon ligand engagement and the majority of this is restricted to the CDR3 loops. In the unbound form, germline CDR1 and 2 loops from both TCR chains are proposed to exist in defined canonical states that is determined predominantly by CDR length and amino acid composition that result in differences in the ϕ and Ψ peptide bond angles generating three possible states in each of the germline CDRs (Al‐Lazikani et al, 2000). The overall elbow angle of the TCRα and TCRβ chains, the angle formed between V and C domains, ranges from between 140°‐210°, which is less than for comparable Ig measurements, most likely due to the requirements of downstream molecular interactions (Rudolph et al, 2006).
The most conserved region of the TCRα and TCRβ chains are the transmembrane (TM) stalks that anchor the chains to the membrane and facilitate interaction with the downstream signalling complex, CD3. These were named conserved antigen receptor transmembrane (CART) motifs. Comparison of Ig, TCRα, TCRβ, TCRγ and TCRδ TM
sequences revealed a relatively conserved sequence that when modelled, formed a TM α‐helix, placing the conserved residues in key positions to interact with the lipid bilayer or other amino acids within the membrane (Campbell et al, 1994). Despite the evolutionary and conserved tertiary structural relationship between the αβTCR and Ig molecules, the αβTCR has evolved a remarkable and hitherto unique relationship in regard to ligand recognition. While both receptors respond to Ag in the form of peptide fragments, Ig CDRs recognise intact, pathogen derived Ag, whereas αβ TCRs only respond to Ag in the context MHC class I or II, the phenomenon termed MHC restriction.
Figure 1. 1: Overview of TCR structure.
(A) Schematic of αβTCR variable (V), constant (C) and transmembrane (TM) domains (left). The picture on the right represents a birds-eye view of the TCR variable domain. Squares represent the tops of the β-strands that
make up the domains and are labelled as described in the text. The red lines represent the three αCDRs (α1-3) and four βCDRs (β1-4) and black lines represent other non-CDR links between the β-sheets. The relative
carboxyl (C) and amino (N) termini are labelled for each chain. Diagram is adapted from Al-Lazikani et al, 2000. (B) Crystal structure (right) depicting the general structure of the 2C TCR (PDB: 1TCR). The TCRα (red)
and β (green) chain domains are labelled as for part A. The portion magnified on the left shows the three CDR
loops of the TCRα chain (grey) to demonstrate their relative position.
1 2 3 V! C! V" C" "3 "1 "2 N !1 !2 !3 N C C V! V" A B C C' C" D E F G A B C C' C" D E F G "4 V! C" CDR
A
B
V" C! TM1.1.3 Discovery and characterisation of MHC restriction
In 1936, studies “transplanting” sera from donor mice to recipients of a different strain followed by measuring agglutination reactions with isolated erythrocytes was the first proof of the body’s ability to distinguish self from non‐self (Gorer, 1936). This relationship was further defined genetically by George Snell who summarised several studies that included the transplant of tumours to inbred mice of different pure and crossed strains and measuring tumour rejection, showing a clearly delineated relationship between genetic background and tumour rejection (Gorer et al, 1948 and Snell, 1948). He subsequently first coined the phrase “histocompatibility” gene and suggested that such genetic differences would apply to any transplanted tissues. In 1975, Zinkernagel and Doherty’s Nobel Prize winning experiments demonstrated that in order to respond to Ag from lymphocytic choriomeningitis virus (LCMV) the infected cells had to express the correct class I MHC gene as well as the viral Ag (Zinkernagel and Doherty, 1975). Fused T cell hybridomas with different MHC and Ag specificities were found to retain both individual reactivity to the original hybridomas, but did not acquire the capability to respond to the MHC of one hybridoma with the Ag specificity of the other, inferring a physical link between TCR‐Ag‐MHC (Kappler et al, 1981). Two models were proposed to explain this result; one involving a physical relationship between the Ag and MHC, jointly recognised by the T cells and a second whereby the MHC and Ag interact allosterically and are jointly recognised by distinct regions of the same TCR (Schwarz, 1985). Experiments by Haber‐Katz et al (Haber‐Katz et al, 1983) showed the ability of a single T cell clone to recognise a moth cytochrome c derived Ag in the context of two different MHC molecules, whereas the related pigeon cytochrome derived Ag was only recognised in the context of one of the MHC molecules. Through mutagenesis, this was demonstrated to be related to residue differences between the Ag that must affect MHC binding and not TCR stimulation, thus proving a direct Ag‐MHC relationship. Final evidence highlighting the relationship between peptide Ag and MHC came through experiments demonstrating that Ag from influenza virus was required to facilitate assembly of a surface expressed class I MHC (Townsend et al, 1989). Experiments from both class I and class II MHC eventually confirmed direct binding of peptide Ag to the MHC (Babbitt et al, 1985 and Boyd et al, 1992). Similarly, TCR‐pMHC interactions have been characterised in in‐depth structural and functional detail for their roles in T cell development in the thymus, T cell homeostasis, and allogeneic recognition of non‐self
MHC as well as in immune responses. However, as is the main crux of the study presented herein, the molecular underpinning of why TCRs are MHC restricted has yet to be elucidated or demonstrated irrefutably. The following sections summarise T cell development in the thymus and the generation and optimisation of the TCR repertoire, before discussing the current molecular understanding of TCR‐pMHC interactions and recent theories surrounding the molecular basis of TCR restriction to MHC.
1.2 T cell development and thymic selection
1.2.1 Overview of the thymus and homing of stem cells for T cell development
The thymus is a lobed structure found directly in front of the heart in humans. While originally thought of as lymphocyte cemetery, due to the high level of cell death, thymectomised mice were shown to lack a specific type of lymphocyte, subsequently named T cells (Miller, 1961). The high level of cell death is in fact related to the stringent developmental rules applied for successful T cell development (see Section 1.2.3). The process of αβT cell development includes two defined phases, split into distinct developmental checkpoints. First is TCR independent development, which includes the homing of stem cells to the thymus and commitment to T cell development ending in induction of TCRβ, γ and δ loci rearrangement. For αβ T cell development, the second phase is TCR dependent and requires rearrangement of the TCRα locus (see previous section and Section 1.2.3), the audition of TCR genes for surface expression and signalling, followed by selection steps that assess the ability of the TCR to recognise Ag in the context of MHC. The affinity of the TCR for MHC and preference for class I or class II determine thymocyte survival and co‐receptor expression. T cell development from entrance to the thymus to emigration as a mature T cell takes approximately three weeks in adult mice. T cell production peaks after adolescence in all higher vertebrates due to the generation of a suitably diverse repertoire. Subsequently, progressive thymus involution and declining T cell output occurs with increasing age.
The overall process is highly complex and stringently regulated both genetically, and spatially due to the importance of producing a diverse but tolerant TCR repertoire.
Figure 1.2 summarises the progression of T cell development in the mouse thymus in terms of developmental stages, cell surface markers, stages of proliferation in the context of the time and spatial occurrence of development.
Haematopoietic stem cells (HSC) that populate the bone marrow (BM) ultimately give rise to early T cell progenitors (ETP) directly, or indirectly through a second lineage negative intermediate called non‐renewing myeloid‐lymphoid progenitors (MLP; Morisson et al, 1995 and Adolfson et al, 2005). For an extensive review of HSC mobilisation and homing to the thymus see Schwarz and Bahndoola (Schwartz and Bahndoola, 2006). Briefly, HSC are retained within specialised BM niches by adhesion molecules including N‐cadherin and the integrin VLA‐4 (Williams et al, 1991; Papayannopoulou et al, 1995 and Zhang et al, 2005) and chemokines including chemokine C‐X‐C motif ligand (CXCL) 12 and its receptor chemokine C‐X‐C motif receptor (CXCR) 4 (reviewed by Lapidot and Petit, 2002). It is unclear whether release from the BM is a stochastic, cyclical or a continuous process, however proliferation of HSC is related to subsequent release from the BM, via the effects of factors such as CD135, IL‐3, IL‐6 and granulocyte stem cell factor (G‐SCF) which mediate HSC proliferation and induce BM release (Lapidot and Petit, 2002). Circulating HSCs are likely to migrate selectively into the thymus. Again the CXCR4 interaction is vital to HSC adhesion to thymic stromal tissue at the cortico‐medullary junction (Scimone et al, 2006). Entry and survival in the thymus marks the loss of pluripotency and the first step towards T cell commitment. However some studies suggest differences exist before entry to the thymus, which can distinguish ETPs from other HSC lineages (Schlenner et al, 2010).
Figure 1. 2: Summary of T cell development in the thymus.
Diagram represents the progression of T cell development from left to right, highlighting the key cell types (HSC = Haematopoietic stem cell; DN = Double negative; iSP = Immature single positive; DP = Double positive; SP = Single positive; nTreg = Natural regulatory T cell; NK = Natural killer cells; DC = Dendritic cells), key developmental events, the relative time to progress through each stage of development, key cell markers, the relative proliferation and the estimated number of cells generated from each HSC that enters the thymus. CM = Cortico-medullary junction; SCZ = Sub-capsular zone and X refers to cell apoptosis which contributes to the decrease in relative proliferation at the DN3 and selection phases of development.
1.2.2 Early development and commitment to the αβ lineage
After entry to the thymus, T cell progenitors are named according to characteristic cell surface markers –with major subsets divided based on expression of the CD4 and CD8 co‐receptors, named double negative (DN; CD4‐CD8‐), double positive (DP; CD4+CD8+)
and single positive (SP; CD4+ or CD8+). DN thymocytes migrate outwardly from the
cortico‐medullary boundary through the cortex via signals from cortical thymic epithelial cells (cTECs) expressing P‐selectin ligand‐1 (PSGL‐1) that binds to P‐selectin expressed on DN thymocytes (Rossi et al, 2005). DN cells progress towards the sub‐ capsular zone (SCZ) at the periphery of the cortex through changing cTEC chemokines and adhesion molecules including the aforementioned CXCR4 and C‐C chemokine receptor 7 (CCR7; Misslitz et al, 2004). The first two of four DN stages (DN1 and DN2)
!"# $%&'()* CD44+ CD25- CD24/cKit $%+ $%, !" $%- '."/ $/ "/ #$-012*3 ''#$4 DN1a DN1b %5 $#
10 days 2 days 5-7 days
CD44+ CD25+ CD44- CD25+ CD44- CD25- CD8 CD8 CD4 TCR #$4 #$$# TCR pT
TCR Rearrangement TCR Rearrangement + Selection - Selection CD8/ CD4
TCR
1 1x10⁶ 3x10⁵
CM Junction Cortex SCZ Cortex Medulla
Thymus compartment Time
Cell Type Key Cell Markers
Key Events Relative Proliferation No. Cells/HSC Lineage Commitment 6 6