Working memory, processing speed and set-shifting in children with Developmental Coordination Disorder and Attention Deficit Hyperactivity Disorder.
Jan P. Piek, BSc(Hons), PhD; Professor of Developmental Psychology, School of
Psychology, Curtin University of Technology, Western Australia
Murray J. Dyck, BA(Hons), MA, PhD; Professor of Clinical Psychology, School of
Psychology, Griffith University, Queensland, Australia
Mona Francis, BSc(Hons), MPsych (Clinical). Alistair Conwell, BSc(Hons)
Corresponding author: Professor Jan Piek School of Psychology
Curtin University of Technology GPO Box U1987
Perth 6845
Western Australia Fax: +618 9266 2464 Email: [email protected]
Summary
Aims: It has been suggested that the high levels of comorbidity between attention deficit
hyperactivity disorder (ADHD) and developmental coordination disorder (DCD) may be attributed to a common underlying neurocognitive mechanism. This study assesses whether children with DCD and ADHD share deficits on tasks measuring working memory, set-shifting and processing speed.
Method: 195 children aged between 6 years 6 months and 14 years 1 month were included in
this study. A control group (59 boys and 79 girls), a DCD group (12 boys and 6 girls), an ADHD-inattentive group (16 boys and 4 girls) and an ADHD-combined group (15 boys and 4 girls), were tested on three executive functioning tasks.
Results: Children with DCD were significantly slower on all tasks, supporting past evidence
of a timing deficit in these children. With few exceptions, children with ADHD did not perform more poorly than control children.
Conclusion: These findings demonstrate the importance of identifying children with motor
deficits when examining tasks involving a timing component.
Executive functioning has been extensively examined in children with attention deficit hyperactivity disorder (ADHD) and disrupted executive functioning has been implicated as a cause of ADHD1. However, as Oosterlaan, Scheres and Sergeant2 note, ADHD is often
comorbid with other disorders, and there is very little research on executive functioning deficits in these disorders. For example, in around 50% of cases, children with ADHD have been diagnosed with comorbid developmental coordination disorder (DCD)3, but few studies have examined executive functioning in children with DCD. It may be that a common underlying neurocognitive mechanism such as executive functioning may be responsible for comorbidity between children with ADHD and DCD.
The DSM-IV4 defines ADHD as “a persistent pattern of inattention and/ or hyperactivity-impulsivity that is more frequently displayed and more severe than is typically observed in individuals at a comparable level of development” (p. 85). The current version of the DSM-IV describes three subtypes of ADHD, predominantly inattentive (ADHD-PI), predominantly hyperactive-impulsive (ADHD-HI), and combined (ADHD-C). A number of executive functioning deficits have been identified in children with ADHD. Houghton et al.5 identified deficits in inhibition, planning and set-shifting in children with ADHD-PI and ADHD-C, and found no significant differences between these two subtypes. A similar result was found by Chhabildas, Pennington and Willcutt6 who examined processing speed, vigilance and inhibition in all three sub-types. They found that children with ADHD-PI and ADHD-C were impaired on all measures and produced similar profiles, whereas ADHD-HI performance did not differ from controls, and concluded that symptoms of inattention, not hyperactivity/impulsivity, accounted for the deficits in executive performance.
The DSM-IV4 defines DCD as an impairment of motor coordination that interferes with an individual’s daily life and academic achievement, which has not resulted from an intellectual disability, a pervasive developmental disorder, or a general medical condition. The motor deficits have been attributed to perceptual problems such as poor visuospatial processing abilities, cross modal integration, and kinaesthetic processing7, and deficits in speed of performance8.
Recently, executive functioning was examined in children with movement difficulties9. Using a modified go/no-go task10, we found no evidence of poor response inhibition in children with DCD. However, a link was found between poor motor performance and poorer performance on tasks involving working memory. Although children with movement problems could accurately perform a trail-making/memory updating task11, they performed this task more slowly. It was suggested that this performance was related to a timing deficit, possibly due to a disruption in cerebellar function which has been implicated previously in children with DCD12.
As the term suggests, working memory retains information needed for a current activity or goal13. Baddeley developed a three component model of working memory13,14. It comprises a central executive linked with a phonological loop (a verbal storage system) responsible for speech-based information, and a visuo-spatial sketchpad (visual storage system) which utilizes visual images. As children with DCD have been identified with a deficit in visuo-spatial organization7 and, in particular, visual movement imagery15, it appears that poor visuo-spatial processing may be associated with poor working memory performance.
An important aspect of working memory is attention, as this is required to hold information in working memory as it is rehearsed. According to the Baddeley’s model14, the central
executive is more of an attentional system than are the other two storage components. It appears that it is this aspect of working memory that is affected in children with ADHD, particularly those with symptoms of inattention. This would account for the findings of Chhabildas et al.6 linking inattentive symptomatology to neuropsychological impairment.
The aim of the current study was to investigate the neuropsychological processes of working memory, set-shifting and processing speed in children with DCD or ADHD. Based on
Baddeley’s model14 and the findings of our earlier study9, children with ADHD were expected to produce more errors and perform more poorly than children with DCD due to a disruption in the central executive component that relates to an attentional system. Given the poor visuo-spatial ability of children with DCD, these children should be slower on the tasks but still be able to solve them. This is also based on findings of a strong relationship between visuo-spatial working memory component and perceptual speed16. Working memory was
investigated using a goal neglect task and a trail-making memory task. A visual inspection time task was included to investigate processing speed and set shifting, a process that has not previously been investigated in children with DCD.
Method
Participants
195 children aged between 6 years 6 months and 14 years 1 month (mean age = 10years 4 months) were involved in this study. There was one large group of 138 typically developing children who were recruited from 42 schools in the Perth metropolitan region. These schools represented the distribution of academic achievement within the state of Western Australia. There were also three diagnostic groups. All children in the ADHD groups were recruited
from schools whose records indicated that children had been previously diagnosed by
paediatricians who were managing their current treatment. The children in the DCD group had been previously diagnosed by staff in the professional agencies from which these children were recruited, or identified by special education teachers (recruited from primary schools) as meeting the DSM-IV criteria for DCD. Diagnoses were confirmed in all children prior to testing. Children who obtained a score of less than 17 on the SWAN17 inattentive scale were assigned to the ADHD-PI group (n=20), and children who scored less than 17 on both the hyperactive/impulsive and inattentive scales were assigned to the ADHD-C group (n=19). Children were assigned to the DCD group (n = 18 if they scored below the fifth percentile on the MABC18, indicating the presence of motor problems. No comorbid conditions were identified in any of the groups. In the ADHD-PI group, there were 9 children on
dexamphetamine, 6 on methylphenidate, and 5 who were not on any medication. In the ADHD-C group, 10 were on dexamphetamine, 7 on methylphenidate, and 3 unmedicated. Parents were requested to withhold medication, which allowed a washout period of at least 18 hours, consistent with previous research 2.
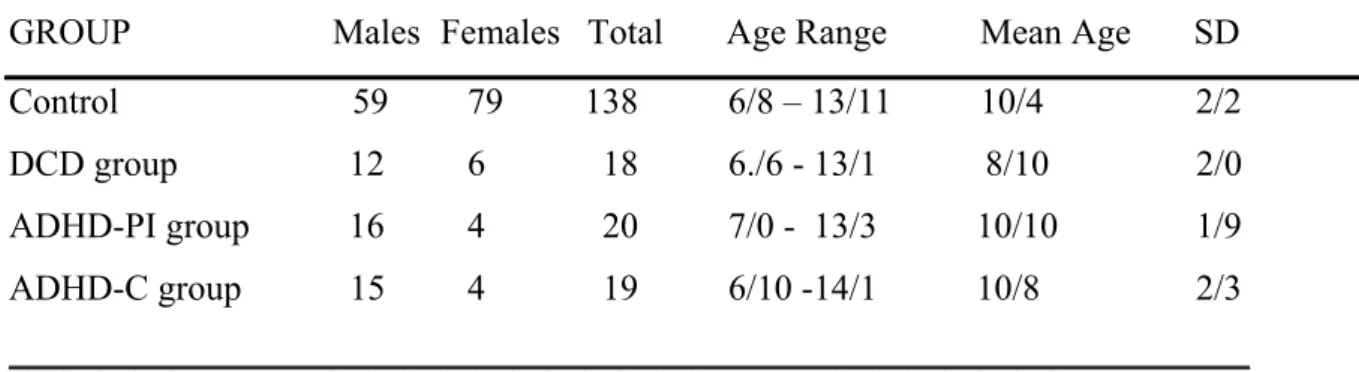
The number of children of each sex in each group, and their mean, standard deviation and range of age are provided in Table 1A. Univariate ANOVA tested indicated that there were significant age differences between groups, F(3,191)= 3.757, p=.012. Pairwise comparisons showed that the DCD group was younger than the other 3 groups (p<.05).
Insert table 1 about here
Prorated Full IQ scores based on 4 subtests of the WISC-III are shown in Table 1B. Children who had an estimated Full IQ below 80 were excluded from the study. A univariate ANOVA tested showed that there were significant group differences, F(3,191) = 9.95, p=.000004.
Pairwise comparisons found that IQ for the control group was significantly higher than for each of the other three groups. No other group differences were found.
Executive Function Measures
The Goal Neglect Task (GNT19) assesses the ability of children to devise and react to goal-directed plans. The participant, after learning and understanding a task, is required to ignore this previously learnt task to enable an alternative goal to be accomplished. The task consists of multiple presentations of pairs of numbers or letters on the right and left of a set ‘fixation point’ on the computer screen. Participants are initially requested to verbally identify the stimuli presented on either the left or right of the fixation point. Trials are either ‘switch’ trials (indicated by a ‘+’ symbol) requiring the participant to start reading stimuli presented on the opposite side of the computer screen, or ‘stay’ trials (indicated by a ‘-’ symbol) signalling that the participant is to continue reading stimuli from the current side19. Six ‘stay’ and six ‘switch’ trials are presented during the task, consisting of ten pairs of stimuli, followed by a ‘+’ or ‘-’ symbol, followed by the presentation of three additional pairs of stimuli. To pass a trial, the participant must identify more stimuli presented on the ‘correct’ side, both before and after the presentation of the switch/stay symbol, than those on the incorrect side 19. The number of correct trials (out of a possible 12) is recorded.
The Trailmaking/Memory Updating Task (TMUT) is a simplified version of that of Rabbit11, and assesses behavioural inhibition and working memory. This task consists of the
presentation of a ‘target set’ (i.e., the letters A, B, C, and, D), with the actual ‘target’
presented being an ordered rotation of these four letters (i.e., ‘A’ presented first, followed by ‘B’, then ‘C’, then ‘D’, then back to ‘A’ again). Participants must differentiate if a) the letter presented on the computer screen is a member of the ‘target set’ (i.e., A, B, C, or D) and b) if it is the current ‘target’ (e.g., ‘B’ if ‘A’ has just previously been presented). Participants are
required to complete two trials comprised of 120 stimulus presentations, including 20 presentations of the ‘target’ stimuli, and respond by pressing the blue button when ‘target’ stimuli are presented and the red button for all other stimulus presentations9. Scores include the mean time (MN), standard deviation (SD) and the number correct out of 20 (NC).
The Visual inspection time (VIT) task is a line-length discrimination task designed to assess visual inspection time20, that is, the shortest exposure time required by a participant in order to correctly discriminate the stimulus21. It requires the child to press, as quickly as possible, a blue key if two lines are the same length, and to press a red key if they differ in length. The task comprises 120 stimulus presentations, and there were two trials (CRT1 and CRT2). In the second trial the set-shift trial, commands are reversed as the child needs to press a blue key if the two lines are different and the red key if they are the same length. This task yields four scores for each trial: VIT, the reaction time to correct responses only (RTcr), and the reaction time to incorrect responses (RTicr). Longer latencies are anticipated in the second trial as a result of the ‘switch cost’22.
Screening Measures
Full IQ was estimated using the Vocabulary, Information, Block Design and Picture Completion subtests of the Wechsler Intelligence Scale for Children (WISC-III 23). The WISC-III has demonstrated adequate internal validity, for all of the utilised subtests (Information r = .84, Vocabulary r = .86, Picture Completion r = .77, and Block Design r = .87) exhibiting high reliability coefficients for this age group23.
Strengths and Weakness of the ADHD-symptoms and Normal-behavior (SWAN) Scale assesses the presence of ADHD symptoms of hyperactivity/impulsivity and inattention in the
general population17. The scale consists of 18 items derived from the re-wording of ADHD inattentive and hyperactive/impulsive symptoms from categorical items listed in the DSM-IV into dimensional questions (e.g., “Does this child often fail to give close attention to detail and make careless mistakes?”). Items are scored on a 7-point scale from –3 (‘Far above average’) to +3 (‘Far below average’) thereby being representative of variations in the general
population17. Factor analyses carried out by Swanson et al (2002) found that the 18 items of the SWAN load on two factors reflecting ADHD DSM-IV criteria, namely inattentive and hyperactive/impulsive symptoms, which account for 87.87% of the variance. The SWAN rating scale has been found to accurately identify the bottom 5% of extreme cases, specifically those that meet the diagnostic criteria for the three ADHD subtypes17.
The Movement Assessment Battery for Children18 is a standardised measure of motor
functioning commonly used to identify motor problems in children age 4-12+ years. This test measures three aspects of motor control, namely ball skills (two tests), manual dexterity (three tests), and static and dynamic balance (three tests). Children who score below the 5th
percentile are identified as having motor coordination problems, with those scoring below the 15th percentile identified as at risk of having motor problems18. The averaged percentage agreement scores for the three age bands (tested two weeks apart) were 97%, 91%, and 73% respectively. The validity of the MABC was determined through comparison with the Bruininks-Oseretsky Test that measures motor control within normal ranges18.
Procedure
This project was approved by the Human Research Ethics Committee at Curtin University of Technology, and adheres to the ethical guidelines set out by the National Health and Medical Research Council of Australia. Written consent was obtained from all parents, and verbal
consent from all participants prior to testing. Assessment of participants was conducted in two different ways. Children in the control group aged 7 to 12 years were assessed through
‘Project KIDS’ (a complete day of testing conducted at the University of Western Australia’s
Child Study Centre) while control children aged 6 or 12 to 14 years were assessed at their primary or secondary school. Further details of this sample can be found in Dyck et al.24.
Children in the ADHD groups were recruited from schools via principals forwarding project information to parents of students with a known diagnosis of ADHD. They were then assessed with the SWAN Rating Scale and assigned to either the ADHD-PI or ADHD-C based on their scores on the inattentive and hyperactive/impulsive scales of this measure. Children in the DCD group were recruited from school teacher and occupational therapist referrals, and the MABC was administered.
All executive functioning measures were computer generated. All participants were individually assessed on all measures which were randomly presented.
Results
SPSS 11.5 for Windows was used for all analyses. All assumptions for ANCOVA and MANCOVA were tested and were not violated.
GNT
A univariate ANCOVA was used to examine the group differences on the GNT. As the scores were found to significantly correlate with age (r=.626, p<.001) and full IQ (r=.313, p<.001), but not sex, these variables were covaried. There was a significant group effect,
(M=4.67, SD=3.50) produced significantly less successful trials than the control (M=8.56, SD=2.97; p=.002), ADHD(I) (M=8.85, SD=3.13: p=.002), and ADHD(C) (M=8.37, SD=3.19: p=.014) groups, which did not differ significantly from one another.
TMUT
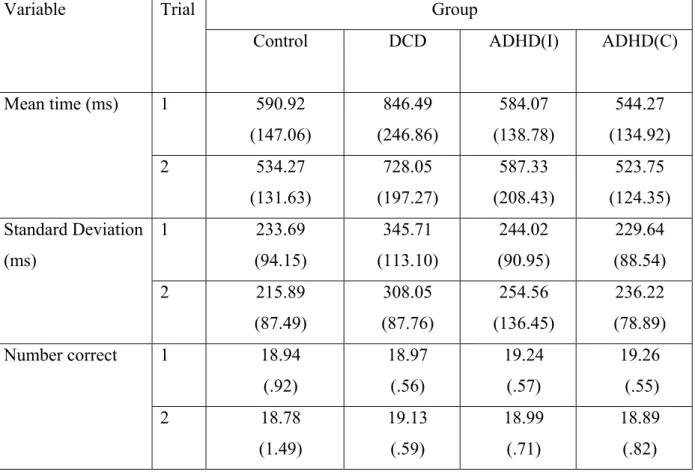
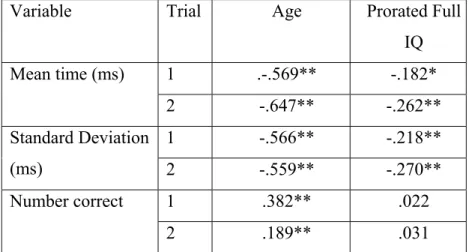
Means and standard deviations for each of the TMUT variables are given in Table 2. As these variables correlated with age and IQ (see table 3), a repeated measures (2 trials) MANCOVA, with covariates of age and prorated full IQ score, was used to assess whether the groups differed on the TMUT measures. The results indicated that the groups differed on the linear combination of variables (F(9,567) = 3.75, p = .0002,μ2=.056). No significant trial or trial x group interactions were found. Analysis of the univariate tests revealed significant group differences for MN (F(3,189)=8.101, p=.00004, μ2=.114), SD (F(3,189)=3.508, p=.016, μ2=.053), but not NC (F(3,189)=1.749, p=.159, μ2=.027). Pairwise comparisons revealed that for MN, the DCD group was significantly longer than all other groups (p<.01). For SD, the DCD group was significantly larger than all groups (p<.05) except ADHD(I) which did not differ from any of the groups.
Insert tables 2 and 3 about here VIT
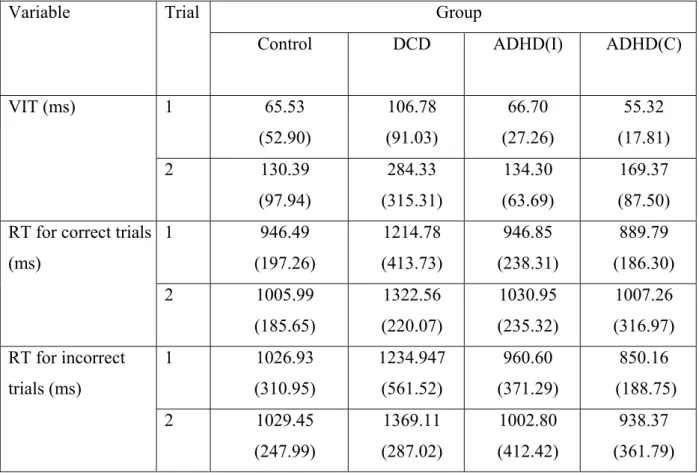
Means and standard deviations for measures on the VIT task for the four groups are given in Table 4. As age and IQ were found to correlate with these variables (see table 5), a repeated measure (2 trials) MANCOVA, with covariates of age and prorated full IQ score, was used to assess whether the groups differed on this task. The results indicated that the groups differed on the linear combination of variables, F(9,564) = 4.748, p = .000003,
μ2=.070. There was also a significant trials effect, F(3,186) =7.446, p = .000003, μ2=.107, but no group x trials interaction, F(9,564) = 1.278, p = .246, μ2=.020. Analysis of the univariate
tests revealed significant group differences for VIT (F(3,188)=3.806, p=.011, μ2=.057), RTcr (F(3,188)=7.499, p=.00009, μ2=.107), and RTicr (F(3,188)=4.878, p=.003, μ2=.072). Pairwise comparisons revealed that for all of these measures, the DCD group was significantly slower than the other groups. Also, for the RTicr, the ADHD (C) group was significantly faster than the control group. For the trials, the VIT was significantly faster in trial 1 than trial 2 as would be expected F(1,188)=22.182, p=.000005, μ2=.106).
Insert tables 4 and 5 about here
It could be argued that the differences found between groups for the RT measures were the result of the VIT difference which is a component of the RT. That is, the additional time to produce the motor response did not differ between groups. In order to investigate this, two additional MANCOVAs were conducted (one for each trial) where RTcr and RTicr were examined with VIT as a covariate (along with FIQ and age). A significant group effect
remained for both trial 1, F(6,376) = 2.965, p = .008), and trial 2, F(6,376) = 4.773, p = .0001. Pairwise comparisons revealed that the DCD group was significantly slower on both trials than the other groups for RTcr when VIT was used as a covariate. No other significant pairwise differences were found.
Discussion
Several aspects of executive functioning were investigated in children with either DCD or ADHD using a number of well recognised measures of executive functioning. Children with DCD performed significantly poorer than the control and the ADHD groups on all three tasks examined. The performance deficits of children with DCD were of the same magnitude as their motor skills deficits: 94.9% of typical and DCD children can be accurately classified in discriminant function analyses using fine and gross motor skills scores, while 94.2% are accurately classified using VIT and TMUT scores.
For the GNT, children with DCD had significantly less correct responses. This does not support our previous study which found no significant difference between control and DCD children on the GNT9. However, it should be noted that a sample of children ‘at-risk’ of DCD were included in the earlier paper rather than children identified with DCD (in the 5th
percentile of the MABC) in the current study.
The trail-making memory task is considered to measure both working memory as well as response inhibition11. We found that children with DCD were slower on both trials and had greater variability on both, but produced no more errors than other groups. This supports our earlier study investigating children at risk of DCD9. We argued that the poorer speed of performance and variability are linked to the overall timing deficit found in children with DCD. In terms of Baddeley’s model, we would argue that because of their poorer visuo-spatial ability they require longer to process the information initially but can then successfully perform the task.
In the current study, children with DCD had slower VITs and produced slower RTs to both correct and incorrect responses. Discriminating between two line lengths requires accurate visual-spatial processing. Previous studies have identified that poor visual-spatial processing is a deficit associated with DCD7, but not necessarily ADHD25. In contrast, slower processing speed has been found in children with DCD7 and ADHD1, and it is therefore surprising that children with ADHD did not perform more poorly on the VIT task. However, evidence has emerged that when motor ability is taken into account in children with ADHD, the processing deficit is less evident26. As expected, VIT was significantly longer on the second trial compared with the first. This was expected as the second trial was the set-shifting trial.
In examining the VIT task, we were also interested in whether the slower RT for the children with DCD was a result of processing or also the motor response to the button press, which has been implicated as the cause of RT delays in children with DCD. That is, slower processing speed in children with DCD has been attributed to a deficit in the central timing mechanisms12 as well as output deficits associated with motor execution8. In the current study, when VIT was covaried, the significant differences remained for RT to the correct responses suggesting that they made a slower response as well as taking longer to discriminate the stimulus when the task became more complex.
A further finding was that children with ADHD(C) were significantly faster than control
children with their RT to an incorrect response. When these children make an error it appears to be because they react too quickly, possibly due to their hyperactive/impulsive nature. It should be pointed out, however, that there were no significant differences between this group and the other groups of children with a disorder.
Apart from the finding presented above, children with ADHD did not perform more poorly than control children on the tasks. These tasks incorporate executive functioning domains of
working memory, set-shifting, processing speed and goal directed planning. This is surprising given the large body of evidence suggesting that these processes are disrupted in children with ADHD. It is possible that medication may have been a factor and the wash-out period was not sufficient to suppress the effect of the medication. However, given that children were not medicated during testing, it is unlikely that this was a major factor. Sergeant et al.27 suggested that the inconsistent findings for executive functioning deficits in ADHD may reflect sample differences, in particular, whether the sample has comorbid conditions. Given the findings in relation to DCD, it is possible that some of the inconsistency may relate to comorbid DCD
which has not been identified in previous studies. The other explanation is the different paradigms used to investigate executive functioning, and the problem of process specificity27. Few tasks allow specific cognitive processes to be tested. In the current study, for example, all three tasks examined several different components of executive functioning.
In conclusion, the current study supports the previous literature arguing for a processing deficit in children with DCD which is most likely linked to cerebellar dysfunction12. The lack of significant findings for the children with ADHD suggests the need to examine executive function in ADHD in relation to other comorbid conditions.
Acknowledgments
This study was supported by grants from the National Health and Medical Research Council of Australia and the Research Centre for Applied Psychology, Curtin University of
Technology. We would like to thank the principals and staff of participating schools and clinics for their cooperation, Mike Anderson for providing access to Project KIDS, and the participating children and parents who made this study possible.
REFERENCES
1. Pennington, B. F., & Ozonoff, S. (1996). Executive functions and developmental psychopathology. Journal of Child Psychology and Psychiatry, 37, 51-87.
2. Oosterlaan, J., Scheres, A., & Sergeant, J.A. (2005). Which executive functioning deficits are associated with AD/HD, ODD/CD and comorbid AD/HD+ODD/CD? Journal of Abnormal Child Psychology, 33, 69-85.
3. Pitcher, T. M., Piek, J. P., & Hay, D. (2003). Fine and gross motor ability in males with ADHD. Developmental Medicine & Child Neurology, 45, 525-535.
4. American Psychiatric Association. (2000). Diagnostic and statistical manual of mental disorders: DSM-IV-TR (4th ed.). Washington, DC: American Psychiatric Association.
5. Houghton, S., Douglas, G., West, J., Whiting, K., Wall, M., Langsford, S., Powell, L., & carroll, A. (1999). Differential patterns of executive function in children with attention-deficit hyperactivity disorder according to gender and subtype. Journal of Child Neurology, 14, 801-805.
6. Chhabildas, N., Pennington, B. F., & Willcutt, E. G. (2001). A comparison of the
neuropsychological profiles of the DSM-IV subtypes of ADHD. Journal of Abnormal Child Psychology, 29(6), 529-540.
7. Wilson, P. H., & McKenzie, B. E. (1998). Information processing deficits associated with developmental coordination disorder: A meta-analysis of research findings. Journal of Child Psychology and Psychiatry, 39(6), 829-840.
8. Piek, J.P. & Skinner, R.A. (1999). Timing and force control during a sequential tapping task in children with and without motor coordination problems. Journal of the International Neuropsychological Society, 5, 320-329.
9. Piek, J.P., Dyck, M.J., Nieman, A., Anderson, M., Hay, D., Smith, L.M., McCoy, M., & Hallmayer, J. (2004). The relationship between motor coordination, executive functioning and attention in school aged children. Archives of Clinical
Neuropsychology, 19, 1063-1076.
10. Shue, K., & Douglas, V. (1992). Attention deficit hyperactivity disorder and the frontal lobe syndrome. Brain and Cognition, 20, 104-124.
11. Rabbit, P. (1997). Methodology of frontal and executive function. East Sussex, UK:
Psychology Press.
12. Lundy-Ekman, L., Ivry, R., Keele, S. W., & Woollacott, M. (1991). Timing and force control deficits in clumsy children. Journal of Cognitive Neuroscience, 3, 367-376.
13. Johnson, A., & Proctor, R.W. (2004). Attention: Theory and Practice. Thousand Oaks,
CA: Sage.
14. Baddeley, A. (2003). Working memory: Looking back and looking forward. Nature Reviews: Neuroscience, 4, 829-839.
15. Wilson, P.H., Maruff, P., Ives, S., & Currie, J. (2001). Abnormalities of motor and praxis imagery in children with developmental coordination disorder. Human Movement Science, 20, 135-159.
16. Miyake, A., Friedman, N.P., Rettinger, D.A., Shah, P., & Hegarty, M. (2001).How are visuospatial working memory, executive functioning, and spatial abilities related? A latent-variable analysis. Journal of Experimental Psychology: General, 130, 621-640.
17. Swanson, J., Schuck, S., Mann, M., Carlson, C. L., Hartman, K., Sergeant, J. A., Clevender, W., Wasdell, M., & McCleary, R. (2002). Categorical and dimensional definitions and evaluations of symptoms of ADHD: The SNAP and the SWAN rating scales. Retrieved April 30, 2004, from www.adhd.net.
18. Henderson, S. E., & Sugden, D. A. (1992). Movement assessment battery for children.
UK: The Psychological Corporation.
19. Duncan, J., Emslie, H., & Williams, P. (1996). Intelligence and the frontal lobes: The organization of goal-directed behavior. Cognitive Psychology, 30, 257-303.
20. Anderson, M. (1988). Inspection time, information processing and the development of intelligence. British Journal of Developmental Psychology, 6, 43-57.
21. Jensen, A.R. (2000). Processing speed, inspection time, and nerve conduction velocity.
Psycoloquy, 11, #19.
22. Collette, F. & van der Linden, M. (2002). Brain imaging of the central executive component of working memory. Neuroscience and Biobehavioral Reviews, 26,
23. Wechsler, D. (1991). The Wechsler intelligence scale for children (3rd ed.). San Antonio:
The Psychological Corporation.
24. Dyck, M., Hay, D., Anderson, M., Smith, L. M., Piek, J. P., & Hallmayer, J. (2004). Is the discrepancy criterion for defining developmental disorders valid? Journal of Child Psychology and Psychiatry, 45, 979-995.
25. Piek, J. P., & Pitcher, T. M. (2004). Processing deficits in children with movement and attention problems. In D. Dewey & D. E. Tupper (Eds.), Developmental motor disorders: A neuropsychological perspective. New York: Guilford.
26. Pitcher, T. M., Piek, J. P., & Barrett, N. C. (2002). Timing and force control in boys with attention deficit hyperactivity disorder: Subtype differences and the effect of comorbid developmental coordination disorder. Human Movement Science, 21, 919-945
27. Sergeant, J. A., Geurts, H., & Oosterlaan, J. (2002). How specific is a deficit of executive functioning for attention-deficit/ hyperactivity disorder? Behavioural Brain Research, 130, 3-28.
Table Legends
Table 1. Demographic details for each group. A. Number of boys and girls, and age mean, standard deviation and range (in years/months) for each group, and B). Full IQ for each group
Table 2. Means (standard deviations) for the TMUT variables.
Table 3. Correlations between Age and Prorated Full IQ for the TMUT variables.
Table 4. Means (standard deviations) for VIT task
Table 1. Demographic details for each group.
A. Number of boys and girls, and age mean, standard deviation and range (in years/months) for each group
___________________________________________________________________________ GROUP Males Females Total Age Range Mean Age SD
Control 59 79 138 6/8 – 13/11 10/4 2/2 DCD group 12 6 18 6./6 - 13/1 8/10 2/0 ADHD-PI group 16 4 20 7/0 - 13/3 10/10 1/9 ADHD-C group 15 4 19 6/10 -14/1 10/8 2/3 _____________________________________________________________________
B. Full IQ score for each group
___________________________________________________________________________
GROUP Mean SD Range
Control 114.41 12.40 84-138 DCD group 101.39 14.59 80-127 ADHD-PI group 102.98 17.03 80-142 ADHD-C group 105.38 12.40 85-139
Table 2. Means (standard deviations) for the TMUT variables.
Group Variable Trial
Control DCD ADHD(I) ADHD(C)
1 590.92 (147.06) 846.49 (246.86) 584.07 (138.78) 544.27 (134.92) Mean time (ms) 2 534.27 (131.63) 728.05 (197.27) 587.33 (208.43) 523.75 (124.35) 1 233.69 (94.15) 345.71 (113.10) 244.02 (90.95) 229.64 (88.54) Standard Deviation (ms) 2 215.89 (87.49) 308.05 (87.76) 254.56 (136.45) 236.22 (78.89) 1 18.94 (.92) 18.97 (.56) 19.24 (.57) 19.26 (.55) Number correct 2 18.78 (1.49) 19.13 (.59) 18.99 (.71) 18.89 (.82)
Table 3. Correlations between Age and Prorated Full IQ for the TMUT variables.
Variable Trial Age Prorated Full
IQ 1 .-.569** -.182* Mean time (ms) 2 -.647** -.262** 1 -.566** -.218** Standard Deviation (ms) 2 -.559** -.270** 1 .382** .022 Number correct 2 .189** .031 * p<.05; ** p<.01
Table 4. Means (standard deviations) for VIT task
Group Variable Trial
Control DCD ADHD(I) ADHD(C)
1 65.53 (52.90) 106.78 (91.03) 66.70 (27.26) 55.32 (17.81) VIT (ms) 2 130.39 (97.94) 284.33 (315.31) 134.30 (63.69) 169.37 (87.50) 1 946.49 (197.26) 1214.78 (413.73) 946.85 (238.31) 889.79 (186.30) RT for correct trials
(ms) 2 1005.99 (185.65) 1322.56 (220.07) 1030.95 (235.32) 1007.26 (316.97) 1 1026.93 (310.95) 1234.947 (561.52) 960.60 (371.29) 850.16 (188.75) RT for incorrect trials (ms) 2 1029.45 (247.99) 1369.11 (287.02) 1002.80 (412.42) 938.37 (361.79)
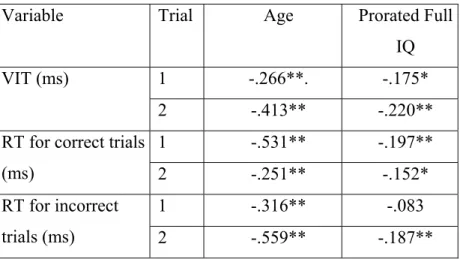
Table 5. Correlations between Age and Prorated Full IQ for the VIT variables.
Variable Trial Age Prorated Full
IQ
1 -.266**. -.175* VIT (ms)
2 -.413** -.220**
1 -.531** -.197**
RT for correct trials
(ms) 2 -.251** -.152*
1 -.316** -.083 RT for incorrect
trials (ms) 2 -.559** -.187**