Financial Analysis for Profitability Improvement
: A Case Study of a HMMA Supplier
Hwanyong Kim Troy University-Montgomery 136 Catoma Street, Montgomery, AL 36103
Haksoon Kim Troy University- Montgomery 136 Catoma Street, Montgomery, AL 36103
Jimmy Simpson Troy University-Montgomery 136 Catoma Street, Montgomery, AL 36103
Abstract
This paper discusses improving profitability by a Hyundai Motor Manufacturing America (HMMA) supplier company by reducing labor cost through restructuring process. PA, one of suppliers of HMMA, had suffered from business loss after initiated business in the US. The company has restructured its business process. The company’s business reengineering efforts has resulted in reducing the number of employees and impacted on financial statement. We hypothesize that business process reengineering is the key factor in saving labor cost and labor cost reduction is effective in improving profitability of PA. We explore the company’s profitability improving efforts through business process reengineering and show the result of the efforts with financial ratio analysis, correlation analysis, and regression analysis.
INTRODUCTION
PA is one of suppliers of Hyundai Motor Manufacturing America (HMMA). PA Korea, the head company, opened this oversea branch in 2010 by purchasing an existing manufacturing company. This branch had suffered from business loss in the first couple of years. The top management of the company started restructuring by business process reengineering in 2011. One of the notable results of business process reengineering was change in the number of employees. The total number of employees was 182, when the company initiated the business in the US. This figure has been reduced up to 134 sometimes.
Generally, manufacturing companies can improve profitability by reducing the material or part cost, operations cost, labor cost, and other cost or by raising price of their product. PA doesn’t have barging power either as a customer or as a supplier. PA is one of the first tier venders of Hyundai Motor Manufacturing America. The company is a supplier to Hyundai and also a customer to the second tier venders. PA doesn’t have authorization to negotiate price to its suppliers because it is a branch of its head company, PA Korea. The head company negotiates price with its suppliers. PA receives parts and materials from the second tier suppliers at the price decided by the head company. With this reason, PA can’t reduce the cost of goods sold by reducing part or material cost. Table 1 shows the percentage of part and material cost in the total cost of goods sold and in the total income. Percentage of part and material cost in the total cost has increased continuously. However, it is not because of increasing part and material cost. Because labor cost percentage has decreased, percentage of part and material cost to the total cost of goods sold has increased relatively. Percentage of part and material in the total income has changed, but not much different except from 2010 to 2011. This table indicates that part and material cost has not changed and not affected the company’s profitability.
Table 1: Part and material cost ratio
Year 2010 2011 2012 2013 2014
Percentage of part and material cost in the total cost of goods sold 80.63% 82.28% 83.62% 84.87% 85.76% Percentage of part and material cost in the total income 83.84% 81.22% 80.59% 80.15% 79.66%
diversifying customers. However, it is unwritten law that suppliers of Hyundai can be only suppliers of Hyundai or its sister company, Kia. Even they are not tied down by contract. 80% of total sales of all suppliers from Hyundai and Kia. Sales of PA is highly dependent on Hyundai’s sales.
The strategic costing program accounts for the impact of cost decisions not only on an organization's internal environment, but on its external environment as well (Buckingham and Loomba, 2001). Because of the above internal and external environments and limitations, the only feasible option to improve profitability for PA was saving labor cost by reducing the number of employees. When the number of employees was 182, the labor cost was 8.38% of the total cost of goods sold. Table 2 shows the percentage of labor cost in the total cost of goods sold changes based on the average number of total employee each year. The percentage of labor cost has decreased. This change in the number of employees has resulted in improving profitability of the company and changing the company’s net income from negative to positive in 2013. In 2014, the employee count increased again in order to deal with Hyundai Motor Manufacturing America launched a new model for 2015 and its sales increasing.
Table 2: The number of employee and Labor cost ratio
Year 2010 2011 2012 2013 2014
The average number of employee 182 156 145 140 150
Percentage of labor cost in the total cost of goods sold 8.38% 7.40% 6.54% 6.33% 6.51%
BUSINESS PROCESS REENGINEERING,COST REDUCTION AND PROFITABILITY
Business process reengineering was first defined by Michael Hammer in 1990. However, there is no universal definition of BPR. Many researchers has defined BPR. Business Process Reengineering is the fundamental re-thinking and radical redesign of business processes to achieve dramatic improvements on critical measures of performance (Chang and Powell, 1998). Business Reengineering Implementation can be characterized as the implementation of deliberate and fundamental change in business processes to achieve breakthrough improvements in performance (Grover et al., 1995). Reengineering is a radical or breakthrough change in a business process. Reengineered process designs seek dramatic orders of magnitude, as distinguished from incremental, improvement in business value. Key value creation processes involving manufacturing operations include order fulfillment, product development, order creation, and customer service. Organizations change in reaction to changes in their environments, but radical changes are seldom attempted (Dixon et al 1994). Reengineering has allowed executives to see through the surface structure of their organizations to the underlying purpose such as the delivery of value to customers in a way that creates profits for shareholders (Hammer and Stanton, 1999). The re-engineering stages attempt to find and remove duplicate/redundant steps and replace existing steps with more efficient ones, or replace sections of the existing process with single steps or sub-processes (Stelling et al., 2008). One of commonalities in reengineered business processes suggested by Hammer and Champy (1993) is simplifying tasks by combining several tasks into one. Processes should be the least cost to maintain, but still deliver the required value (Hall, 2006). Costs are often referred to as direct costs, cost of sales or variable costs. In a competitive market, one of the very best ways to achieve profit is through tight cost controls especially labor cost (Hirst, 2012).The cost reduction process begins with gathering
information about direct production costs, indirect labor costs, and opportunities for downsizing, which
management and industrial engineers use creatively to define where cost reduction can be implemented
level of sales, a certain level of assets, or the owners’ investment. A popular tool for evaluation profitability in relation to sales is to income statement (Gitman, 2009). The factors behind many companies rebound from crisis are reduction in unit labor costs and improving profitability and competitiveness (Bernier et al., 2001).
DISCUSSION AND CONCLUSION
At the end of 2011 the year of PA taking over an existing company, net income of the company was negative. Management of the company needed something action for improving profitability and survive. There are several ways to improve profitability. General ways are cutting cost, raising price, and increasing sales. As mentioned earlier, because of external and internal environmental limitation and constrain, the only option for PA to improve profitability was cutting cost for survive. In cutting cost options, lowering part or material cost was not a feasible option, but lowering labor or operation cost is only option which PA could take. Improving labor efficiency or productivity and reducing the number of employees could be methods for lowering labor cost. Many companies chose cutting labor force for cost reduction. A generic drug manufacturer Teva Pharmaceutical Industries cut nearly 5,000 jobs, which accounts for 10% of its labor force, by 2014 as part of its cost reduction plan and process and structure optimization. Intersil, a manufacturer of power management and precision analog integrated circuits, reduced its workforce by 11% as part of a cost reduction program in 2012. One of the proposals for returning USAir to profitability was reduction of labor costs. Also, in 2004, Ford Motor Co. said it would trim $1,000 in production costs from each redesigned F-150. Ford said the savings came from engineering improvements and reductions in material, labor and logistical costs. PA conducted time study and redefining job descriptions. Based on the study, the company can reengineered its process by including: combining multiple processes into one, eliminating redundant process, making complicated processes simple, and so on. With process reengineering, the company could cut up to 41 labor force in 2011. It was 22.5% of its total employees. It is difficult task to cut existing labor force. According to CEOs of suppliers of Hyundai and Kia in Montgomery area, one of biggest challenges in automobile industry in this area is high turnover rate. The reasons of high turnover rate are lower average wage than other automobile industry cities such as Detroit, MI, poor living environment, and weather. This high turnover rate problem could be solution for PA to cut labor without many laying off. PA used the high turnover rate strategically. If there is vacancy, the company did not hire and reposition existing employee by training. Also, the company changed a temporary (contract) position to a permanent position. Table 3 shows percentage change in contract and permanent position. With this position status change, the company could use stable workforce strategy, stable production planning and scheduling, also reduce non production operations expense such as hiring cost, traveling cost, relocation cost, and so on.
Table 3: Position Status Change
Year 2010 2011 2012 2013 2014
Contract Position 47% 38% 25% 22% 32%
Permanent Position 53% 62% 75% 78% 68%
One of negative effects of reducing labor force is lowering product quality or service. However, product quality of PA has improved during process reengineering. Table 4 shows PPM (Problem per Million: Quality Index used by Hyundai Motors and its suppliers) improvement. It dropped dramatically from 2010 to 2011. In 2012 and 2013, this company achieved zero PPM. PA satisfied criteria and became a 5-star supplier of Hyundai Motor Manufacturing America since 2011. This improving quality or lowering defect rate appeared on the company’s financial statement. Warranty expense cost decreased because returning rate decreased.
Table 4: PA’s PPM Improvement (Lower means better quality)
Year 2010 2011 2012 2013 2014
PPM 284 14 0 0 45
Data Source: Hyundai Motor America Quality Control
Three frequently used ratios to measure profitability are the gross profit margin, the operation profit margin, and the net profit margin (Gitman 2009).
Table 5: Profitability Ratios
Year 2010 2011 2012 2013 2014
Gross Profit Margin -3.99% 1.29% 3.62% 5.56% 7.12%
Operating Profit Margin -7.13% -3.36% -1.30% 0.59% 2.67%
Net Profit Margin -7.13% -3.50% -0.96% 0.28% 1.81%
Gross Profit Margin can be indicator of showing how much labor reduction effect on improving the company’s profitability. As you can see from Table 1 and 2, cost of part and material has not changed and has not affected on Gross Profit Margin. This Gross Profit Margin change is wholly affected by labor reduction. Labor reduction improved the company’s cost structure and key factor to achieve positive profit. Operating Profit Margin and Net Profit Margin has been improved. This means the company’s process reengineering efforts affected reduction operations costs.
Table 6 Correlation Table
ROE ROA Labor Cost Average Cost
ROE 1
ROA 0.969456 1
Labor Cost -0.40188 -0.30938 1
Average Cost -0.27385 -0.20616 0.67479794 1
Table 6 shows the correlations among labor cost, average cost, return on assets and return on equity. Return on assets is calculated by dividing net income by total assets. Return on equity is calculated by dividing net income by total equity. Return on assets and return on equity are widely used profitability ratios.
There is a negative relationship between labor cost and return on assets (ROA). Also, there is a negative relationship between average cost and ROA. Also, there is a negative relationship between labor cost and return on equity (ROE). Finally, there is a negative relationship between average cost and return on equity (ROE). The negative correlations are higher when you use ROE than when you use ROA. The results are consistent with our prediction that decreasing labor or average cost will increase profitability.
Table 7: The Regression Results of ROA on Labor Cost - Dependent Variable: ROA
Regression Statistics Multiple R 0.309404753 R Square 0.095731301 Adjusted R Square 0.074701797 Standard Error 0.023890254
Observations 45
ANOVA
df SS MS F Significance F
Regression 1 0.002598163 0.002598 4.552238 0.038621507
Residual 43 0.024542001 0.000571
Total 44 0.027140164
Coefficients Standard Error t Stat P-value Lower 95% Upper 95%
Labor cost has a negative effect on ROA. The regression coefficient is statistically significant within five percent significance level (t-statistic=-2.1336; P-value=0.038622). Adjusted R-squared is 0.074701797. The regression results are consistent with our prediction and correlation results in Table 6.
Table 8: The Regression Results of ROA on Average Cost - Dependent Variable: ROA
Regression Statistics
Multiple R 0.267864767 R Square 0.071751534 Adjusted R Square 0.05016436 Standard Error 0.024204947 Observations 45
ANOVA
df SS MS F Significance F
Regression 1 0.001947348 0.001947 3.323804 0.075240594
Residual 43 0.025192816 0.000586
Total 44 0.027140164
Coefficients Standard Error t Stat P-value Lower 95% Upper 95%
Intercept 0.055407384 0.031999012 1.731534 0.090526 -0.009124774 0.119939543 Average Cost -1.54609E-05 8.4804E-06 -1.82313 0.075241 -3.25632E-05 1.64148E-06
Average cost has a negative effect on ROA. The regression coefficient is statistically significant within ten percent significance level (t-statistic=-1.82313; P-value=0.075241). Adjusted R-squared is 0.05016436. The regression results are consistent with our prediction and correlation results in Table 6.
Table 9: The Regression Results of ROE on Labor Cost - Dependent Variable: ROE
Regression Statistics Multiple R 0.40192985 R Square 0.161547604 Adjusted R Square 0.142048711 Standard Error 0.175859135 Observations 45
ANOVA
df SS MS F Significance F
Regression 1 0.256224369 0.256224 8.284963 0.006203555
Residual 43 1.32983672 0.030926
Total 44 1.586061089
Coefficients Standard Error t Stat P-value Lower 95% Upper 95%
Intercept 0.546465829 0.20147687 2.712301 0.009569 0.140148997 0.952782662 Labor Cost -1.04006E-06 3.61338E-07 -2.87836 0.006204 -1.76877E-06 -3.11354E-07
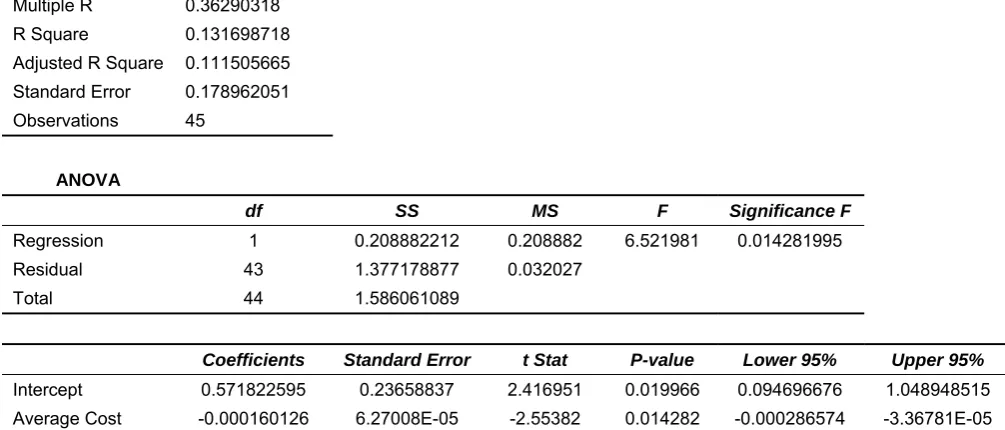
Table 10: The Regression Results of ROE on Average Cost - Dependent Variable: ROE
Regression Statistics Multiple R 0.36290318 R Square 0.131698718 Adjusted R Square 0.111505665 Standard Error 0.178962051 Observations 45
ANOVA
df SS MS F Significance F
Regression 1 0.208882212 0.208882 6.521981 0.014281995
Residual 43 1.377178877 0.032027
Total 44 1.586061089
Coefficients Standard Error t Stat P-value Lower 95% Upper 95%
Intercept 0.571822595 0.23658837 2.416951 0.019966 0.094696676 1.048948515 Average Cost -0.000160126 6.27008E-05 -2.55382 0.014282 -0.000286574 -3.36781E-05
Average cost has a negative effect on ROE. The regression coefficient is statistically significant within five percent significance level (t-statistic=-2.55382; P-value=0.014282). Adjusted R-squared is 0.111505665. The regression results are consistent with our prediction and correlation results in Table 6.
In 2010, PA started business as a supplier of Hyundai Motor America by assuming operations at an existing plant. In order to overcome business loss, the company restructured its business process and reduced the number of employee. This labor force reduction has impacted to cost structure of the company. Percentage of labor cost in the total cost of goods sold has decreased. It resulted in improving company’s profitability and mitigating business loss. This reduction in cost accompanied improvements in final product quality, resulting in a process that became more efficient and effective. Finally, this company has made positive profit since 2013.
Figures from table 1 to 5 support our hypothesis, business process reengineering is the key factor in saving labor cost. Also, all result of correlation analysis and regression analyses from table 6 to 10 support our other hypothesis, reduction labor cost effect on improving profitability of PA. We can conclude that PA’s profitability improving efforts through business process reengineering has been effective and successful.
REFERENCES
Bernard Bernier and Vincent Mirza, “Crisis and strategies of reduction of labor costs in Japanese companies,” Labour, Capital & Society, vol. 34, no. 2, pp. 146-165, 2001.
Matthew Buckingham and Arvinder Loomba, “Advantageous cost structure a strategic costing case study,” Production & Inventory Management Journal, vol. 42, no.1, pp. 12-18, 2001.
John A. Buzacott, “Commonalities in reengineered business processes: Models and issues,” Management Science, vol. 42, no. 5, pp. 768-783, 1996.
Lih-Jen Chang and Philip Powell, “Towards a framework for business process re-engineering in small and medium-sized enterprises,” Information Systems Journal, vol. 8, no. 3, pp. 199-215, 1998.
Karel Cool, Ingemar Dierickx, and David Jemison, “Business strategy, market structure and risk-return relationships: A structural approach,” Strategic Management Journal, vol. 10, no. 6, pp. 507-522, 1989.
Peter Coote, “Cost reduction,” Financial Management, pp. 47. Jul/Aug2008
Robb Dixon, Peter Arnold, Jandlle Heineke, Jay S. Kim, and Paul Mulligan, “Business process reengineering: improving in new strategic directions,” California Management Review, vol. 36, no. 4, pp. 93-108, 1994.
Michael K. Fung, “To what extent are labor-saving technologies improving efficiency in the use of human resources?: Evidence from the banking industry,” Production & Operations Management, vol. 17, no. 1, pp. 75-92, 2008. Franco Gandolfi, “Cost reductions, downsizing-related layoffs, and HR practices,” SAM Advanced Management Journal, vol.
73, no. 3, pp. 52-58, 2008.
Jennifer M. Gardner, “Planning for survival,” Monthly Labor Review, vol. 119, no. 8, pp. 64, 1996.
Lawrence Gitman, Principles of Managerial Finance, 5th edition, Pearson Prentice Hall, 2009
Zbigniew Gołaś and Scientiarum P. Acta, “SME sector economic position in the EU: Insights into labour efficiency and profitability,” Oeconomia, vol. 10, no. 3, pp. 25-38, 2011.
Varun Grover, Jeong S. R., William J. Kettinger, and James T. Teng, “The implementation of business process reengineering,” Journal of Management Information Systems, vol. 12, no. 1, pp. 109-144, 1995.
Varun Grover and William J. Kettinger, “The impacts of business process change on organizational performance,” Journal of Management Information Systems, vol. 14, no. 1, pp. 9-12, 1997.
Andrea J Hale and Paul B. Cragg, “Business process re-engineering in the small firm: A case study, INFOR, vol. 34, no. 1, pp. 15-27, 1996.
Jeff Hall, “Making business processes LEAN,” Management Services, vol. 50, no. 4, pp. 17-20, 2006.
Michael Hammer and Steven Stanton, “How process enterprises really work, “Harvard Business Review,” vol. 77, no. 6, pp. 108-118, 1999.
Sue Hirst, “Flatten costs to fatten profits,” NZ Business, vol. 26, no. 10, pp. 46-47, 2012.
Robin L. Lumsdaine, James H. Stock, and David A. Wise, “Efficient windows and labor force reduction,” Journal of Public Economics, vol. 43, no. 2, pp. 131-160, 1990.
Brian D. Neureuther and Paul F. Schikora, “Exploring labor reduction in complex manufacturing,” IEEE Transactions on Semiconductor Manufacturing, vol. 19, no. 4, pp. 487-495, 2006.
Bruce Payne, “A program for cost reduction,” Harvard Business Review, vol. 31, no. 5, pp. 71-82, 1953.
Raymond Caron, J. Jarvenpaa, Sirkka L. Stoddard, and Donna B., “Business reengineering at CIGNA corporation: Experiences and lessons learned from the first five years,” MIS Quarterly, vol. 18, no. 3, pp. 233-250, 1994. Roger W. Schmenner, “So you want lower costs?,” Business Horizons, vol. 35, no. 4, pp. 24, 1992.
Al Schwartz, “Maximizing profit in a tight economy,” Contractor Magazine, vol. 57, no. 12, pp. 19-42, 2010.
Martin R. Smith, “Reducing direct labor costs through short-interval scheduling,” Management Review, vol. 56, no. 2, pp. 44-50, 1967.