Original Research Article
Depression and its predictors among geriatric population in the urban
slum of Bankura town of Eastern India
Rajib Saha, Tanjib Hassan Mullick*
INTRODUCTION
In the world, depression has been considered as most disabling clinical disease. World Health Organization (WHO) estimated that by the year 2020 the burden of the disease will increase to 5.7% of the total burden if current trend continues.1 It is a disorder that is characterized by sadness, changes in appetite, altered sleep patterns, feelings of dejection or hopelessness and sometimes suicidal tendencies. Currently it is one of the most
profound human problems facing the global health care system.2
Depression among the elderly population in India has been recognized as one of the major public health problems with a prevalence of 8 to 22%. It causes significant suffering and accounts for 5.7% of the years lived with disability (YLDs).3–6 It is projected that by the year 2020, there will be one billion elderly people (65+ years) in the world and 71% of whom will live in low-income countries.7 As per the census 2011, 7.4%
ABSTRACT
Background: Depression is the leading cause of disease burden ranked as third worldwide and also common among elderly people. The study was conducted to find out the prevalence of depression and its correlates among geriatric slum dwellers.
Methods: This community based cross-sectional, an observational analytical epidemiological study was conducted from January 2018 to April 2018 among geriatric people residing in the urban slums of Bankura town. Out of 295 slums, 30 slums were selected by cluster sampling method. From each cluster 7 geriatric people were selected by systematic random sampling method and data were collected by interview method using interviewer-administered both close and open-ended, the predesigned pretested questionnaire which included 15 items Geriatric depression scale short form (GDS-SF). To reveal the ultimate predictor variables, bivariate analysis and followed by logistic regression was done.
Results: Out of 210 people 59.1% was suffering from depression. In multiple logistic regression, we found that people who were suffering from chronic illness were 10.3 times more depressed. Married people were 6 times more depressed than others and 60 to 69 years people were found 4.4 times more depressed than elder geriatrics. People who belonged to poor socio-economic status (IV+V), were found as 2.7 times more depressed. Decision maker within the family was observed more depressed 1.8 times than others.
Conclusions: Chronic illness, economic insecurity due to lower socio-economic status, over-thinking of marital people for their spouse’s security and health and newer identity as ‘senior citizen’ attributed to depression among geriatrics people.
Keywords: Geriatric, Depression, Geriatric depression scale short form, Logistic regression
Department ofCommunity Medicine, Bankura Sammilani Medical College and Hospital, Bankura, West Bengal, India
Received: 11 February 2019
Accepted: 13 March 2019
*Correspondence:
Dr. Tanjib Hassan Mullick, E-mail: [email protected]
Copyright: © the author(s), publisher and licensee Medip Academy. This is an open-access article distributed under the terms of the Creative Commons Attribution Non-Commercial License, which permits unrestricted non-commercial use, distribution, and reproduction in any medium, provided the original work is properly cited.
population of India are geriatric.8 Due to demographic transition by 2050, the number is expected to increase to 315 million, which will constitute 20 per cent of the total population.9
According to the WHO global burden of disease report 2004, depression was the leading cause of burden of disease during 2000-2002, ranked as third worldwide.10 The fatal contribution of depressive disorders to suicide is also widely recognised.11 Studies in primary care settings found higher prevalence (10 to 25%)of depressive disorders amongst the elderly (with chronic co-morbid diseases).12 In this background the present study was conducted in the urban slum of Bankura district of West Bengal to find out the prevalence of depression and its correlates among geriatric slum dwellers.
METHODS
This community based cross-sectional, observational analytical epidemiological study was conducted from January 2018 to April 2018 among geriatric people residing in the urban slums of Bankura town. Bankura town, a small town of eastern India comprises of 1,37,386 population. In this town have 295 slums where 63324 populations are living, 46.1% of total town’s population.13-14 All the geriatric people living permanently in the area since last 5 years were included in this study. Those who were seriously ill, could not be communicated due to language barrier, insanity or diagnosed with serious psychological illness, deafness or dumbness and unwilling persons were excluded from the study. Prevalence of depression among geriatric population was found 46.9% in an urban slum of Kolkata, West Bengal by Dasgupta et al.15 A total of 206 sample size was calculated by using the formula n=z2pq/l2 and considering 5% non-response rate (where, n=sample size, z=standard normal deviate=1.96 at 95% confidence interval, p=prevalence of depression among geriatric population, q=1-p, l=absolute precision). All the slums of the town are comparable to each other in terms of size and composition. Out of 295 slums 30 slums were selected by cluster sampling method and each slum is considered as a single cluster. For this cluster sampling method, 2111 (63,324/30) was calculated as cluster interval. After identification of the clusters, from each 7 geriatric people were selected by systematic random sampling method to fulfil the required sample size. Data were collected by interview method using interviewer administered both close and open ended, predesigned pretested questionnaire which included 15 itemed geriatric depression scale short form (GDS-SF).16 GDS-SF is a screening tool for depression. Total score greater than five indicates probably depression. GDS-SF has demonstrated moderate reliability. Friedman and colleagues reported moderate internal consistency (a Cronbach α coefficient of 0.749). Sensitivity and specificity of the tool are 92% and 89% respectively.17
Before the starting of interview, purpose of the study was explained to them and informed consents were opted. Data were entered in Microsoft Excel worksheet and subsequently analysed using Microsoft Excel functions and IBM SPSS software (version 19.0). Bivariate analysis was performed to assess the association between depression and different independent variables. Factors which were found statistically significant in bivariate analysis were considered for logistic regression to reveal the ultimate predictor variables. Before conducting the study, ethical permission were opted from appropriate authorities.
RESULTS
Present study included 210 people ultimately. Among them 68.1% were belonged to young old age group (60-69 years) and rest were older old (70-80 years) or oldest old (>80 years). Study population comprised of 54.3% male, 39.5% illiterate and 18.6% were employed. Among them 57.1% was living with their spouse. Most of the geriatric people (62.9%) were belong to lower socio economic status (IV and V) [according to modified Dr B.G. Prasad scale] and 74.3% were belonged to joint family. Decision within the family were making by 33.3% people. One third populations (33.3%) were found economically secured and 43.8% were self-dependent. Addiction behaviour observed among 63.8% population. 61.4% of geriatrics was suffering from different type of chronic illness. The current study revealed 59.1% people was suffering from depression, screened by the GDS-SF 15 scale. In bivariate analysis Chi square test was performed as data were qualitative in nature. Phi and Cramer's V tests were also used to evaluate the strength of association between variables. In bivariate analysis it was found that people who were between 60-69 years age group, married, belonging to joint family, decision makers within family, belonging to class IV socio-economic status, socio-economically in-secured and chronically ill, were more depressed and these findings were statistically significant (p<0.05) (Table 1). Statistically significant variables were considered for logistic regression. Statistically significant categorical variables were transformed to dummy variables. Among the all categories of independent variable which one is explaining the output, was coded with higher value and rest of the categories were coded accordingly (Table 2). Alinear relationship was found between continuous independent variables and the logit transformation of the dependent variables. Dependent variable was coded dichotomously 0 and 1 as not depressed and depressed accordingly. The logistic regression model was significant, as evident from omnibus chi-square test (χ2
=115.225, p=0.00). Goodness to fit model was checked by Hosmer Lameshow test [χ2
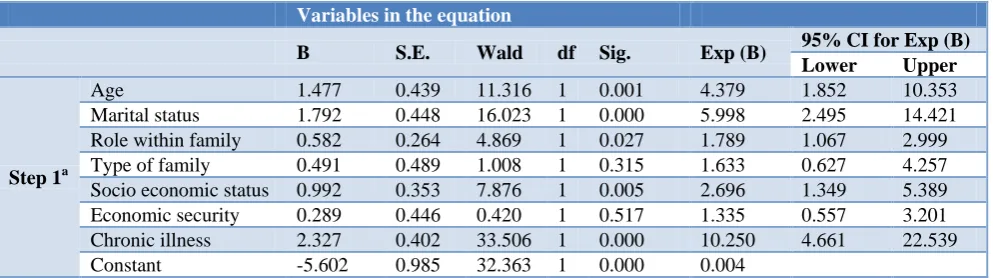
Cox and Snell and Nagelkerke R square. The regression model is able to correctly predict 88.7% geriatric people. Overall, the model predicts 81.9% of depression correctly, as calculated in classification table of the logistic regression model. In multiple logistic regression, we found that people who were suffering from chronic illness were 10.3 times more depressed.
Married people were 6 times more depressed than others and 60 to 69 years people were found 4.4 times more depressed than elder geriatrics. People who were belong to poor socio-economic status (IV+V), were found as 2.7 times more depressed. Decision maker within family were observed more depressed 1.8 times than others (Table 3).
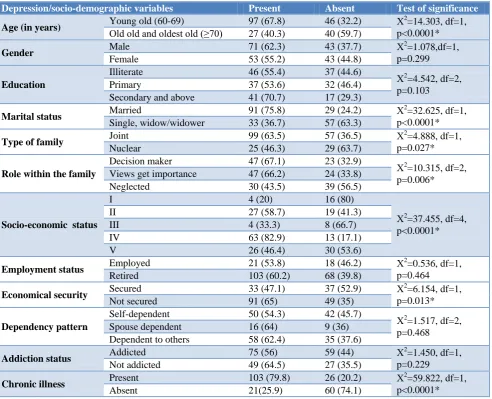
Table 1: Distribution of socio-demographic variables according to depression status of the geriatric population (n=210).
Depression/socio-demographic variables Present Absent Test of significance
Age (in years) Young old (60-69) 97 (67.8) 46 (32.2) Χ
2
=14.303, df=1, p<0.0001* Old old and oldest old (≥70) 27 (40.3) 40 (59.7)
Gender Male 71 (62.3) 43 (37.7) Χ
2
=1.078,df=1, p=0.299
Female 53 (55.2) 43 (44.8)
Education
Illiterate 46 (55.4) 37 (44.6)
Χ2
=4.542, df=2, p=0.103
Primary 37 (53.6) 32 (46.4)
Secondary and above 41 (70.7) 17 (29.3)
Marital status Married 91 (75.8) 29 (24.2) Χ
2
=32.625, df=1, p<0.0001* Single, widow/widower 33 (36.7) 57 (63.3)
Type of family Joint 99 (63.5) 57 (36.5) Χ
2
=4.888, df=1, p=0.027*
Nuclear 25 (46.3) 29 (63.7)
Role within the family
Decision maker 47 (67.1) 23 (32.9)
Χ2
=10.315, df=2, p=0.006* Views get importance 47 (66.2) 24 (33.8)
Neglected 30 (43.5) 39 (56.5)
Socio-economic status
I 4 (20) 16 (80)
Χ2
=37.455, df=4, p<0.0001*
II 27 (58.7) 19 (41.3)
III 4 (33.3) 8 (66.7)
IV 63 (82.9) 13 (17.1)
V 26 (46.4) 30 (53.6)
Employment status Employed 21 (53.8) 18 (46.2) Χ
2
=0.536, df=1, p=0.464
Retired 103 (60.2) 68 (39.8)
Economical security Secured 33 (47.1) 37 (52.9) Χ
2
=6.154, df=1, p=0.013* Not secured 91 (65) 49 (35)
Dependency pattern
Self-dependent 50 (54.3) 42 (45.7)
Χ2
=1.517, df=2, p=0.468 Spouse dependent 16 (64) 9 (36)
Dependent to others 58 (62.4) 35 (37.6)
Addiction status Addicted 75 (56) 59 (44) Χ
2
=1.450, df=1, p=0.229 Not addicted 49 (64.5) 27 (35.5)
Chronic illness Present 103 (79.8) 26 (20.2) Χ
2
=59.822, df=1, p<0.0001*
Absent 21(25.9) 60 (74.1)
*Statistically significant.
Table 2: Scoring of dummy variables.
Variables 0 1 2
Age >70 and 70 <70
Marital status Single/widow/widower Married
Type of family Nuclear Joint
Role within the family Neglected Views get importance Decision maker
Socio-economic status I II+III IV+V
Economic security Secured Not secured
Chronic illness Absent Present
Table 3: Multivariate logistic regression analysis.
Variables in the equation
B S.E. Wald df Sig. Exp (B) 95% CI for Exp (B) Lower Upper
Step 1a
Age 1.477 0.439 11.316 1 0.001 4.379 1.852 10.353 Marital status 1.792 0.448 16.023 1 0.000 5.998 2.495 14.421 Role within family 0.582 0.264 4.869 1 0.027 1.789 1.067 2.999 Type of family 0.491 0.489 1.008 1 0.315 1.633 0.627 4.257 Socio economic status 0.992 0.353 7.876 1 0.005 2.696 1.349 5.389 Economic security 0.289 0.446 0.420 1 0.517 1.335 0.557 3.201 Chronic illness 2.327 0.402 33.506 1 0.000 10.250 4.661 22.539 Constant -5.602 0.985 32.363 1 0.000 0.004
a. Variable(s) entered on step 1: Age, marital status, role within family, type of family, socio economic status, economic status, chronic illness.
DISCUSSION
In the present study majority (68.1%) of geriatric people were belonging to young old age group (60-69 years) and this finding was mostly similar with Mullick et al study conducted in Bhubaneswar (68.45%).18 In Dehradun city, Nautiyal et al found similar finding but proportion (58.75%) was found 10% lesser than us.19
The sex ratio among geriatric population varied within India as found in our study (male: female=54.3% and 45.7%) and Padda et al study (male: female=60.6%: 39.4%); but proportion of males were found greater than females everywhere.20 In our study setting, literacy rate among geriatric generation was found quiet better (60.5%) than other studies like Mullick et al (27%) and Shashi et al (35%).18,21 According to census (2011) 41.6% elderly were found as working in India where in this study it was only 18.6%.22 The present study revealed 57.1% of the geriatric was living with their spouse which was at par (56.8%) with Paul et alstudy finding.23 The current study revealed 59.1% people as depressed, assessed by the GDS-SF 15 scale. In other Indian studies prevalence of depression was found as follows Nautiyal et al(29.9%), Radhakrishnan et al(58.8%), Swarnalatha et al(47%) and Thilak et al (72.4%).19,24-26
Prevalence of depression among geriatrics varies too much within India. Close variations of prevalence have been observed in different country studies like Assil et al study in the Sudan (41.1%), Naglaa et al study in the Egypt (46.6%), and Mullick et al study in the India (54%)).27,28,18 However, this study finding was found quite higher than the finding of Peltzer et al study conducted among South African older adults (4%) and Beekman et al study in the Netherlands (14.9%).29,30 In a systematic review among Caucasian population it was observed that depressive symptoms varied within 7.2% to 49% older adults.31 This variation might be due to the difference in study areas, socio demographic variables, their life style, difference in the depression measuring
scales and difference in cut off age of geriatric population.
In bivariate analysis it was found that people who were between 60-69 years age group, married, belonging to joint family, decision makers within family, belonging to class IV socio-economic status, economically in-secured and chronically ill, were more depressed and these findings were statistically significant (p<0.05).
Grover S et al reviewed Indian researches on geriatric depression in 2015.32 Their finding also supported that lower socio economic status, unemployment or economically insecurity significantly associated with depression. In contrary with our study they found unmarried, divorced or widowed elderly more depressed. Grover et al revealed that in Indian studies depression increased among geriatrics with increasing of age and it was also contradictory with this study finding. Depression among younger old aged people might be attributed by multiple factors such as being newly labelled as senior citizens contributing a psychological effect, adjustment problems to new life after retirement at 60 years, and not able to interact with other people, but older geriatric population above 70 years might be adopted and habituated with the geriatric lifestyle. When logistic regression was done for the factors which were significant in bivariate analysis revealed depression was associated with chronic illness, married geriatric people, young old geriatrics, low socioeconomic status and decision makers within family.
The study showed a 6 time increase in depression amongst the married geriatric population. Married people might be in stressed due to health issues of their spouse and thought of security in absence of one partner, might led to depression.
The present study revealed people from low socioeconomic class were 2.7 times more depressed. Results from survey in Europe and a meta-analysis on socioeconomic inequalities in depression conducted by Lorant and colleagues revealed conclusively that low SES individuals had higher odds of being depressed.35,36
CONCLUSION
More than half of geriatric population was suffering from depressive disorder as screened by the GDS-SF 15 scale here. This study explored that chronic illness, economic insecurity due to lower socio-economic status, over-thinking of marital people for their spouse’s security and health and newer identity as ‘senior citizen’ attributed to depression among geriatrics people. This study tool is used for screening purpose not as diagnostic tool. For the diagnostic confirmation needs subject expertise. So the prevalence of depression here might be varied with real prevalence. But good sensitivity and specificity of the GDS-SF 15 scale minimized the error. Where depression is a psychological disorder, in depth interview will be the best method to reveal the underneath factors or predictors.
Funding: No funding sources Conflict of interest: None declared
Ethical approval: The study was approved by the Institutional Ethics Committee
REFERENCES
1. Lopez AD, Mathers CD, Ezzati M, Jamison DT, Murray CJ. Measuring the Global Burden of Disease and Risk Factors, 1990–2001. In: Lopez AD, Mathers CD, Ezzati M, Jamison DT, Murray CJL, editors. Global Burden of Disease and Risk Factors. Washington (DC): World Bank; 2006. 2. Girma M, Hailu M, Wakwoya A, Yohannis Z,
Ebrahim J. Geriatric Depression in Ethiopia: Prevalence and Associated Factors. J Psychiatry. 2016;20:400.
3. World Health Organization. Mental health and older adults, 2017. Available at: https://www.who. int/news-room/fact-sheets/detail/mental-health-of-older-adults. Accessed on 8 January 2019.
4. Behera P, Sharan P, Mishra AK, Nongkynrih B, Kant S, Gupta SK. Prevalence and determinants of depression among elderly persons in a rural community from northern India. Natl Med J India. 2016;29(3):129–35.
5. Nancy A. CDC promotes public health approach to address depression among older adults. Centers for Disease Control and Prevention, 2012. Available at:
https://www.cdc.gov/aging/publications/briefs.htm. Accessed on 12 February 2019.
6. Djernes JK. Prevalence and predictors of depression in populations of elderly: a review. Acta Psychiatr Scand. 2006;113(5):372–87.
7. Solomons NW, Flores R, Gillepsie S. Health and nutrition: emerging and reemerging issues in developing countries. J Health and Ageing. 2001;3:3–6.
8. Ohri P, Gupta SK, Upadhyai N. A Study of Daily Living Dependency Status among Elderly in an Urban Slum area of Dehradun. IJCH. 2014;26:4. 9. Building a knowledge base on population ageing in
India: report on the status of elderly in select states of India. New Delhi. UNFPA, 2012.
10. The global burden of disease: 2004 update. Geneva: WHO. World Health Organisation, 2008. Available at: http://www.who.int/healthinfo/ global_burden_disease/GBD_report_2004update_fu ll.pdf. Accessed on 12 February 2019.
11. Jacob KS. Depression: A major public health problem in need of a multi-sectoral response. Indian J Med Res. 2012;136(4):537–9.
12. Kritiotis L. Depressive disorders and chronic comorbid disease states: A Pharmaco-epidemiological Evaluation. Magister Scientiae. Nelson Mandela Metropolitan University, 2007. Available at: http://dspace.nmmu.ac.za:8080/ jspui/bitstream/10948/653/1/LIA%20KRITIOTIS.p df. Accessed on 12 February 2019.
13. Bankura City Census 2011 data. Available at: http://www.census2011.co.in/census/city/213-bankura.html. Accessed on 12 February 2019. 14. Total number of slum Pockets, Slum population
percentage of Slum population, total number of CDS, NHC and NHG formed in the urban local bodies. Available at: https://www.wbdma.gov.in/ PDF/Total%20Number%20of%20Slum.pdf. Accessed on 12 February 2019.
15. Dasgupta A, Mukhopadhyay M, Das S, Majumdar S, Das A. Are our elderly really depressed?: A cross sectional study on depression among geriatric population in a slum of Kolkata. Int J Health Sci Res. 2014;4(6):25-30.
16. Jerome AY. Geriatric Depression Scale. Psychopharmacol Bulletin. 1988;24:4;709-11. Available at: http://dementiapathways.ie/_filecache /237/cea/62-geriatric_depression_scale_short.pdf. Accessed on 12 February 2019.
17. Friedman B, Heisel MJ, Delavan RL. Psychometric properties of the 15-item Geriatric Depression Scale in functionally impaired, cognitively intact, community-dwelling elderly primary care patients. J Am Geriatr Soc. 2005;53(9):1570-6.
19. Nautiyal A, Madhav NVS, Ojha A, Sharma RK, Bhargava S. Prevalence of Depression among Geriatric People in Dehradun City of Uttarakhand, India. J Depress Anxiety. 2015;4:208.
20. Padda AS, Mohan V, Singh J, Deepti SS, Dhillon HS. Health profile of aged persons in urban and rural field practise areas of medical college, Amritsar. Indian J community med. 1998;23(2):72-6.
21. Shashi K, Mishra P, Goswami A. Morbidity among elderly persons residing in a resettlement colony of Delhi. Indian J Prev Soc Med. 2004;35:1-9. 22. Elderly in India. Government of India, 2016.
Available at: http://mospi.nic.in/sites/default /files/ publication_reports/ElderlyinIndia_2016.pdf). Accessed on 12 February 2019.
23. Paul NSS, Ramamurthy PH, Paul B, Saravanan M, Santhosh SR, Fernandes D, et al. Depression among geriatric population; the need for community awareness. Clin Epidemiol Global Health. 2019;7(1):107-10.
24. Radhakrishnan S, Nayeem A. Prevalence of depression among geriatric population in a rural area in Tamilnadu. International J Nutr, Pharmacol, Neurological dis. 2013;3(3):309-12.
25. Swarnalatha N. The Prevalence of Depression among the Rural Elderly in Chittoor District, Andhra Pradesh. J Clin Diagn Res. 2013;7(7):1356– 60.
26. Thilak SA, Sarada AK, Sushrit A. Prevalence and factors associated with depression among the elderly in rural areas of Kannur, North Kerala, India: a cross sectional study. Int J Community Med Public Health. 2016;3(8):1986-91.
27. Assil S, Zeidan Z. Prevalence of depression and associated factors among elderly Sudanese: a household survey in Khartoum State. East Mediterr Health J. 2013;19(5):435.
28. Abdo NM, Eassa S, Abdalla AM. Prevalence of Depression among Elderly and Evaluation of
Interventional Counseling Session in Zagazig District –Egypt. J American Sci. 2011;7(6):739-48. 29. Peltzer K, Phaswana-Mafuya N. Depression and
associated factors in older adults in South Africa. Glob Health Action. 2013;6.
30. Beekman AT, Deeg DJ, van Tilburg T, Smit JH, Hooijer C, van Tilburg W. Major and minor depression in later life: a study of prevalence and risk factors. J Affect Disord. 1995;36(1–2):65–75. 31. Djernes JK. Prevalence and predictors of depression
in populations of elderly: a review. Acta Psychiatr Scand. 2006;113(5):372–87.
32. Grover S, Malhotra N. Depression in elderly: A review of Indian research. J Geriatric Mental Health. 2015;2(1):4-15.
33. Sidik SM, Rampal L, Afifi M. Physical and mental health problems of the elderly in a rural community of Sepang Selangor. Malays J Med Sci. 2004;11:46-53.
34. Sagar RS, Mohan D, Kumar V, Khandelwal SK, Nair PG. Physical illnesses among elderly psychiatric out-patients with depression. Indian J Psychiatry. 1992;34:41-4.
35. Freeman, Tyrovolas S, Koyanagi A, Chatterji S, Leonardi M, Ayuso-Mateos JL, et al. The role of socio-economic status in depression: results from the COURAGE (aging survey in Europe). BMC Public Health. 2016;16:1098.
36. Lorant V, Deliege D, Eaton W, Robert A, Philippot P, Ansseau M. Socioeconomic inequalities in depression: a meta-analysis. Am J Epidemiol. 2003;157(2):98–112.