ISSN (Online): 2409-4285 www.IJCSSE.org Page: 285-293
A Dataset of Handwritten Arabic Letters for Machine Learning
Applications
Ahmed M.D.E. Hassanein1, Yasser Mohammed2 and Youssef Ehab3
1 Systems and Information Department, Engineering Division, National Research Centre (NRC), Dokki, Giza, Egypt.
Postal Code:12622
2, 3 Electrical Communication and Electronics Department, School of Engineering, October University for Modern
Sciences and Arts (MSA), Al Wahat Road, Giza , Egypt
1[email protected], 2[email protected], 3[email protected]
ABSTRACT
A lot of research is done in the Arabic letter recognition field and several datasets are created. We aim to add to the research field a new dataset that is a benchmark with the already existing ones to be used for classification of Arabic letters. This paper provides images of a new handwritten disconnected Arabic letters dataset. A group of 19 features are calculated for each letter in the dataset. The K-nearest neighbor algorithm is applied for the classification problem of the letters. When choosing a part of the dataset including 16 letters which are visually different, the successful classification results is almost 86%. However; when choosing the whole dataset of 28 letters, the successful classification result is 61%..
Keywords: Arabic letters, handwritten letters, classification problem, KNN algorithm, Holland Features.
1. INTRODUCTION
It is estimated that there exist about three million historical Arabic manuscripts. Images of handwritten text are transformed into text that needs to be understandable to computers, or in other words into (ASCII) [1]. Arabic text recognition of such Arabic text is still an active research problem [2]. In 1970s Optical Character Recognition (OCR) on Arabic started. In 1975, the first work on Arabic OCR was published, and in the 1990s the first Arabic OCR system was made. A lack of effort with handwritten Arabic texts still exists, even though almost three decades have passed, when compared to text recognition of other scripts [1]. Most of the researchers have focused on OCR for English, Chinese and other languages; on the other hand, not many researchers focused on Arabic character recognition, despite it being spoken by more than 280 million people and being considered one of the major languages. Researchers in the field of Arabic character recognition have achieved less success compared to researchers who focused on character recognition of other languages; that is because the Arabic language is of complex nature [3]. The
primary issue experienced when managing handwritten Arabic characters is that characters written by various people of the same character are not only indistinguishable but also can change in shape and size. The variety of human penmanship styles of writing also affects the diversity in how the character looks. What’s more, the mind-set and composition circumstances of the writer can affect the writing style [1].
2. LITERATURE SURVEY
Due to the complexity of the Arabic letters, our work is only on separate Arabic handwritten letters. Historically one of the applied Systems for arabic letter recognition is the system discussed by Sahloul et al. [1]. This system focuses on some of the main characteristics of the main body of the letter including Structural Features, Statistical Features, Morphological Features and Secondary Components. Before running the images of the handwritten Arabic letters through the algorithm which they discuss, they pass through several stages before Classification. These stages are binarization, slant correction, normalization, noise removal and finally feature extraction. Classification takes place when the entire previous stages end, the classifier used in this system is the Feed Forward Neural Network classifier, 80% of the dataset was used to train the Classifier and the other 20% was left for testing. This system has reached good accuracy as presented in the paper [1]. The advantages are high recognition rate of 88% overall, use of statistical features on the main body and secondary components bettered the recognition result. The disadvantages are the system still struggles hard with some of the letters, especially the ones with loops in them, due to using neural networks, the output result is unexplainable, and we cannot figure out why it generated such output [1].
learning neural network. Segmentation and feature extraction are also used in this system. To improve the classification network process in the system several ideas are used which are sparse interaction, parameter sharing and equivalent representation. More recent techniques are used for dealing with training neural network training issues in regularization and optimization, such as Varying Learning Rate and Batch Normalization. Convolutional neural network is the main technique that is used within this system [2]. The advantages gained are that the over fitting in the system is reduced and great accuracy in recognizing the letters is achieved. The disadvantage is that the computational cost of applying neural networks interms of time for the training part is high and long for complex tasks.
A third classification system is mentioned in [4] which goes through several stages such as Preprocessing, Segmentation, Thinning, Feature Extraction and Classification. Intial one is the Preprocessing phase where some processes like Binarization, Skew Detection and Median Filtering take place [4]. The next stage is Segmentation which is divided into three stages namely Line Segmentation, Sub-word Segmentation and Letter Segmentation. Thinning is then implemented to transform the image to a simplified but topologically equivalent image [4]. After Thinning and Letter Segmentation, Feature Extraction takes place. The features are categorized into three divisions namely Main Body Features, Boundary and Skeleton features and Secondary Object Features [4]. The final stage is Classification, the output of the Feature Extraction process is the input of the Classification process. 24 features are used in the classification stage. The advantages are that the algorithm that is used is easy to implement and it can handle noise and missing values. The disadvantages are that the decision tree generated by the algorithm can completely change if a small variation in the data occurs and the system suffers from over-segmentation especially when using Traditional Arabic and Microsoft Sans Serif fonts. The system achieves low accuracy with only 48.3%, and the performance is considered disappointing based upon the letter segmentation and classification performance [4].
A fourth classification system is mentioned by Abdelkafor et al. [3] which is divided into two stages namely Database Collection and Character recognition. The Character Recognition stage is divided into three different phases namely Image Preprocessing, Feature Extraction and Classification. The method used for classification in this system is Multi-Layer Back Propagation Artificial Neural Network, and it depends on two stages namely training and testing [3]. The advantages of this system are that the implementation of the system is easy and very good accuracy is achieved compared to other systems that used the same dataset [3].
The disadvantages are that the back propagation neural network is considered slow and inefficient, it can generate sub-optimal solutions due to getting stuck at local minima and the system depends highly on the used dataset and factors related to it. If any other dataset is used which may contain an old style writing style then the system suffers from very low accuracy [3].
To conclude, we have seen how current systems work, some of them used neural networks and others used decision tree. But as we see, more research in this field is needed, because these systems have several drawbacks. These drawbacks result from one hand using wrong algorithms that have several limitations such as some of these algorithms are slow and inefficient and some other need high computational cost. On the other hand some systems fail against certain letters with certain characteristics which is dataset dependent. Our system tends to use a classifier that is simple, easy to implement, fast, versatile and provides high accuracy which leaves the space for us to focus on the dataset.
Arabic language is considered one of the major languages and it is one of the most widely used languages among the world, despite that, it does not get enough attention from researchers as much as Latin and Japanese letters get with letter recognition. Arabic letters are more complicated compared to Latin and Japanese. In this paper, we create a dataset as a bench mark to study disconnected Arabic letters that can be used to focus on the recognition of separate handwritten Arabic letters. The dataset used in this paper is of our own creation. Some basic processing operations are applied to the images of the handwritten letters. All the images are then added together to form a dataset. The resulting dataset is divided into training set (70%) and testing set (30%). The K-Nearest Neighboour (KNN) classifier is applied on the data set just as an initial proof that the dataset is working and suitable for letter recognition problems.
3. DATASET DESCRIPTION
In this paper, we want to come up with something unique to add to the research field where we find that datasets on the internet contain handwritten letters by various people but they lack details about them. Our dataset differs than the other datasets by including as much details as possible so that we widen the scope of users.
Fig. 1. An A4 paper divided to two sections: an upper computerized and a lower handwritten.
One half of the paper contains the letter which the individual is supposed to write and the other half is left blank to write the letter in it. A black pen with a thick tip is given to each individual. The tip is almost one centimeter in length and half centimeter in width. Every individual is asked to write all of the 28 letters of the Arabic language as shown in Fig. 1. The papers are then collected and scanned so that each file contains a single letter with the size of almost 1700 pixels in width and 2300 pixels in height. The dataset is then used with KNN algorithm created by us to identify handwritten Arabic letters using 19 features.
3.1 Genders and Age
Ten tables are shown below which contains the handwritten 28 letters of the 10 different individuals. The scanned handwritten letters are shown in the tables which represents the lower half of fig. 1.
Table 1: set1 of 28 letters for female whose age is 20
Table 2: set2 of 28 letters for male whose age is 23
Table 3: set3 of 28 letters for female whose age is 22
Table 4: set4 of 28 letters for male whose age is 23
Table 5: set5 of 28 letters for male whose age is 22
Table 6: set6 of 28 letters for male whose age is 22
Table 7: set7 of 28 letters for female whose age is 22
Table 8: set8 of 28 letters for female whose age is 22
Table 9: set9 of 28 letters for female whose age is 19
Each of the letters shown in table 1 to table 10 is given a number and latin name for ease of reference throughout the paper. For example in table 1, the first letter in the upper row on the left is given number 1 and called “Alef”. The last letter in the bottom row on the right is given number 28 and called “Ya2”. The numbers and latin names of the 28 arabic letters is shown in table 11 below.
Table 11: Numbers and Latin names for the 28 Arabic letters
1
-Alef 2-B
a2
3
-T
a2
4
-T
h
a2
5
-Geem 6-7
a2
7
-Kh
a2
8
-Dal 9-Z
al
10
-R
a2
11
-Z
ein
12
-Sein
13
-Sh
ein
14
-Sad
15
-Dad
16
-T
ah
17
-Z
ah
18
-3
ein
19
-3
’ei
n
20
-Fa2
21
-Qaf
22
-Kaf
23
-L
am
24
-Me
im
25
-No
o
n
26
-Ha2
27
-W
aw
28
-Ya2
When examining the letters 8-Dal, 9-ZAl, 10-Ra2 and 11-Zein in the tables 1 to 10, we can immediately see that the differences between them are minimal. Consequently, classification of these letters and similar ones represent a great challenge in real life.
3.1 Processing Operation on dataset
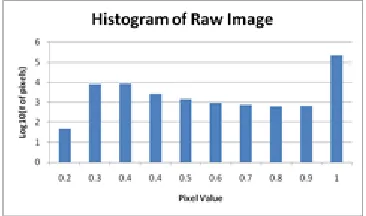
Table 1 to table 10 contains the whole handwritten dataset received from the volunteers. When scanned the images are not purely black and white but they contain grey pixels with values between 0 and 1. The histogram of an example of these raw images is shown in fig. 2.
Fig. 2. Histogram of the character 10 Ya2 without any processing operations
Fig.2 shows that in each image of a letter their exist a range of pixels that have values between black (0) and white (1). The scanned images are binarized as to
eliminate grey pixels and convert them to black and white images. A threshold is set so that values above this threshold is converted to one and below this threshold are converted to zero. This is called binarization process.
Fig. 3. Histogram of the character 10 Ya2 after applying the binarization operation
The result of the binarization process for the image whose histogram is shown in fig. 2 is shown in fig. 3. As shown in Fig. 3, all pixels have values that are either 0 or 1. All images of the letters shown in table 1 to table 10 are binarized to be able to proceed with calculating the features of each of the characters. The classification process can then be applied as discussed next.
3.2 Feature Selection
In our feature selection phase we used features similar to the ones used in Holland approach [5, 6]. We define some parameters to represent the equations used in our calculations. The word image here refers to the image of a handwritten letter.
We use the following notations in our equations:
Let vertical position of black pixels is
y
i wherei
is the pixel number.Let horizontal position of black pixels is
x
i wherei
is the pixel number.Then we have the following features [5, 6] representing Holland approach:
Feature 1 (F1): Horizontal Position of the center point of the smallest rectangle containing the letter
cx
. Feature 2 (F2): Vertical Position of the center point of the smallest rectangle containing the letter
cy
.Feature 3 (F3): Width of the smallest image containing the letter
W
.Feature 4 (F4): Height of the smallest image containing the letter
H
.Feature 5 (F5): Number of black pixels representing the letter
n
.Feature 6 (F6): Mean horizontal position of all black pixels divided by width:
n i
i
cx
x
nW
1:1
(1)
The value of Eq. (1) increases as the weight of the letter under consideration in the left half of the image is greater than the right half or vice versa.
Feature 7 (F7): Mean vertical position of all black pixels divided by height:
n i icy
y
nH
1:1
. (2)
The value of Eq. (2) increases as the weight of the letter under consideration in the upper half of the image is greater than the lower half or vice versa.
Feature 8 (F8): Mean of square value of horizontal position of all black pixels divided by square of width:
n i icx
x
W
n
1:2 2
1
.
(3)
The value of Eq. (3) increases as the horizontal positions of the pixels of the letter under consideration are far away from the center of the image.
Feature 9 (F9): Mean of square value of vertical position of all black pixels divided by square of height:
n i icy
y
H
n
1:2 2
1
.
(4) The value of Eq. (4) increases as the vertical positions of the pixels of the letter under consideration are far away from the center of the image.
Feature 10 (F10): Mean of product of vertical position divided by height and horizontal position divided by
width:
x
cx
y
cy
nWH
i n ii
1:
1
(5)
The value of Eq. (5) increases when there exists diagonal lines of pixels in the shape of the letter under consideration.
Feature 11 (F11): Mean of product of square of horizontal position divided by height and vertical
position divided by width:
x
cx
y
cy
H
nW
i n ii
1:
2 2
1
(6)
The value of Eq. (6) measures the variation in the horizontal position of the pixels of the letter under consideration with respect to the change in the vertical position of pixels.
Feature 12 (F12): Mean of product of horizontal position divided by height and square of vertical position divided
by width:
2: 1 2
1
cy
y
cx
x
nWH
i n ii
. (7) The value of Eq. (7) measures the variation in the vertical position of the pixels of the letter under consideration
with respect to the change in the horizontal position of pixels.
Feature 13 (F13): Mean of horizontal position of pixels changing from white to black as we go left to right. Feature 14 (F14): Mean of vertical position of pixels changing from white to black as we go left to right. Feature 15 (F15): Mean of horizontal position of pixels changing from white to black as we go top to bottom. Feature 16 (F16): Mean of vertical position of pixels changing from white to black as we go top to bottom. Then we have another set of features extracted from MatlabTM [7]:
Feature 17 (F17): bwarea function is calculated using MatlabTM and is used to estimate the area of the letter in
each image.
Feature 18 (F18): bwperim function is calculated using MatlabTM and is used to estimate the length of the
perimeter of the letter in each image.
Feature 19 (F19): bweuler function is calculated using MatlabTM and is used to calculate the total number of
objects (i.e. letter and dots) in each image minus the number of holes in each.
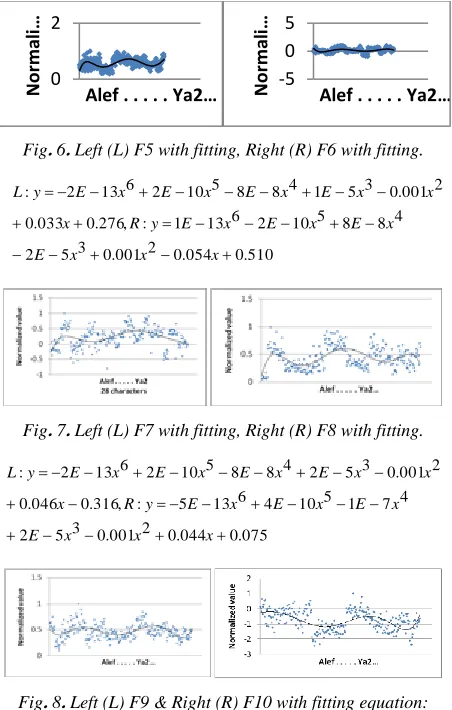
3.3 Features Discussion
Each feature is plotted below for all 28 characters. A trend line is added for each plot to fit the data using the excel options. The polynomial equation of the line representing the trend is written below each plot. The 19 features discussed above are plotted in fig. 4 to fig. 13 as shown below.
.
Fig. 4. Left (L) F1 with fitting, Right (R) F2 with fitting.
875 . 0 033 . 0 2 001 . 0 3 5 1 4 8 8 5 10 3 6 13 3 : , 083 . 0 054 . 0 2 001 . 0 3 5 3 4 7 2 5 10 5 6 13 5 : x x x E x E x E x E y R x x x E x E x E x E y L
Fig. 5. Left (L) F3 with fitting, Right (R) F4 with fitting
874 . 0 033 . 0 2 001 . 0 3 5 1 4 8 8 5 10 3 6 13 3 : , 084 . 0 054 . 0 2 001 . 0 3 5 3 4 7 2 5 10 5 6 13 5 : x x x E x E x E x E y R x x x E x E x E x E y L 0 2 N o rm al iz …
Alef . . . Ya2… 0
2 N o rm al i…
Alef . . . Ya2…
0 2 N o rm al i…
Fig. 6. Left (L) F5 with fitting, Right (R) F6 with fitting. 510 . 0 054 . 0 2 001 . 0 3 5 2 4 8 8 5 10 2 6 13 1 : , 276 . 0 033 . 0 2 001 . 0 3 5 1 4 8 8 5 10 2 6 13 2 : x x x E x E x E x E y R x x x E x E x E x E y L
Fig. 7. Left (L) F7 with fitting, Right (R) F8 with fitting.
075 . 0 044 . 0 2 001 . 0 3 5 2 4 7 1 5 10 4 6 13 5 : , 316 . 0 046 . 0 2 001 . 0 3 5 2 4 8 8 5 10 2 6 13 2 : x x x E x E x E x E y R x x x E x E x E x E y L
Fig. 8. Left (L) F9 & Right (R) F10 with fitting equation:
251 . 0 004 . 0 2 5 4 3 6 8 4 7 1 5 10 4 6 13 6 : , 524 . 0 017 . 0 3 5 1 4 8 9 5 10 3 6 13 3 : x x E x E x E x E x E y R x x E x E x E x E y L
Fig. 9. Left(L) F11 & Right(R) F12 with fitting equation:
466 . 0 049 . 0 2 001 . 0 3 5 2 4 7 1 5 10 3 6 13 4 : , 487 . 0 059 . 0 2 001 . 0 3 5 2 4 7 1 5 10 3 6 13 3 : x x x E x E x E x E y R x x x E x E x E x E y L
Fig. 10. Left(L) F13 & Right(R) F14 with fitting equation:
823 . 0 031 . 0 2 001 . 0 3 5 1 4 8 9 5 10 3 6 13 4 : , 122 . 0 037 . 0 2 001 . 0 3 5 2 4 7 1 5 10 4 6 13 5 : x x x E x E x E x E y R x x x E x E x E x E y L
Fig.11.Left(L) F15 & Right(R) F16 with fitting equation:
496 . 0 004 . 0 3 6 5 4 8 3 5 10 1 6 13 2 : , 078 . 0 048 . 0 2 001 . 0 3 5 2 4 7 1 5 10 4 6 13 5 : x x E x E x E x E y R x x x E x E x E x E y L
Fig. 12. Left(L) F17 & Right(R) F18 with fitting equation:
265 . 0 026 . 0 3 5 1 4 8 7 5 10 2 6 13 2 : , 144 . 0 019 . 0 3 5 1 4 8 6 5 10 2 6 13 2 : x x E x E x E x E y R x x E x E x E x E y L
Fig. 13. F19 with fitting equation:
143 . 0 005 . 0 3 6 2 4 8 1 5 11 4 6 14
5
E x E x E x E x x y
The polynomial equation for each feature is compared to all others to see if any is repeated. The polynomial is of the 6th order. Non of the equations has the seven
coefficients in the polynomial exactly equal the coefficients of another feature. But, few polynomials have six of the seven coefficients equal to another polynomial such as that shown in fig. 4L and fig. 5L. F1 shown in fig. 2L represents the horizontal position of the center point and F3 shown in Fig. 5L represents the width of the box containing the letter. The data of both would have the same slopes and ups and downs and so we expect their equations to be almost the same. Both provide the same data and so we can remove one of them without affecting the classification accuracy. The differences in the coefficients of the polynomials describing the 19 features shown above are positive
0 2 N o rm al i…
Alef . . . Ya2… -5
0 5 N o rm al i…
attributes. Each of the 19 features is important and vital in determining the output of the classification results. However; the repetition in the values of some of the coefficients in some of the polynomial equations shows that these 19 features are not the optimal when working with this dataset. These features can be only used to give initial results about the suitability of the proposed dataset for classification problems. But, more effort is required to come up with new features which work best with this dataset.
4. CLASSIFICATION OF
HANDWRITTEN LETTERS
In this Section, we use the MatlabTM software on our data
set to classify and identify the handwritten Arabic letters using the features discussed above. The MatlabTM
software is a group of algorithms which can be used for many purposes including but not limited to machine learning [8], signal processing [9, 10, 11, 12, 13, 14, 15, 16] and geographical systems [17, 18, 19, 20] … etc. The KNN algorithm which is used to classify letters selects the k-closest neighbors to one instance using the Euclidean distance method. The Euclidean distance is a measure of the difference between the corresponding values of each feature for several instances to find out which have the minimum total differences for all features. The instances with the minimum Euclidean distance are said to belong to the same class. Next, we choose 16 characters of the 28 which are visually unrelated in terms of shape. These letters are (table 11): 1-Alef, 2-Ba2, 5-Geem, 8-Dal, 11-Zein, 13-Shein, 14-Sad, 16-Tah, 18-3ein, 22-Kaf, 23-Lam, 24-Meim, 25-Noon, 26-Ha2, 27-Waw and 28-Ya2. For each of these letters, we have the ten versions from the 10 individuals who have handwritten the letters above. The dataset is divided into 70% for training purposes and 30% for testing purposes. For the training section, for each letter a class is assigned that identifies the character. For the testing section, the features discussed above are calculated for each image of a letter. The KNN algorithm is used to classify the data which is based on calculating the Euclidean distance between the features of each unknown character and each of the known characters. The minimum distance refers to the character that best describes the unknown character and consequently its class [6]. The criteria used to evaluate the results are the true positive rate of classification (TP Rate) and false positive rate of classification (FP Rate) [21]. For any one character, the TP Rate counts the number of events in which different images of this character are truly classified as this one character [6]. But the FP Rate counts the number of events in which images of other characters are falsely classified as this one character [6].
The TP rate for classifying the dataset with 16 selected characters is shown in fig. 14.
Figure 14: Accuracy percentage when using 16 characters
As shown in fig. 14, few characters are erroneously classified by the KNN algorithm. The average percentage of correctly classified characters is 86.875%. Next, the FP rate for classifying the dataset with 16 selected characters is shown in fig. 15.
Figure 15: Error percentage when using 16 characters
The highest FP rate comes for the two letters 25-Noon and 28 Ya2. These letters resemble some of the other letters such as 2-Ba2 and so they are expected to cause some confusion to the classifying algorithm. Then, we apply the same algorithm for the 28 characters. Fig. 16 and Fig. 17 show the results.
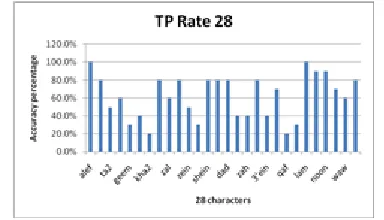
Figure 16: Accuracy percentage when using 28 characters
percentages because two other letters resemble it such as 5-Geem and 6-7a2.
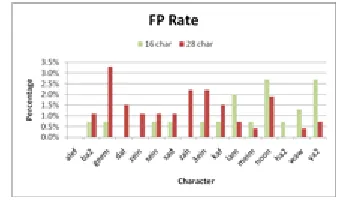
Figure 17: Error percentage when using 28 characters
When using the dataset with all 28 characters, the average percentage of correctly classified characters is 61.7857%. The FP rate for many characters shown in fig. 17 has many variations as well. The inclusion of all 28 letters has included letters that differs from others by a single dot or may be a certain bending in the shape of the letter. These minute differences put a very great weight on the features which are used and the classification algorithm to successfully identify Arabic letters. Next we compare the results when using the dataset with 16 characters and when using the dataset with 28 characters.
Figure 18: Comparison of TP rate for 16 characters
Fig. 18 shows a comparison of the TP rate for the classification results of the 16 characters used in fig. 14. The comparison is between the classification results when using a dataset with 16 characters only and the classification results when using a dataset with the all 28 characters. The TP rate remains the same or decreases for all 16 characters except for character 2-Ba2. The inclusion of the characters 3-Ta2 and 4-Tha2 in the 28 character dataset included values for the features which made the classification more accurate. In accordance with these results fig. 18 shows a comparison of the FP rate for the classification results of the 16 characters used in fig. 14. The comparison is between the classification results on using a dataset with the 16 characters only and the classification results on using a dataset with the all 28 characters.
Figure 19: Comparison of FP rate for 16 characters.
The FP rate remains the same or increases for all 16 characters except for characters 23-Lam, 24-Meim, 25-Noon, 26-Ha2, 27-Waw and 28-Ya2. The inclusion of the 28 characters made the features capture finer details for each character in order to do the classification which led to decreasing the FP rate for some characters shown in fig. 19.
5. CONCLUSION
A new handwritten dataset is introduced in this paper. The dataset contains 10 different sets of the 28 Arabic alphabet each written by a different individual. Each individual is given 28 papers each has the size A4 and is divided to two halves. One half contains the letter to be written and the other half is left blank to write in it. All papers are scanned into image files and then each images is binarized to have it in white and black color. 19 features are calculated for each letter including Holland style features and others taken from MatlabTM functions.
KNN classifier is used to classify the images in the dataset. The initial results are good and the dataset is recommended for further classifications work.
ACKNOWLEDGEMENTS
This work was supported by the:
Electrical Communication and Electronics Department, School of Engineering, October University for Modern Sciences and Arts (MSA), Al Wahat Road, Giza, Egypt. and the: Center of Excellence, October University for Modern Sciences and Arts (MSA), Al Wahat Road, Giza, Egypt.
REFERENCES
[1] Bonnaccorsi, “On the Relationship between Firm Size and Export Intensity,” Journal of International Business Studies, XXIII (4), pp. 605-635, 1992. (journal style) [2] R. Caves, Multinational Enterprise and Economic
[3] M. Clerc, “The Swarm and the Queen: Towards a Deterministic and Adaptive Particle Swarm Optimization,” In Proceedings of the IEEE Congress on Evolutionary Computation (CEC), pp. 1951-1957, 1999. (conference style)
[4] H.H. Crokell, “Specialization and International Competitiveness,” in Managing the Multinational Subsidiary, H. Etemad and L. S, Sulude (eds.), Croom-Helm, London, 1986. (book chapter style)
[5] K. Deb, S. Agrawal, A. Pratab, T. Meyarivan, “A Fast Elitist Non-dominated Sorting Genetic Algorithms for Multiobjective Optimization: NSGA II,” KanGAL report 200001, Indian Institute of Technology, Kanpur, India, 2000. (technical report style)
[6] J. Geralds, "Sega Ends Production of Dreamcast," vnunet.com, para. 2, Jan. 31, 2001. [Online]. Available: http://nl1.vnunet.com/news/1116995. [Accessed: Sept. 12, 2004]. (General Internet site)
[7] http://www.mathworks.com/
[8] Zaki, M., Laila Hussein, Mostafa Gouda, Rania Bassuoni, Ahmed Hassanein, "Nutritional Epidemiological Study to Estimate Usual Intake and to Define Optimum Nutrient Profiling Choice in the Diet of Egyptian Youths" Food and Nutrition Sciences, 1422-1436, Vol 6, No 15, Nov 2015.
[9] Hassanein, A. M. D., "A Virtual Confocal Microscope with Variable Diameter to Improve Resolution", Journal of Multidisciplinary Engineering Science and Technology (JMEST), Volume 2, Issue 3, Mar 2015. [10]Hassanein, A. M. D., "Characteristics of Focusing
Behavior of Virtual Lens with Variable Diameter", Journal of Multidisciplinary Engineering Science and Technology (JMEST), Volume 2, Issue 3, Mar 2015. [11]Hassanein, A. M. D., Alonso Corona Chávez
"Expanding Microwave Confocal Microscope Method through Metamaterials and Modality of Object’s Physical Properties", International Journal of Computer Applications, Volume 4, Issue 3, Article no. AIR.2015.073, Feb 2015.
[12]Hassanein, A. M. D., Alonso Corona Chávez "Improving Ultra Wide Band Imaging using a Metamaterial Slab", International Journal of Computer Applications, Volume 94, No 5, May 2014.
[13]Hassanein, A. M. D., "Comparing the Virtual Confocal Microscope Transform with the Direct Fourier Method", Journal of Advances in Natural and Applied Sciences, Volume 7, Issue 5, Dec 2013.
[14]Kwag, Y., A. D. Hassanein, et al. (February 2009). "A High Directive Bowtie Radar Antenna with a Pyramidal Reflector for Ultra Wideband Radar Imaging Applications." Microwave and Optical Technology Letters 51(2): 387-390.
[15]Hassanein, A. M. D., “A Slab to Reduce Back-Reflected Clutter for the Whole Ultra-WideBand Range”, Seventh Cairo International Biomedical Engineering Conference (CIBEC 2014), 11-13 Dec, 2014, Egypt.
[16]Hassanein, A. D., D. J. Edwards, et al., UWB Tomography via Simulated Optical Systems. International Symposium on Antenna & Propagation (ISAP08), 27 to 30 October 2008, Taipei, Taiwan.
[17]Hassanein, A. M. D., "Using Google Earth Images in Studying the Rasheed and Domiat Branches", Advances in Research, Volume 4, Issue 3, Article no. AIR.2015.069, Jan 2015.
[18]Hassanein, A. M. D., "Direct Extraction Of Elevation Values From Google Earth Images", American-Eurasian Journal of Sustainable Agriculture, Volume 9, Issue 3, Mar 2015.
[19]Hassanein, A. M. D., Fahmy, Enas M., "Towards a comprehensive Nile River Geographical Ontology Model", Journal of Advances in Natural and Applied Sciences, July 2012.
[20]Hassanein, A. M. D., "Studying the Effect of Breakwaters on Ras-El-Bar Beach Using Google Earth Images", Advances in Environmental Biology, Volume 9, Issue 3, Feb 2015.
[21]Zanwar, Shrinivas and Narote, Sandipann P. and Narote, Abhilasha S. and B. Shinde, U., An Effectual Optical Character Recognition Using Efficient Learning System (February 24, 2019). Proceedings of International Conference on Sustainable Computing in Science, Technology and Management (SUSCOM), Amity University Rajasthan, Jaipur - India, February 26-28,
2019. Available at SSRN: