Original Research Article
Attitudes towards menopause and its relationship with
sociodemographic factors among postmenopausal women living in a
rural area of Jammu: a cross-sectional study
Najma Akhtar, Kiran Bala*, Rajiv K. Gupta
INTRODUCTION
In her lifetime a women passes through many transitions like physical, social and physiological. Out of all, physiological transition menopause is most important but usually ignored. In the current century, a woman is expected to live more than one-third of her lifetime after menopause, taking into consideration ongoing trends in life expectancy.1 Although, menopause is a natural phase
of life but is listed as disease in International Classification of Diseases- 9 and 10, Disease Database, e-Medicine, and medical subject headings. It alters the function of human body resulting in menopausal
symptoms termed as „menopausal syndrome‟.2
Worldwide about 25 million women reached menopause in the year 1990 and it is projected to be doubled by the year 2020.3 In India, according to National Family Health
ABSTRACT
Background: Positive attitude towards menopause is believed to be associated with positive menopausal experience and vice versa. In order to improve women‟s menopausal experience, thereby improving quality of life, it is important to understand their attitude towards menopause. The objectives of the research were to explore the attitude towards menopause and its relationship with various socio-demographic and life style factors among postmenopausal woman in the rural setting.
Methods: This community-based cross sectional study was conducted using non probability sampling and house-to-house visit in randomly selected villages falling under rural health block Kot-Bhalwal, Jammu. 245 postmenopausal women were interviewed using modified attitude towards menopause checklist. The data so collected was analyzed using Open Epi version 3.1. For finding statistical significance, unpaired t-test and analysis of variance were used wherever needed. A p value of less than 0.05 was considered statistically significant.
Results: The highest percentage of agreement with the positive item was for “a woman gets more confidence in herself after menopause” (77%). The lowest percentage of agreement with the positive item was for “going through menopause really does not change a woman in any important way,” (42.5%). There was a statistically significant mean difference between mean attitude score and religion, and no. of living children (F value=3.14, p value=0.002). No significant association was found between other sociodemographic variables and attitude towards menopause scores.
Conclusions: There is a large scope of counseling and health education for improving and enhancing quality of life of postmenopausal women in rural setting of our country.
Keywords: Menopause, Attitude towards menopause checklist, Attitude
Department ofCommunity Medicine, Government Medical College Jammu, Jammu and Kashmir, India
Received: 23 October 2019
Accepted: 04 December 2019
*Correspondence:
Dr. Kiran Bala,
E-mail: [email protected]
Copyright: © the author(s), publisher and licensee Medip Academy. This is an open-access article distributed under the terms of the Creative Commons Attribution Non-Commercial License, which permits unrestricted non-commercial use, distribution, and reproduction in any medium, provided the original work is properly cited.
Survey (NFHS- 4) survey done in 2015-2016 about 17.5% of women have attained menopause. This percentage is similar to findings of NFHS 3 (2005-2006)
18% and NFHS 2 (1998-1999) 17.7%.4 About 12.6
million women in India are above 45 years of age, contributing to about 10.4% of the total population.5 While the women in reproductive age group (15-45 years) are covered under various health programmes and schemes like Reproductive and Child Health program II, Janani Suraksha Yojana, Integrated Child Development Service, Rashtriya Kishor Swasthya Karyakram etc., at present, there is no specific health programme catering the health need and demands of women above the age of 45 years.5,6 It is important to focus on this group of women which has grown in number and is expected to increase at tremendous rate in coming years that cannot be ignored.
Perception, attitude and knowledge regarding the menopause may differ from one population to another. For some women menopause with its symptoms becomes a life time crisis whereas for others it passes like any other normal physiological phase of life. Knowledge and beliefs about menopause is influenced by number of factors like education, marital status, physical activity and social background. Attitude plays an important role in experiencing menopause. It has been observed that adequate knowledge about menopause among women builds right perception which inculcates positive attitude towards menopause (ATM) in them, thereby improving
their menopausal experience. Moreover, negative
attitudes towards menopause are associated with negative experiences of menopause.6-13There is plenty of literature available on menopausal attitude from western society. However, this aspect of menopause remains unexplored in the Indian subcontinent especially Northern India. The purpose of this research was to have better understanding of ATM to improve the quality of life to this group of population.
METHODS
Research site
This community-based cross sectional study was conducted in villages falling under Keri zone of health Block Kot Bhalwal, Jammu.
Research approach
Exploratory research approach.
Source of data
Post-menopausal women from selected research site.
Study period
The study was conducted from November 2015 to August 2016.
Sampling method
Out of four health zones under Block Kot Bhalwal, Keri health zone was selected randomly. One village from this zone was randomly selected. On completion of survey in first selected village, next village was randomly chosen from the adjoining villages.
Method of data collection
After seeking ethical approval from institutional ethical committee, Government Medical College, Jammu, the study commenced with the sensitization of the members of Panchayat, women groups, social workers, accredited social health activist workers and other health workers of the randomly selected villages for assuring the proper cooperation at the time of data collection. Thereafter, all those postmenopausal women who agreed to participate in this study by giving informed written consent were covered in the study. Data collection was conducted by face-to-face interview on house-to-house visit. In order to maintain clarity of the study instrument, at the time of interview, the structured interview questionnaire was translated in the local language of the participants by researcher herself.
Tool for research
Data collection was done using two part questionnaire. The first part consist of information regarding Sociodemographic and lifestyle variables i.e., age, religion, marital status, education, monthly income, type of family, self-employment status, occupation of husband, no. of living children, smoking status and physical activity and was collected using semi-structured performa. The second part of questionnaire included information regarding attitude of study participants towards menopause and was collected using modified ATM scale.14-16 The modified ATM scale comprised of 19 items, agreement with which is expressed on 5-point Likert‟s scale ranging (1: strongly disagree to 5: strongly agree). Total score was calculated for each subject through summing up the points of the responses to each question and the mean attitude score for each person was calculated as well. The higher summary scores reflect an overall more positive attitude. The Cronbach‟s alpha reliability of this scale for the current study was 0.82.
Statistical analysis
RESULTS
A total of 245 postmenopausal women were interviewed during this study. The mean (±SD) age of the study participants were 56.49±9.9 years ranging from 36 to 106 years. Majority of the study women were in the age group 50-59 years (40.8 %) followed by age group 60-69 years (30.6%), and majority of the study participants were Muslims (52.3%). The detailed results of descriptive data have been published elsewhere.17
Table 1 displays the total percentage scores of agreement with each of the 19 statements about menopause on the ATM rank ordered by frequency of response. The highest percentage of agreement with the positive item was for “a woman gets more confidence in herself after menopause” (77%) and the lowest percentage of agreement with the positive item was for “going through menopause really does not change a woman in any important way” (42.5%). In the negative items, the highest percentage of agreement was for “a woman should see a doctor at menopause” (58.7%).
Table 1: Distribution of percent agreement or disagreement of study respondents to statements of ATM scale.
Statement Agreement (%)
A woman is concerned about how her husband will feel about her after menopause. 50.2
A woman should see a doctor at menopause. 58.7
Menopause is one of the biggest changes that happen in a woman’s life 54.1
Menopause is an unpleasant experience. 40.8
After menopause a woman feels freer to do things for herself.* 74.0
Women think of menopause as the beginning of the end. 32.3
Women generally feel better after menopause.* 63.0
Frankly speaking, just about every woman is depressed about menopause. 17.41
Women are generally calmer and happier after menopause.* 61.72
Menopause is a disturbing thing that women generally dread. 18.6
Women should expect some troubles during menopause. 52.8
A woman’s body may change in menopause but otherwise she doesn’t change much.* 47.5
Women usually feel “down in the dumps” at the time of menopause. 29.0
Life is more interesting for a woman after menopause.* 73.0
After Menopause, women do not consider themselves “real women”. 27.0
Changes inside the body that women cannot control cause all the trouble at menopause. 46.4
The only difference between a woman who has been through menopause and one who has not is that one menstruates and the other doesn’t.* 44.9 Going through menopause really does not change a woman in any important way.* 42.5
A woman gets more confidence in herself after menopause.* 77.0
*: Positive item; ǂ: Mean±standard deviation and median of the total score of attitude was 62.30±11.25 and 64. (Range: 29-88); ǂǂ: Mean average attitude score was 3.02 (SD±0.34); ǂǂǂ: Both mode and median response was 4.
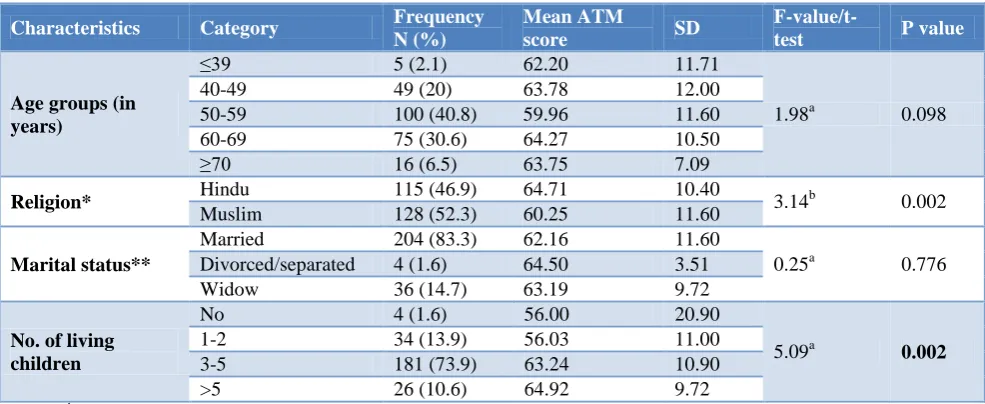
Table 2: Association of demographic parameters with ATM check list.
Characteristics Category Frequency
N (%)
Mean ATM
score SD
F-value/t-test P value
Age groups (in years)
≤39 5 (2.1) 62.20 11.71
1.98a 0.098
40-49 49 (20) 63.78 12.00
50-59 100 (40.8) 59.96 11.60
60-69 75 (30.6) 64.27 10.50
≥70 16 (6.5) 63.75 7.09
Religion* Hindu 115 (46.9) 64.71 10.40 3.14b 0.002
Muslim 128 (52.3) 60.25 11.60
Marital status**
Married 204 (83.3) 62.16 11.60
0.25a 0.776
Divorced/separated 4 (1.6) 64.50 3.51
Widow 36 (14.7) 63.19 9.72
No. of living children
No 4 (1.6) 56.00 20.90
5.09a 0.002
1-2 34 (13.9) 56.03 11.00
3-5 181 (73.9) 63.24 10.90
>5 26 (10.6) 64.92 9.72
a
It was followed by another negative item, “menopause is one of the biggest changes that happen in a woman‟s life” which had 54.1% agreement. More than 80% of study participants disagreed over the two negative items, i.e., “frankly speaking, just about every woman is depressed about menopause” and “menopause is a disturbing thing that women generally dread.” The item, “a woman is concerned about how her husband will feel about her after menopause” had equal number of agreement and disagreement responses of the participant.
As presented in the Table 2 there was a statistically significant mean difference between mean attitude score and religion (F value=3.14, p value=0.002). The results have also revealed a statistically significant association between number of living children a women is having
with ATM mean score (p<0.0002). Other demographic parameters like age groups and marital status exhibited non-significant association with the ATM check list.
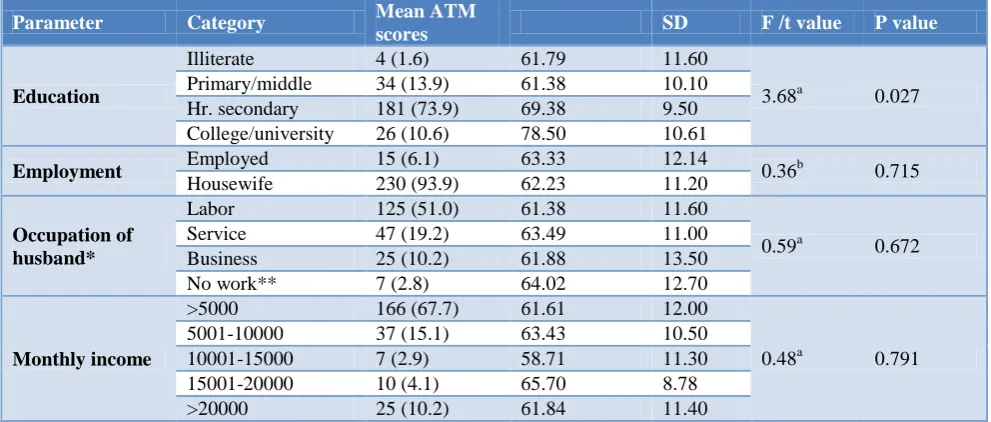
A high significant mean difference (f=3.680, p value=0.027) between various categories of education and attitude while rest of the socioeconomic parameters did not show any statistically significant mean difference for attitude. With respect to education, highest mean ATM score (78.50) was recorded in college/ university which was followed by higher secondary group (69.38) while lowest was recorded in primary/middle (61.79) and Illiterate group (61.38) (Table 3).
There was no statistical significant association for parameters like physical activity and smoking status with ATM scores (Table 4).
Table 3: Association of socio-economic parameters with ATM check list.
Parameter Category Mean ATM
scores SD F /t value P value
Education
Illiterate 4 (1.6) 61.79 11.60
3.68a 0.027
Primary/middle 34 (13.9) 61.38 10.10
Hr. secondary 181 (73.9) 69.38 9.50
College/university 26 (10.6) 78.50 10.61
Employment Employed 15 (6.1) 63.33 12.14 0.36b 0.715
Housewife 230 (93.9) 62.23 11.20
Occupation of husband*
Labor 125 (51.0) 61.38 11.60
0.59a 0.672
Service 47 (19.2) 63.49 11.00
Business 25 (10.2) 61.88 13.50
No work** 7 (2.8) 64.02 12.70
Monthly income
>5000 166 (67.7) 61.61 12.00
0.48a 0.791
5001-10000 37 (15.1) 63.43 10.50
10001-15000 7 (2.9) 58.71 11.30
15001-20000 10 (4.1) 65.70 8.78
>20000 25 (10.2) 61.84 11.40
a
:F-test; b: T-test; *: Applicable only to the women who were living with their husbands; **: Husband was either bedridden or doing little household works.
Table 4: Association of physical activity and smoking status with ATM check list.
Parameters Category N (%) Mean ATM
scores SD F/t value P value
Physical activity
Light active 100 (40.8) 61.30 12.00
2.00a 0.137
Moderate 90 (36.7) 61.81 11.50
Highly active 55 (22.5) 64.93 8.90
Smoking status
Non smoker 169 (69.0) 62.23 11.70
0.21a 0.811
Past smoker 28 (11.4) 63.54 9.50
Current smoker 48 (19.6) 61.85 10.50
a
:F-test.
DISCUSSION
In our study responding to questions of the ATM Checklist; most of the study participants exhibited a
70% of our respondents were in agreement to the statement “a woman gets more confidence in herself after menopause” in contrast to Ghadheri, Jasim and Huffman‟sstudies it was 46.3%, 43.1 and 51.8%.9,21,22 The freedom from various cultural and religious restrictions after menopause can be cited reason for this finding.
Knowing more about menopause may enable women to better cope up with menopausal changes and this can be put forward as a justification for our finding in the present study that educated women had more positive ATM than their illiterate counterparts. This result was found in concordance with Avis et al.8 However, Tsehey et al, Cheng et al and Leon et al found a significant negative impact of education on menopausal perception.12,18,23 On the other hand, Wilbur et al did not find any statistically significant relationship between women‟s ATM and educational level.24
The results revealed a statistically significant association of positive attitude with number of living children. The reason behind this association could be the moral support from the family members for women during this crucial stage of menopause. In this study, no significant difference in menopausal attitudes across marital status and age was found. Other authors from Ecuador and Ethiopiaalso reported similar results.17,19
CONCLUSION
The general perception to menopause (as revealed by ATM checklist) was positive. A statistically significant association of attitude with religion, educational status and type of family was found. Health, education and planning ahead for challenges can make this period as one of the most rewarding and enriching time.
Recommendations
With growing emphasis on universal health coverage, it is the need of hour to improve women‟s menopausal attitude hereby, experiences during this stage of life.It is imperative upon the authorities to identity the preventive strategies and incorporate counselling for this neglected segment of the society for improving quality of their life.
Funding: No funding sources Conflict of interest: None declared
Ethical approval: The study was approved by the Institutional Ethics Committee
REFERENCES
1. Puri S, Bhatia V, Mangat C. Perceptions of
menopause and postmenopausal bleeding in women Of Chandigarh, India. Internet J Fam Pract. 2007;6(2):1-6.
2. Govil D. Health needs of middle aged population: an unaddressed link. Paper presented at European
Population Conference; Poster Session 2 2010 Sep 1-4; Vienna, Austria.
3. World Health Organization: Research on
Menopause. Report on World Health Organization Scientific Group. Technical Report Series 670. Geneva: World Health Organization; 1981.
4. International Institute for Population Sciences (IIPS) and ICF. 2017. National Family Health Survey (NFHS-4), India. Mumbai: IIPS; 2015-16.
5. Government of India. Census 2011. Office of the Registrar General and Census Commissioner India, Ministry of Home Affairs. New Delhi; 2012.
6. Singh A, Pradhan SK. Menopausal symptoms of
postmenopausal women in a rural community of Delhi, India: A cross-sectional study. J Mid-life Health 2014;5:62-7.
7. Madhukumar S, Gaikwad V, Sudeepa D. A
community based study on perceptions about menopausal symptoms and quality of life of post-menopausal women in Bangalore rural. Inter J Health Sci Res. 2012;2(3):49-56.
8. Avis NE, McKinlay SM. A longitudinal analysis of
women‟s attitudes toward the menopause: results from the Massachusetts Women‟s Health Study. Maturitas. 1991;13(1):65-79.
9. Huffman SB, Myers JE, Tingle LR, Bond LA.
Menopause symptoms and attitudes of African-American women: Closing the knowledge gap and
expanding opportunities for counsellor. J
Counselling Dev. 2005;83(1):48-56.
10. Thomas SE. Menopause knowledge and attitudes of
English-speaking Caribbean women: implications for health education. Californian J Health Promot. 2005;3(3):167-76.
11. Nosek M, Kennedy H, Lee K. The Effects of
perceived stress and attitudes toward menopause and aging on symptoms of menopause. J Midwifery Womens Health. 2010;55(4):328-34.
12. Tsehay DS, Mulatie MM, Sellakumar GK.
Determinants of menopausal symptoms and attitude among middle aged women: The case of Dangila Town, North West Ethiopia. Innovare J Social Sci. 2014:2(1):15-20.
13. Huffman SB, Myers JE. Counselling women in
midlife: An integrative approach to menopause. J Counselling Dev. 1999;77:258-66.
14. Theisen SC, Mansfield PK, Seery BL, Voda A.
Predictors of midlife women‟s attitudes towards menopause. Health Values. 1995;19(3):22-31.
15. Osarenren N, Ubangha MB, Nwadinigwe IP,
Ogunleye T. Attitudes of women to menopause: Implications for counselling. Edo J Counsel. 2009;2(2):155-65.
16. Neugarten BL, Wood V, Kraines RJ. Women‟s
attitudes toward the menopause. Vita Hum Int Z Lebensalterforsch. 1963;6:140-51.
18. Leon P, Chedraui P, Hidalgo L, Ortiz F. Perceptions and attitudes toward the menopause among middle aged women from Guayaquil, Ecuador. Europ J Menopause. 2007;57:233-8.
19. Adewuyia TDO, Akinade EA. Perception and
attitudes of Nigerian women towards menopause. Procedia Social Behavior Sci. 2010;5:1777-82. 20. Kaur S, Walia I, Singh A. How menopause affects
the lives of women in suburban Chandigarh, India. Climacteric. 2004;7(2):175-80.
21. Ghaderi E, Ghazanfarpour M, Kaviani M.
Evaluation of menopausal women‟s attitudes towards menopause in Shiraz. Pak J Med Sci. 2010;26(3):698-703.
22. Jassim GA, Al-Shboul Q. Attitudes of Bahraini women towards the menopause: Implications for health care policy. Maturitas. 2008;59:358-72.
23. Cheng M, Fuh J, Wang S. Attitude toward
menopause among middle aged women: a community/survey in an island of Taiwan. Europ J Menopause. 2005;52:348-55.
24. Wilbur J, Montgomery A. The influence of
demographic characteristics, menopausal status, and symptoms on women‟s attitudes toward menopause. J Women Health. 1995;23:19-39.
Cite this article as: Akhtar N, Bala K, Gupta RK. Attitudes towards menopause and its relationship with sociodemographic factors among