Original Research Article
Density of in-vitro fertilization centers and its correlation with
socioeconomic factors in Maharashtra state, India
Prakash Prabhakarrao Doke*, Daya Krishan Mangal, Anuja Gulati
INTRODUCTION
Infertility has become an important and increasing problem across the world. In India, also infertility has attracted obvious attention after the third District Level Health Survey (DLHS) carried out in 2007-08.1 Conversely, the Total Fertility Rate (TFR) is showing declining trend in many states. The decline in TFR is a desired status and is clearly expressed in most of the policy documents in India. Most of the couples opt to have a child within few years after marriage due to family
pressure or own desire. It is well-known that, apart from bio-medical reasons like age, smoking, diabetes etc. socio-demographic factors like education, income, urbanization etc. are important determinants of infertility. The infertile couple particularly the woman is at receiver‟s end of unwarranted and tormenting comments. She is believed to be an incomplete woman. The couple particularly the woman vehemently seeks treatment for infertility to avoid its social consequences like marital disruption and domestic violence perpetrated by husband and in-laws.2 The natural instinct of parenting is
ABSTRACT
Background: The infertility due to various reasons is increasing and correspondingly the number in vitro fertilization (IVF) centers is also increasing. Some procedures in these centers can deliver desired sex of the unborn child. The gender discrimination in India has already resulted unfavorable child sex ratio for girls. Maharashtra is one of the badly affected states. It is feared that the child sex ratio may further decline due to IVF centers. The study was carried out to measure correlation between number of IVF centers with various indicators of sex ratio infertility, and some socio-economic factors.
Methods: The study was conducted in 2014 using secondary data. District wise internet search by using words „In-Vitro Fertilization center‟ and „infertility treatment center‟ was carried out. Whenever IVF center/procedure was noticed on the internet, the center with its address was included in that district list.
Results: There was positive correlation between IVF centers and urbanization, per capita income, female literacy and negative correlation with population sex ratio and no correlation with sex ratio at birth or child sex ratio. The best correlation was observed with urbanization, which explains the observed correlation with other variables.
Conclusions: The number of IVF centers is not related with magnitude of infertility and not affecting sex ratio whereas IVF density seems to be an outcome of extent of urbanization.
Keywords: Sex ratio at birth, Population sex ratio, Urbanization, Female literacy rate, Per capita income, Infertility
1
Department of Community Medicine, Bharati Vidyapeeth Deemed University Medical College, Pune, Maharashtra, India
2
Indian Institute of Health Management Research Jaipur, Rajasthan, India
3
State Programme Coordinator, Maharashtra State Office, Thane, Maharashtra, India
Received: 29 October 2018
Accepted: 03 December 2018
*Correspondence:
Dr. Prakash Prabhakarrao Doke, E-mail: [email protected]
Copyright: © the author(s), publisher and licensee Medip Academy. This is an open-access article distributed under the terms of the Creative Commons Attribution Non-Commercial License, which permits unrestricted non-commercial use, distribution, and reproduction in any medium, provided the original work is properly cited.
responded by medical fraternity by providing Assisted Reproductive Techniques (ART). The number of in vitro fertilization (IVF) centers is enormously rising.
The newspapers, internets frequently have persuasive advertisements of such centers. This increase of IVF centers in the market is likely to be proportionate to the demand. Like a childless lady, woman having only daughters also receives unwarranted and tormenting comments. The son preference frequently results into daughter aversion. Neglect of girl children may reach to even their elimination which has been well documented since long period.3 The in-laws fervently try to convince the woman to try accepting all possible means to give birth to male child only.4,5 Ultrasound checkup is a non-invasive and comparatively affordable technique of sex detection of unborn child. It is also contended that with ultrasound machines capturing the market, the child sex ratio has declined. For addressing the problem of declining child sex ratio, Parliament of India enacted pre natal diagnostic act in 1994. Advancement in technology compelled the Parliament to amend the Act in 2003 to include pre conception techniques also under the ambit of the act. It is believed that families in connivances with doctors are going for sex selection. Maharashtra is one of the states which has shown drastic decline in child sex ratio during last couple of decades. It is feared that the increasing number of IVF centers may further decrease child sex ratio. Authors have conducted the study to find out socio-economic correlates of density of IVF centers and the effect IVF centers on sex ratio. The specific objectives of the study were to measure the correlation between number of IVF centers and following socio-economic factors; TFR, infertility, population density, decadal growth rate, female literacy, income, urbanization and to measure the correlation between number of IVF centers and various statistics of sex ratio.
METHODS
Study population and area
This study was carried out in 2014 using secondary data pertaining to Maharashtra State, which has 35 districts and 22 Municipal Corporations. Maharashtra is the second populous State in India. Population of Maharashtra is 112,374,333 which constitute about 10% of the population of India. Information about some socio-demographic factors is provided in Table 1. The literacy rate of the State is 82.95% and female literacy rate is 75.48% as per Census 2011.6 Maharashtra has well developed industrial area. Among larger states it occupies second rank next to Haryana in per capita income.7,8
Compilation of IVF centers in Maharashtra
Internet search was carried out by using words IVF center, infertility treatment center, genetic clinic, genetic center or genetic counseling center. Similar search was carried out by using available online telephone directory
services. The search was repeated for each district and
each Municipal Corporation including Mumbai
Municipal Corporation separately. Whenever IVF center/procedure was noticed on the internet, the center with its address was included in that district list. Ayurvedic and Homeopathy centers were usually not considered but six Ayurvedic centers and one homeopathy center proclaimed availability of IVF hence with the assumption that they may have appointed qualified technicians were included in the corresponding district list. Authors also collected list from State Appropriate Authority (AA) under PCPNDT Act, Indian Society for Assisted Reproduction and National Registry of ART Clinics and ART Banks in India maintained by Indian Council of Medical Research. Authors have not considered various procedures under assisted reproductive techniques separately and the word IVF center is used as a generic term. Genetic centers, genetic counseling centers and genetic laboratories were limited in number; hence no further analysis was carried out for such centers.
Infertility and fertility data
The state wise and district wise data about infertility was taken from DLHS 3.1,9 No distinction was made between primary and secondary infertility. The district wise information of TFR in Maharashtra state was obtained from the Survey of Causes of Death (SCD) for the year 2011, and sex ratio at birth from civil registration system.10,11 The SCD scheme collects information about vital events including TFR from rural areas of all the districts. State wise information of TFR was taken from sample registration system report for 2012.12
Sex ratio data
The state wise as well as district wise information in Maharashtra state about population sex ratio and child sex ratio was obtained from Census 2011 report.6 Sex ratio at birth was obtained from available report of civil registration system.11
Case study
One maternity home from Pune which was established before 50 years and started IVF services since last 20 years was visited. In depth interview was taken of the owner who is Obstetrician and Gynecologist.
Data analysis
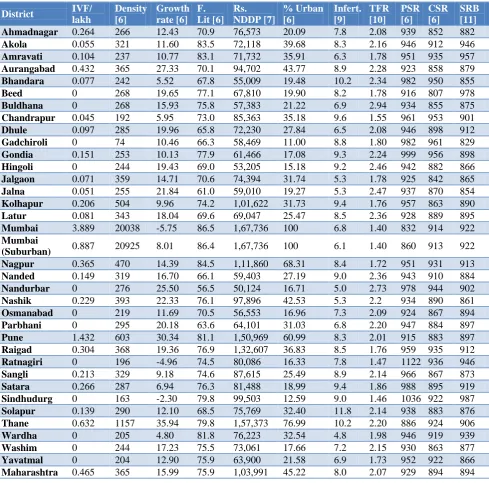
Table 1: Socio demographic indicators, Maharashtra state.
District IVF/ lakh
Density [6]
Growth rate [6]
F. Lit [6]
Rs. NDDP [7]
% Urban [6]
Infert. [9]
TFR [10]
PSR [6]
CSR [6]
SRB [11]
Ahmadnagar 0.264 266 12.43 70.9 76,573 20.09 7.8 2.08 939 852 882
Akola 0.055 321 11.60 83.5 72,118 39.68 8.3 2.16 946 912 946
Amravati 0.104 237 10.77 83.1 71,732 35.91 6.3 1.78 951 935 957
Aurangabad 0.432 365 27.33 70.1 94,702 43.77 8.9 2.28 923 858 879
Bhandara 0.077 242 5.52 67.8 55,009 19.48 10.2 2.34 982 950 855
Beed 0 268 19.65 77.1 67,810 19.90 8.2 1.78 916 807 978
Buldhana 0 268 15.93 75.8 57,383 21.22 6.9 2.94 934 855 875
Chandrapur 0.045 192 5.95 73.0 85,363 35.18 9.6 1.55 961 953 901
Dhule 0.097 285 19.96 65.8 72,230 27.84 6.5 2.08 946 898 912
Gadchiroli 0 74 10.46 66.3 58,469 11.00 8.8 1.80 982 961 829
Gondia 0.151 253 10.13 77.9 61,466 17.08 9.3 2.24 999 956 898
Hingoli 0 244 19.43 69.0 53,205 15.18 9.2 2.46 942 882 866
Jalgaon 0.071 359 14.71 70.6 74,394 31.74 5.3 1.78 925 842 865
Jalna 0.051 255 21.84 61.0 59,010 19.27 5.3 2.47 937 870 854
Kolhapur 0.206 504 9.96 74.2 1,01,622 31.73 9.4 1.76 957 863 890
Latur 0.081 343 18.04 69.6 69,047 25.47 8.5 2.36 928 889 895
Mumbai 3.889 20038 -5.75 86.5 1,67,736 100 6.8 1.40 832 914 922
Mumbai
(Suburban) 0.887 20925 8.01 86.4 1,67,736 100 6.1 1.40 860 913 922 Nagpur 0.365 470 14.39 84.5 1,11,860 68.31 8.4 1.72 951 931 913
Nanded 0.149 319 16.70 66.1 59,403 27.19 9.0 2.36 943 910 884
Nandurbar 0 276 25.50 56.5 50,124 16.71 5.0 2.73 978 944 902
Nashik 0.229 393 22.33 76.1 97,896 42.53 5.3 2.2 934 890 861
Osmanabad 0 219 11.69 70.5 56,553 16.96 7.3 2.09 924 867 894
Parbhani 0 295 20.18 63.6 64,101 31.03 6.8 2.20 947 884 897
Pune 1.432 603 30.34 81.1 1,50,969 60.99 8.3 2.01 915 883 897
Raigad 0.304 368 19.36 76.9 1,32,607 36.83 8.5 1.76 959 935 912
Ratnagiri 0 196 -4.96 74.5 80,086 16.33 7.8 1.47 1122 936 946
Sangli 0.213 329 9.18 74.6 87,615 25.49 8.9 2.14 966 867 873
Satara 0.266 287 6.94 76.3 81,488 18.99 9.4 1.86 988 895 919
Sindhudurg 0 163 -2.30 79.8 99,503 12.59 9.0 1.46 1036 922 987
Solapur 0.139 290 12.10 68.5 75,769 32.40 11.8 2.14 938 883 876
Thane 0.632 1157 35.94 79.8 1,57,373 76.99 10.2 2.20 886 924 906
Wardha 0 205 4.80 81.8 76,223 32.54 4.8 1.98 946 919 939
Washim 0 244 17.23 75.5 73,061 17.66 7.2 2.15 930 863 877
Yavatmal 0 204 12.90 75.9 63,900 21.58 6.9 1.73 952 922 866
Maharashtra 0.465 365 15.99 75.9 1,03,991 45.22 8.0 2.07 929 894 894
RESULTS
IVF centers
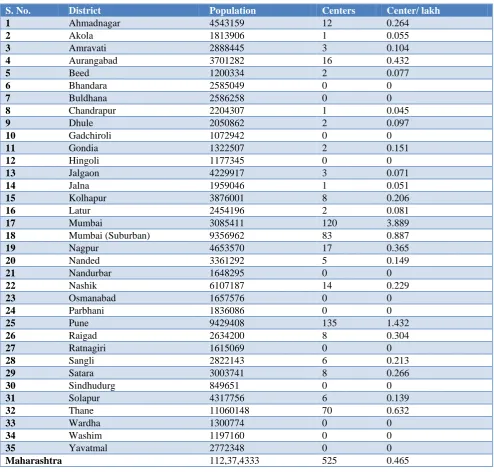
Authors enlisted 525 IVF centers in Maharashtra state through various sources. The district wise information of number of IVF centers is given in Table 2.
Infertility and TFR in Maharashtra
The district wise status of TFR in Maharashtra is given in Table 1. The state wise correlation coefficient calculated between proportion of infertility (IIPS, 2010) and TFR (Office of the Registrar, 2013) showed that there is no
correlation (r=0.095; C.I. 95%=-0.36 to 0.52). The correlation coefficient between TFR and infertility in Maharashtra is given in the Table 3.
Sex ratio
Population sex ratio, child sex ratio and sex ratio at birth in Maharashtra is given in Table 1. The trends in population sex ratio, child sex ratio in Maharashtra are shown in Figure 1.
Correlation
Table 2: IVF centers in Maharashtra state.
S. No. District Population Centers Center/ lakh
1 Ahmadnagar 4543159 12 0.264
2 Akola 1813906 1 0.055
3 Amravati 2888445 3 0.104
4 Aurangabad 3701282 16 0.432
5 Beed 1200334 2 0.077
6 Bhandara 2585049 0 0
7 Buldhana 2586258 0 0
8 Chandrapur 2204307 1 0.045
9 Dhule 2050862 2 0.097
10 Gadchiroli 1072942 0 0
11 Gondia 1322507 2 0.151
12 Hingoli 1177345 0 0
13 Jalgaon 4229917 3 0.071
14 Jalna 1959046 1 0.051
15 Kolhapur 3876001 8 0.206
16 Latur 2454196 2 0.081
17 Mumbai 3085411 120 3.889
18 Mumbai (Suburban) 9356962 83 0.887
19 Nagpur 4653570 17 0.365
20 Nanded 3361292 5 0.149
21 Nandurbar 1648295 0 0
22 Nashik 6107187 14 0.229
23 Osmanabad 1657576 0 0
24 Parbhani 1836086 0 0
25 Pune 9429408 135 1.432
26 Raigad 2634200 8 0.304
27 Ratnagiri 1615069 0 0
28 Sangli 2822143 6 0.213
29 Satara 3003741 8 0.266
30 Sindhudurg 849651 0 0
31 Solapur 4317756 6 0.139
32 Thane 11060148 70 0.632
33 Wardha 1300774 0 0
34 Washim 1197160 0 0
35 Yavatmal 2772348 0 0
Maharashtra 112,37,4333 525 0.465
Table 3: Correlation coefficients between variables, Maharashtra state.
IVF/
Lakh Density
Growth
rate F. Lit. Rs. NDDP
% Urban.
Inferti-lity TFR PSR CSR SRB
IVF/lakh 1
Density (C.I. 95%)
0.76** (0.52 to 0.99)
1
Growth rate (C.I. 95%)
-0.19 (-0.53 to 0.16)
-0.33 (-0.60 to 0)
1
F. Literacy (C.I. 95%)
0.44** (0.12 to 0.77)
0.44** (0.13 to 0.67)
-0.32 (-0.59 to 0.01)
1
Rs. NDDP (C.I. 95%)
0.71** (0.46 to 0.96)
0.65** (0.41 to 0.81)
0.02 (-0.32 to 0.35)
0.64** (0.39 to 0.80)
1
IVF/
Lakh Density
Growth
rate F. Lit. Rs. NDDP
% Urban.
Inferti-lity TFR PSR CSR SRB
IVF/ Lakh % Urban. (C.I. 95%) 0.74** (0.50 to 0.98) 0.76** (0.57 to 0.87) 0.06 (-0.28 to 0.39) 0.60** (0.33 to 0.78) 0.87** (0.76 to 0.93) 1 Infertility (C.I. 95%) -0.05 (-40 to 0.30) -0.21 (-0.13 to 0.51) -0.05 (-0.38 to 0.29) 0.03 (-0.31 to 0.36) 0.06 (-0.28 to 0.39) -0.08 (-0.40 to 0.26) 1 TFR (C.I. 95%) -0.34* (-0.67 to 0) -0.42* (-0.66 to -0.10) 0.57** (-.29 to 0.76) -0.56** (0.28 to 0.75) -0.51** (-0.72 to -0.21) -0.37* (-0.63 to -0.04) -0.04 (-0.37 to 0.30) 1 PSR (C.I. 95%) -0.54** (-0.84 to -0.25) -0.55** (-0.75 to -0.27) -0.37* (-0.63 to -0.04 ) -0.23 (-0.52 to 0,11) -0.45** (-0.68 to -0.14) -0.65** (-0,81 to -0.41) 0.18 (-16 to 0.48) -0.07 (-0.39 to 0.27) 1 CSR (C.I. 95%) 0.05 (-0.30 to 0.41) 0.09 (-0.25 to 0.41) -0.30 (-0.58 to 0.04) 0.11 (-0.23 to 0.43) 0.10 (-0.24 to 0.42) 0.11 (-0.23 to 0.43) 0.13 (-0.21 to 0.44) -0.23 (-0.52 to 0.11) 0.36* (0.03 to 0.62) 1 SRB (C.I. 95%) 0.11 (-0.24 to 0.46) 0.16 (-0.18 to 0.47) -0.31 (-0.58 to 0.03) 0.53** (0.24 to 0.73) 0.26 (-0.08 to 0.55) 0.18 (-16 to 0.48) -0.05 (-0.38 to 0.29) -0.47** (-0.69 to -0.16) 0.15 (-0.19 to 0.46) 0.08 (-0.26 to 0.40) 1
** Correlation is significant at 0.01 level (2-tailed). * Correlation is significant at 0.05 level (2-tailed).
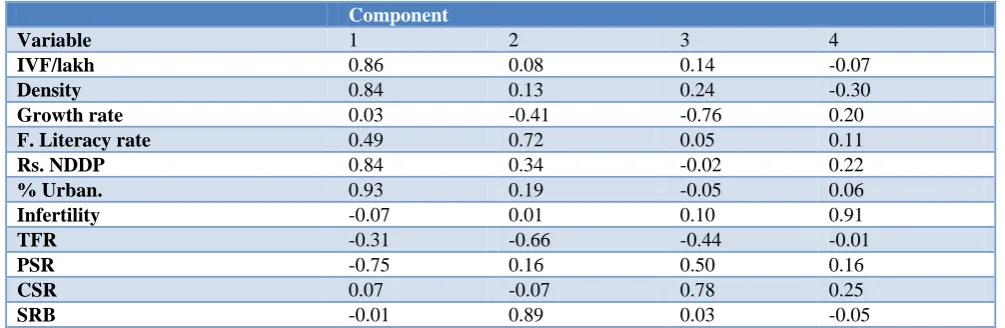
Table 4: Rotated component Matrixa.
Component
Variable 1 2 3 4
IVF/lakh 0.86 0.08 0.14 -0.07
Density 0.84 0.13 0.24 -0.30
Growth rate 0.03 -0.41 -0.76 0.20
F. Literacy rate 0.49 0.72 0.05 0.11
Rs. NDDP 0.84 0.34 -0.02 0.22
% Urban. 0.93 0.19 -0.05 0.06
Infertility -0.07 0.01 0.10 0.91
TFR -0.31 -0.66 -0.44 -0.01
PSR -0.75 0.16 0.50 0.16
CSR 0.07 -0.07 0.78 0.25
SRB -0.01 0.89 0.03 -0.05
Extraction method: Principal component analysis; Rotation method: Varimax with Kaiser normalization; aRotation converged in 6 iterations.
Factor analysis
The results of analysis are given Table 4. Eigen value more than one was the extraction criterion.
In-depth interview
Intrauterine insemination is the easiest technique and carried out by almost all obstetricians. About 40-50% (3600-4500) couples avail IVF services per year. The success rate is about 30%. Sex ratio at birth is 961. There is no clinical preference to any sex excepting in known person having hemophilia. The cost of one cycle is about Rs. 1.5 lakh. Most of the couples do not return after failure of first cycle. Intra-cytoplasmic sperm injection is comparatively delicate a technique.
DISCUSSION
there is some reason for infertility. Hence any prevalence of infertility above this level suggests preventable or treatable causes. In fact couples from both groups consult IVF centers. Smoking and alcohol consumption are leading to as the nozoospermia.18 The trend in India shows that sperm motility is decreasing.19 Advancing parental age decreases fertility particularly by dropping semen volume. Similarly azzospermia is becoming common and in such cases IVF is a boon.20,21 DLHS 3 conducted in 2007-08, revealed that about 8.2% women in India have some infertility problem alike other studies. Few studies have shown very high prevalence of infertility in India. In one survey called „Helping Families‟ which may not be scientifically robust study, 2,562 participant couples and 100 infertility experts from nine cities including Mumbai were interviewed. It was observed that as many as 46% of young couples in the 31-40 year-age group surveyed were found to be infertile.22 But even in a scientific study in from south India high prevalence (50%) was observed in one district but low in another district.23,24 In the Mysore study, the prevalence of primary infertility was 12.6 percent.22 Such studies have generated concern at various levels resulting in redressal strategies including at primary health care settings.25,26 The medical fraternity is also promptly responding to the problem and demand of treatment. As a result of increased demand In Vitro Fertilization centers are mushrooming and probably selecting sex. Hence, Indian Council of Medical Research (ICMR) has disseminated guidelines about ART but they seem be ineffective in curbing the prevalent malpractices in the field of IVF. In most cases infertility is treated with drugs or surgery and many times these treatments are combined. In some cases, ARTs are provided, based on the results of investigations of couples and other factors like paying capacity.27,28 One of the threats in few techniques particularly with pre-implantation genetic diagnosis (PGD) is the strong probability of sex selection of the baby to be born which is illegal in India. Under PCPNDT Act, it is expected that all institutions capable of detecting, selecting sex need registration with the AA. But it is feared that sex selection is happening rampantly although few condemn the act.26 Many rich families tour outside India to conceive the child of desired sex.29 AA had only 129 registered centers (24.43% of listed under this study). This indicates that The Appropriate Authorities are ignoring registration of IVF centers. Indian Council of Medical Research maintains National Registry of ART Clinics and ART Banks in India. Indian Society for Assisted Reproduction has also a short list of registered centers with it. No additional center was identified from those lists. Unless there is strict regulation, it‟s difficult to obtain accurate information about functioning IVF centers. The density of IVF centers worldwide may range from 0.01 to 3.6 centers per million population.13 Our observation lies in the estimated range.
Conceptually infertility and fertility seem to be two sides of the same coin. Increase in infertility may theoretically
contribute to decline in total fertility. It does not seem to be true at national level in India, as the correlation coefficient is less than 0.1 (derived from state wise data of these two variable from DLHS 3 and Sample Registration System), and in Maharashtra also (r=-0.04). Weak negative correlation was reported in analysis of available NFHS data and census.2 Cities have high infertility and low TFR clearly illustrating negative correlation.22,30 TFR seems to be perfect proxy of family planning services rather than infertility.
The investigators studied correlation between number of IVF centers per hundred thousand population and prevalence of infertility, assuming that the supply may be proportionate to the need. There was no correlation between number of IVF centers and infertility in the community. The non-existence of correlation may be due to various factors. The foremost reason may be incomplete information about number of IVF centers. But it seems unlikely in present context because the information was compiled from multiple sources. A functioning center is most likely to be recorded from one source at least. Even if such un-noticed center exists, the number of beneficiaries is not likely to be very high to influence statistics. The number of centers is the result of interactions of at least three factors; need, demand and economic sustainability. Any condition affecting any of these factors may result in sparse scatter and also the poor correlation. The finding suggests that rather than need, limited demand and sustainability are responsible for absence of correlation.
North-Western states and about a decade later in Southern States. The decline in CSR followed the same trend.4 Generally sex ratio at birth favors females in adverse socio-environmental conditions.33 The sex ratio at birth is also affected by the different IVF laboratory techniques but overall it favors males.34-37 It has been attributed to excess female embryo mortality ratio.33 Similar observation was also reported from Japan. Only in China there was no difference in sex ratio at birth between children born normally and after IVF.38 We also received similar response from the interview. There is no clinical preference to any sex excepting where father is having hemophilia. The couple and service provider may opt for female sex. Review of such reports and articles is certainly essential because the number of children born through IVF is increasing. It is estimated that about 1% births in USA are through assisted reproductive techniques.35 It observed that only 1% couple seek services. Out of that 25% avail IVF services. The estimate of couples availing IVF services from India is about 65000. Considering present birth rate of 17.1/1000 and success rate about 30%; only 22000 births (0.02%) are product of IVF.39 In future in India also the number will considerably increase. It is estimated that infertility, couples seeking treatment and availing IVF services will increase substantially.39 In the present study sex ratio at birth is not showing correlation with number of IVF centers. The higher numbers of IVF centers is probably the result of factors operating since long time and same factors are responsible for decline of population sex ratio. Another reason may be differential distribution of availability of techniques which are capable of sex selection among existing IVF centers. Hence the theoretical reason could be proportion of IVF centers conducting procedure of sex selection among overall number which may be different in various districts. But there is no logical and convincing reason to presume unequal proportion. It was also noted that among the districts having IVF centers, Beed district has lowest population and the district is having the lowest child sex ratio.
The cost of IVF is very high.25,26 The respondent in the in-depth interview stated that one cycle can cost about Rs.0.1 to 0.2 million ($ 1,600-2,000). High cost rather than un-awareness was one the affecting factors for IVF utilization; it may be prohibitively expensive.14,40 Admitting the un-affordability and low probability of receiving any financial support from insurance, even modified techniques also have been suggested.41 The reason for absence of expected correlation between IVF centers and various factors may also be un-affordability of the procedure. Authors calculated correlation between per capita income in the form of Net District Domestic Product and IVF centers. The correlation between these two variables is significant. There is also significant correlation between number of IVF centers and female literacy rate. The correlation is strongest between IVF centers and proportion of urbanization. It seems that factors related to urbanization, income and education
which are the most typical indicators of socio-economic status are playing major role in determining the density of IVF centers in the districts. Table 3 reveals that percentage of urbanization is directly proportional to income and female literacy and it is indirectly proportional to population sex ratio. The unexplainable relationship between IVF centers and population sex ratio may be clarified by correlation between urbanization and population sex ratio. The two districts of Mumbai Municipal Corporation are 100% urban and lowest two in population sex ratio. Table 4 clearly explains the relationships between variables. The number of IVF centers, density, income, urbanization, and population sex ratio form a group of interrelated variables. Similarly female literacy, TFR, and SRB form second group. Growth rate and CSR constitute third group whereas infertility behaves independently. The relationship or the effect of IVF on SRB can be clearly judged by mandating the ART providers to maintain and submit the record of the SRB after IVF. The sex ratio at birth after IVF is presently not available. It is generally accepted that unethical medical practices are existing and there is a need to regulate IVF centers.42
Limitations
The source is information is internet and other secondary sources hence the completeness is uncertain. Various types of procedures under assisted reproductive technology were not differentiated as the information was not available. Although in some districts there were no IVF centers we have calculated correlation coefficient. We carried out Principle Component Analysis for ten variables to define inter-related variables.
CONCLUSION
The number of IVF centers is not dependent on magnitude of infertility. It is not affecting sex ratio at birth or child sex ratio. The number of couples seeking sex selection may be meager and cost may a prohibitive factor. The density is proportional to urbanization, income, female literacy rate and is negatively related to population sex ratio. The density of IVF centers in the districts seems to be an outcome of extent of urbanization and this explains its correlation with other variables.
ACKNOWLEDGEMENTS
We thank Aruna Deshpande for helping in analysis.
Funding: No funding sources Conflict of interest: None declared Ethical approval: Not required
REFERENCES
2. Ram U. Childlessness and Its Consequences in India: Levels, Patterns and Differentials. International Institute for Population Sciences. 2006.
3. Cave-Browne, John. Indian infanticide: its origin, progress, and suppression. London: W. H. Allen & Co. 1857.
4. George SM. Female Infanticide in Tamil Nadu, India: From Recognition Back to Denial. The International Women's Health Movement
5. Nagarajan R, Mulay S. Ultrasound sonography centres and CSR across Maharashtra. Artha Vijnana. 2008;50(4):433-48.
6. Office of the Registrar General & Census Commissioner, India. Ministry of Home Affairs, Government of India.
7. Directorate of Economics and Statistics, Planning Department, Government of Maharashtra, Mumbai. Economic Survey of Maharashtra 2013-14. 2014. 8. Press Information Bureau Government of India
Ministry of Statistics & Programme
Implementation. Per Capita National Income. 2015. 9. International Institute for Population Sciences (IIPS) Mumbai. District Level Household and Facility Survey (DLHS-3), 2007-08: Maharashtra. 2010. 10. Deputy Registrar of Births and Deaths, Maharashtra.
Annual report of Survey of Causes of Death 2011. Pune. 2013.
11. Deputy Registrar of Births and Deaths, Maharashtra, Pune. Civil Registration System: Provisional Abstract-2012. 2013.
12. Office of the Registrar General, India Ministry of Home Affairs Government of India New Delhi. Sample Registration System Statistical Report 2012. 2013.
13. Gurunath S, Pandian Z, Anderson RA, Bhattacharya S. Defining infertility- a systematic review of
prevalence studies. Hum Reprod Update.
2011;17(5):575-88.
14. Nachtigall RD. International disparities in access to infertility services. Fertil Steril. 2006;85(4):871-5.
15. ESHRE Capri Workshop Group. Social
determinants of human reproduction. Hum Reprod. 2001;16(7):1518-26.
16. Boivin J, Bunting L, Collins JA, Nygren KG. International estimates of infertility prevalence and treatment-seeking: potential need and demand for
infertility medical care. Hum Reprod.
2007;22(6):1506-12.
17. Chandra A, Copen CE. Infertility and impaired fecundity in the United States, 1982-2010: data from the National Survey of Family Growth. Natl Health Stat Rep. 2013;67:1-19.
18. Gaur DS, Talekar MS, Pathak VP. Alcohol intake and cigarette smoking: impact of two major lifestyle factors on male fertility. Indian J Pathol Microbiol. 2010;53(1):35-40.
19. Dama MS, Rajender S. Secular changes in the semen quality in India during the past 33 years. J Androl. 2012;33(4):740-4.
20. Wiener-Megnazi Z, Auslender R, Dirnfeld M. Advanced paternal age and reproductive outcome. Asian J Androl 2012; 14(1):69-76.
21. Cocuzza M, Alvarenga C, Pagani R. The epidemiology and etiology of azoospermia. Clinics (Sao Paulo). 2013;68 (Suppl 1):15-26.
22. The Hindu, Chennai. Fertility has taken a dip in South India: Survey. 2013, September 21.
23. Shamila S, Sasikala SL. Primary report on the risk factors affecting female infertility in South Indian districts of Tamil Nadu and Kerala. Indian J Community Med. 2011;36:59-61.
24. Adamson PC, Krupp K, Freeman AH, Klausner JD, Reingold AL, Madhivanan P. Prevalence & correlates of primary infertility among young women in Mysore, India. Indian J Med Res. 2011;134:440-6.
25. United Nations Population Fund. Prevention and Management of Fertility in Primary Healthcare Settings: An Information Booklet for Policy Planners, Program Managers and Service Providers in Healthcare Systems. 2003.
26. Kamel RM. Management of the infertile couple: an evidence-based protocol. Reprod Biol Endocrinol. 2010;8:21.
27. Puri CP, Hinduja I, Zaveri K. Need and feasibility of providing assisted technologies for infertility management in resource poor settings. ICMR Bulletin. 2000;30(6-7):55-62.
28. Parikh F. Sex-selection by IVF: detrimental to Indian women. Indian J Med Ethics. 1998;6(2):55. 29. Times of India. TNN. To ensure prized baby boy,
Indians flock to Bangkok. 2012, December 27. 30. Basu M. Falling total fertility rate in Kolkata sets
alarm bells ringing. Live Mint, December 25 2014. 31. Gentleman A. India's lost daughters: Abortion toll in
millions. The New York Times January 9, 2006. 32. Jha P, Kumar R, Vasa P, Dhingra N, Thiruchelvam
D, Moineddin R. Low female-to-male sex ratio of children born in India: national survey of 1.1 million households. Lancet. 2006;367(9506):211-8.
33. Trivers RL, Willard DE. Natural selection of parental ability to vary the sex ratio of offspring. Science. 1973;179(4068):90-2.
34. Dean JH, Chapman MG, Sullivan EA. The effect on human SRB by assisted reproductive technology (ART) procedures-an assessment of babies born following single embryo transfers, Australia and
New Zealand, 2002-2006. BJOG.
2010;117(13):1628-34.
35. Tarín JJ, García-Pérez MA, Hermenegildo C, Cano A. Changes in sex ratio from fertilization to birth in assisted-reproductive-treatment cycles. Reprod Biol Endocrinol. 2014;12:56.
37. Maalouf WE, Mincheva MN, Campbell BK, Hardy IC. Effects of assisted reproductive technologies on human sex ratio at birth. Fertil Steril. 2014;101(5):1321-5.
38. Bu Z, Chen ZJ, Huang G, Zhang H, Wu Q, Ma Y, et al. Live birth sex ratio after in vitro fertilization and embryo transfer in china - an analysis of 121,247
babies from 18 centers. PLoS One.
2014;9(11):e113522.
39. Palash IVF. The IVF Treatment Market in India. Available at: https://palashivf.com/2017/02/21/ivf-treatment-market-india/. Accessed 29 October 2018. 40. Okafor NI, Ezeah P, Udeobasi O. Factors Affecting the Use of In-Vitro Fertilization (IVF) among Married Couples in Anambra State, Nigeria. Int J Innova Res Dev. 2015;4(9):10-8.
41. Aleyamma TK, Kamath MS, Muthukumar K,
Mangalaraj AM, George K. Affordable ART: a
different perspective. Hum Reprod.
2011;26(12):3312-8.
42. Nadimpally S, Marwha V, Shenoy A. Globalization of birth markets: a case study of assisted reproductive technologies in India. Globalization and Health. 2011;7:27.