Rice plant pattern as predictor of the milling and
cooking quality in breeding programs
Clemente Ortiz-Romero1,4, Ana Sofia Almeida1*, Shivani Pathania1, Cátia Silva1, Diana Lourenço1, Jorge Oliveira2, 3, Carla Brites1
1Instituto Nacional de Investigação Agrária e Veterinária (INIAV), Av. da República, Quinta do Marquês, 2780-157 Oeiras, Portugal, 2University College Cork, School of Engineering, Colege Road, Cork, Ireland, 3Ernesto Morgado, S.A., Rua Prof. Casimiro de Oliveira, 21, Barra, 3090-833 Alqueidão, Figueira da Foz, Portugal, 4Instituto de Investigación y Formación Agroalimentaria y Pesquera de Andalucía (IFAPA), Avenida de Grecia s/n 41012 Sevilla, Spain
*Corresponding author:
Ana Sofia Almeida, Instituto Nacional de Investigação Agrária e Veterinária (INIAV), Av. da República, Quinta do Marquês, 2780-157 Oeiras, Portugal. E-mail: [email protected]
Received: 28 February 2018; Accepted: 31 May 2018
INTRODUCTION
The world faces huge challenges, such as population expansion, climate change and degradation of environmental resources. Hence, more sustainable rice production systems with improved rice productivity and quality are a main objective for breeders across the globe (Global Rice Science Partnership, 2010).
The effect of climate change decreases rice yield and rice quality, is a challenge to increasing rice production needed to face growing world population (Peng et al., 2004; Welch et al. 2010). There is a constant increase in mean global air temperature by 0.3 to 0.6°C (Nichols et al., 1995). Higher minimum temperature reduces rice yield due to higher loss of carbon through increased respiration (Zisca and Bunce 1998). In opposition, higher maximum temperature has been shown to raise yield (Welch et al., 2010). High temperature will increase chalkiness, causing grains to break during dehulling and polishing, and consequently
decreasing the amount of acceptable and marketable polished rice (Fitzgerald and Resurreccion, 2009), opposing any yield gain.
European and global breeding programs are focused on
creating varieties able to fit the needs of rice farmers for
good agronomic performance resulting on high yield, of industry for high milling yields and uniformity and consistency over the years, and of end consumers for cooking and sensory qualities. The trade liberalization has favored the change in consumption or cultivation of rice
Japonica subspecies for imported Indica subspecies; and, in parallel, an increased demand for exotic types of rice and even for pre-prepared meals (Fernandes and Correia 2012). The trend has been seen in countries like Italy, Spain and Portugal. Portugal has the highest per capita rice consumption in Europe, with 15 kg/inhabitant/year (MADRP, 2007). The global market tends to favor the long-grain varieties Indica-type whereas European preferences include consumption and cultivation of Japonica varieties
An appropriate characterization of agronomic and quality traits is a fundamental tool for selecting stable genotypes suitable to be registered as new varieties. The objective of this work was to evaluate agronomic and quality traits of rice germplasm tested in two consecutive years for 23 advanced lines of Portuguese Rice Breeding Program and 3 commercial varieties. The influence of genotype, year and their interaction on grain yield and milling yield, grain uniformity and selected quality indicators for rice was assessed as well as the correlations between the agronomic, biometric and quality parameters. Results showed a generally dominant influence of the genotype, but with some quality parameters significantly affected by year conditions, and with some genotypes more stable than others. Some accessions have also shown better grain biometric uniformity within a year and between years. Significant correlations between quality and agronomic parameters that were observed may mark a plant pattern that can be used as predictor of the milling yield. These analyses provide objective tools for selecting most promising genotypes in rice breeding programs.
Keywords: Industrial quality; Rice breeding; Screening tests; Stable genotypes
A B S T R A C T
http://www.ejfa.me/
to cover the demand of traditional dishes like paellas, arrozes, risottos or carolinos (Calingacion et al. 2014). Carolino rices are commercially classified as long grains (type-A)
and adapted varieties play a vital role for Portuguese rice chain sustainability (Oliveira et al. 2015). The marketing value of rice depends primarily on its physical integrity and chemical qualities after harvesting as well as consumer acceptance. Genotypes with strong uniformity and stability of grain biometrics, like grain length, also tend to be better considered in the rice market, and their suitability to be registered as new varieties will be greater too when they are evaluated by the DUS (distinctness, uniformity and stability) tests (Subba Rao et al. 2013; Pourabed et al. 2015). Frequency distribution analysis of biometric data can be a good indicator of the uniformity of a given rice genotype.
Several correlations among agronomic and quality traits have been found (Ahmad et al. 2009; Hasnain and Ali 2013; Arulmozhi and Muthuswamy 2013; Lee et al. 2013; Ali et al.
2014). Although they can vary significantly among different authors, depending on the tested varieties and the specificity
of each environment, they can be used as indicator for quality preselection of rice populations (Moreira et al. 2014).
The present study was developed in the framework of the Portuguese Rice Breeding Program led by INIAV (National Institute for Agricultural and Veterinary Research) and COTARROZ (Rice Operative and Technological Center, Portugal) to create new adapted varieties with improved agronomic and nutritional traits suitable to local conditions, while also taking into account consumer preferences, an example of a modern breeding program with a whole chain approach from farm to fork.
The objective of the present study was to test new varieties for stability, with successful commercial ones used for comparison, illustrating how the methodology can be used to select advanced lines in breeding programs with a whole chain approach. This implies to ascertain the effect of agronomic characteristics viz. genotype, year and their
interaction, on agronomic parameters (field data), grain
biometrics (paddy and milled) and its uniformity (size distributions), and quality traits (amylose content and viscosity data) indicative of cooking behavior. Potential correlations between the parameters that could form the basis for predictors of potential yields were also assessed.
MATERIALS AND METHODS
Plant materials
Twenty six genotypes of rice (Oryza sativa L.) were selected for the present study (Table 1). Within these genotypes, 23 are advanced lines resulting from crosses made in the
Portuguese Rice Breeding Program, framing four genotypic clusters and including sister lines. Each breeding advanced line was assigned its unique code. Three internationally available commercial varieties that are successful among Portuguese farmers were also tested for comparison: Ariete, Gladio and Ronaldo.
Growth conditions
Rice genotypes were grown in field trials during 2012 and
2013 seasons at the same location, on the rice experiment station of COTARROZ, located at Salvaterra de Magos
(CO) in Tejo/Sorraia region, in field plots with the same
cultivation methods. The genotypes were sown in a randomized block design with three replicate plots per accession. The plots were 8 m length by 1.2 m width, so 9.6 m2. The localization and description of experimental
field and crop management conditions are detailed in
Table 2.
Sowing was carried out on May 29th in 2012 and May 13th in
2013, with a density of 400 grains per m2; while harvesting
took place in October 30th and October 15th, respectively.
The total nitrogen applied was the same in both years: 115.5 kg N/ha. Also, two herbicide applications were
carried out in June in both years. Continuous flooding was
the irrigation method chosen.
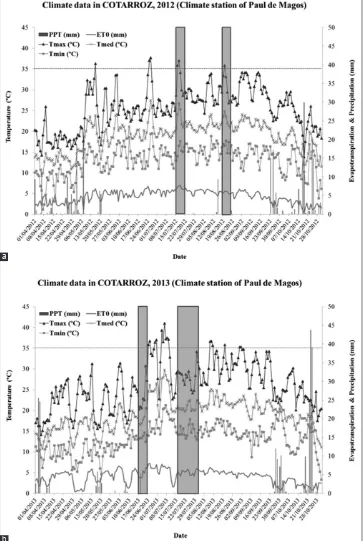
With respect to environmental conditions in experimental site, the average temperature in rice season for 2012 was 20.1 °C,with a cumulative precipitation of 154.2 mm (Fig. 1a) while in 2013, the average temperature during rice season was 20.2 °C and the precipitation 75.4 mm (Fig. 1b).
Data collection and measured parameters
The 26 genotypes from the three field replications and two
years were characterized by 3 groups of traits: agronomic (including biometry of paddy grain), milling (including biometry of milled kernels) and cooking quality (potential indicators), as summarized in Table 3.
Agronomic and paddy grain biometric traits were chosen as per Yousefnia et al. (2012). TGW was counted on Numigral (Chopin Technologies, France). The mature crop was harvested manually and a sample of 500 g of grain paddy from each genotype was collected. Biometric analyses of the paddy rice grains were evaluated in 50 g by using an automatic S21 apparatus and software (Suzuki, Brasil). The digital images of an average of 700 grains for each sample were analyzed.
Table 1: Genotypes codes and germplasm genealogy
No Genotype code Genealogy (crossing origin)
1 OP 1001 Basmati C. 621 x Lido
2 OP 1004 Italpatna x Milyang 43 580/99 04BB3
3 OP 1101 Lido x VB 7
4 OP 1102 Lido x VB 7
5 OP 1103 Lido x VB 7
6 OP 1104 Lido x VB 7
7 OP 1105 Safari x VB 7
8 OP 1109 Estrela A x IR 72
9 OP 1201 (Regina x Delta 04BB) X (Estrela A x Suweon 285 x Basmati 621 04BB1)
10 OP 1202 (Regina x Delta 04BB) X (Estrela A x Suweon 285 x Basmati 621 04BB1)
11 OP 1203 (Regina x Delta 04BB) X (Estrela A x Suweon 285 x Basmati 621 04BB1)
12 OP 1205 (Feronio x VB 7) x Zeus
13 OP 1206 (Feronio x VB 7) x Zeus
14 OP 1207 (Feronio x VB 7) x Zeus
15 OP 1209 (Lido x VB 1-26) x Bravo
16 OP 1210 (Lido x VB 7) x Arelate
17 OP 1211 (Lido x VB 7) x Arelate
18 OP 1212 (Valtejo x VB1-26) x (Onda x Estrela A 04 BB 3)
19 OP 1216 Lido x VB 7
20 OP 1217 Lido x VB 7
21 OP 1224 Lido x VB 7
22 OP 1225 Lido x VB 7
23 OP 1227 Oscar x Suweon 285 319/88-4-11SM-01
24 Ariete Ariete
25 Gladio Gladio
26 Ronaldo Ronaldo
Table 2: Localization and description of experimental field and crop management details
Site COTARROZ (Salvaterra de Magos)
Coordinates 39°26’ N, 008°78’ W
Altitude (m asl) 19
Soil conditions (0‑20 cm, 2012) Units Results Interpretation
Texture Sandy loam Coarse soil
Ext. P (P2O5) mg/kg 79 Medium content
Ext. K (K2O) mg/kg 34 Low content
Ext. Mg mg/kg 106 High content
O.M. % 0.81 Low content
pH (H2O) a) 5.7 Slightly acid
Ca (CaCO3) t/ha 0
Total N % 0.036 Very low
content
Harvest year 2012 2013
Fertilizer application (kg N ha‑1) 115.5 115.5
Seed bed 60 60
Top dressing 55.5 55.5
Sowing date 29th May 13th May
Herbicide application (Propanol) 11+9 l/ha 11+9 l/ha
Harvesting date 30th October 15th October
Environmental conditions
ETo (mm) 704.8 700.2
PPT (mm) 154.2 75.4
Tmax (°C) 27.3 27.8
Tmed (°C) 20.1 20.2
Tmin (°C) 14.0 14.1
ETo: cumulative evapotranspiration from sowing to harvesting during each year; PPT: cumulative precipitation from sowing to harvesting during each year;
by its middle point and the data composed by the weight in gram of each class.
The three field replicates were pooled for the milling and
quality analysis. Paddy samples were dehusked in a Satake mill (THU, Satake, Taito, Japan) and polished (Suzuki
MT-98, Santa Cruz do Rio Pardo, São Paulo, Brazil) for assessing milling yields, biometric data and quality traits of the milled rice. The potential yield of husked rice (MY) was determined according to ISO 6646, 2011. Biometric analysis of the polished grain was performed as for paddy samples. The amylose content was determined by Fig 1. Distribution of temperature (ºC), evapotranspitation (mm) and precipitation (mm) during the years 2012 (a) and 2013 (b). Genotypes period
for panicle initiation (left) and heading time (right) are highlighted by the two shaded areas. ETo: evapotranspiration; PPT: precipitation; Tmed: mean
daily temperature; Tmax and Tmin: daily maximum and minimum temperatures.
a
a colorimetric technique and ISO 6647-2, 2015 method. The determination of rice paste gelatinization and viscosity characteristics was performed by a rapid viscosity analyzer (RVA-4, Newport Scientific, Warriewood, Australia) following AACC International Approved Method 61-02.01.
Data analysis
A two-way Analysis of Variance (ANOVA) was used to test
the significance of the main effects of genotype and year and
of their interactive effect on the agronomic, milling and quality traits. For stability analysis, genotype is a control factor and year is a noise factor. The interactive effect is very important
to select varieties, as when it is significant it means that some
genotypes were more affected by the noise factor (year) than others. A one-way ANOVA for each variety in the case where
interactive effects were significant was used to specify which
varieties were stable (not affected by year variability).
The genotypes were also grouped with a post-hoc analysis (averages of both years) using Fisher’s Least
Significant Difference (LSD) to compare means and define
homogeneous groups.
The paddy grain biometric uniformity of each genotype
was evaluated by fitting standard frequency distributions
(Normal and Weibull) to the pGL and pGW data and
the goodness of fit was quantified by the coefficient of
determination (R2). The distribution parameters, namely
mean, standard deviation, skewness (asymmetry around the mean - a value equal to 0 for a normal distribution) and kurtosis (peakedness of the distribution - the excess kurtosis is 0 for a normal distribution) were also calculated from the raw data. If a distribution is close to normal,
then the best uniformity is quantified simply by the lowest
standard deviation.
Correlations between the measured traits (Table 3) were
first identified for every pair with Pearson’s correlation coefficients. Principal Component Analysis was also applied to the milling and quality data to define a quality space to
analyze stability (variability of quality traits over the years) by the Euclidean Distance (ED) between the 3 scores of PC1, PC2 and PC3 in the two years, this being the square root of the sums of the squared differences:
(
) (
)
(
)
− + −
=
+ −
2 2
20 12 20 13 20 12 20 13
2
20 12 20 13
1 1 2 2
3 3
S S S S
ED
S S
Where S1, S2 and S3 are the scores of PC1, 2 and 3, respectively.
All statistical analyses were performed with “Statistix 9.0”.
RESULTS
Environmental conditions
Minimum temperatures during plants emergence period were considerable lower in 2013 (9.8°C) compared with 2012 (14.5°C), resulting in more constraints in plant emergence in 2013 and, consequently, on a lower density of emerged plants compared with 2012. The period between emergence and panicle initiation (Fig. 1) was colder in 2013 compared with 2012 (minimum temperatures average of 11.4°C and 14.5°C, respectively). Panicle initiation in 2012 occurred about 30 days later with higher maximum temperatures (30.2°C on average) compared to 2013 (27.9°C on average). Furthermore, in 2012 heading and anthesis occurred in a period with higher temperatures (30.2°C on average) compared with 2013 (27.9°C on average). Average daily maximum and
Table 3: Agronomic, biometric and quality traits measured
Group Code Trait
Agronomic PH
PM2 GP EG TGW GY pGL pGW pLW
Plant height
Number of panicles per m2
Number of grains per panicle Percentage of empty grains Thousand grain weight Grain yield (kg/ha) Grain length of paddy grain Grain width of paddy grain Length to width ratio of paddy grain
Milling kL
kW kLW gW gC dY MY
Grain length of milled kernel Grain width of milled kernel
Length to width ratio of milled kernel vitreous whiteness of the grain Area of chalkiness of grains
Dehusking yield
Overall milling yield (dehusking and polishing) Milling yield
Cooking
quality ACPV
BD SB
minimum temperatures during grain filling were higher in
2013 (30.6°C and 14.7°C) that in 2012 (28.3°C and 13.5°C).
The two years were therefore considered sufficiently distinct,
and representative of typical variability. Further details and implications regarding plant growth are discussed in section 4.
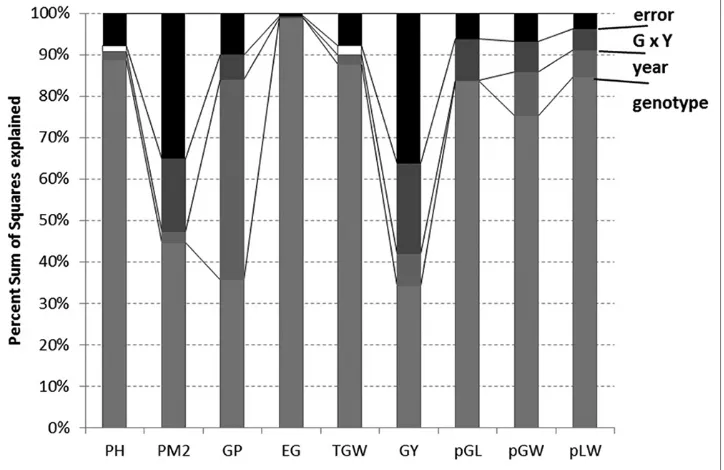
Effects of Genotype, Year and GxY interaction on total variability of agronomic and paddy grain biometric traits
Genotype and season growth conditions explain most of the variability observed (Fig. 2), with less than 10% of the total sum of squares unexplained by these effects, except the GY, GP (in both cases, the error was around 1/3 of the total sum of squares) and EG (error under 30% of the total). It can also be seen that the genotype is the most dominant effect causing differences in agronomic and
paddy characteristics, always showing a significant effect, except for GP, where year had a very significant effect,
even higher on average than that of the genotype. The
year had a statistically significant effect in all responses
(except EG, pGL, but in these cases the interactive effect
was significant), and only for PH and TGW this effect did not show a significant interaction with genotype. Results
showed that the differences between the two years vary for the 26 genotypes.
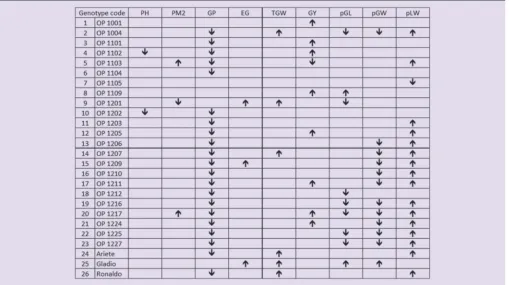
A one-way ANOVA was then applied for each variety to ascertain which were stable, and exhibited the same response in both years. Results are shown in Table 4. Stable genotypes for a particular trait have a blank cell in the table.
Those showing significant differences (at 95% confidence
level) are marked with an arrow (upwards meaning that the
response was significantly higher in 2013 than in 2012 and
downwards otherwise).
In Table 4, the results show that PH, EG and TGW were stable for most genotypes and the significant, albeit small, average effect is due to those that were quite significantly
affected by the year conditions. Considering PH, genotypes
4 and 10 were significantly smaller in 2013 year. Additionally, in 2013 genotypes 9, 15 and 25 showed significantly higher
percentage of empty grains, and genotypes 2, 9, 14, 24, 25 and 26 a higher grain weight. The other characteristic where year had an average small effect, PM2 had a similar situation with only 3 genotypes not being stable, 5 and 20 with higher PM2 in 2013 and genotype 9 higher in 2012; this opposite behavior of these 3 genotypes explains the
significance of the interactive effect.
The least stable characteristics were biometry, GP and GY.
GP showed a significant interactive effect because although
most genotypes had lower GP in 2013, genotypes 1, 7, 8, 9 and 25 were in fact stable. Regarding harvest yield, most genotypes had higher values in 2013, except genotype 5, which had lower, besides those that were stable. There were similar opposite behaviors in biometry of the paddy grains:
genotype 25 was the only that was significantly longer and
wider in 2013 than in 2012, genotype 8 was also longer in
2013, and genotype 7 the only to have a significantly lower
length to width ratio in 2013. The only genotypes fully stable in biometry (similar pGL, pGW and pLW in both years) were 1, 3, 4, 6 and 10. These were lines containing the Basmati C. 621 and/or the Lido parentage (among others). Interestingly, none of the commercial varieties
performed so well regarding consistency of biometry, with genotype 25, the variety Gladio, being particularly variable. This is in agreement with local knowledge, as it is considered that this variety shows biometry of indica grains in some years, but not in others.
Genotypes 1, 6 and 7 were quite stable, the former only
had a significantly higher yield in 2013 than 2012, the
middle one had just a lower number of grains per panicle
in 2013 and the latter a significantly lower length to width
ratio of the paddy grains in 2013 than 2012, all other responses were consistent. Genotype 1 had Basmati and Lido parentage, the latter variety being a parentage of genotype 6 as well, together with VB7, a parent shared by genotype 7 (plus Safari), but many others with these parentages did not show such a high consistency. It is also noted that genotypes 3, 4, 5, 6, 19, 20, 21 and 22 all have the same parents but different stability of the agronomic and biometric characteristics over different years. Therefore, there is an element of chance in the combination of the DNA of parents in reaching a particular consistency to growth conditions.
Genotypes 2, 4, 5, 9, 10 and 20 can be considered the
most variable because they show significant differences
in the 2 years even in traits where most other genotypes were stable. It is noted that this analysis of stability is not
desirability, as it gives equal weight to all responses and the biometry is analysed only in terms of the average sizes, whereas uniformity in size is very important for quality. High production yields and high uniformity as well as stability of sizes are more desired traits than others. These were; therefore, need to be considered in more detail.
Variance of means according to the Genotype Tables 5(a), 5(b) and 5(c) show the means for all agronomic and biometric paddy grain traits for the 26 genotypes, with the homogeneous groupings according to Fisher’s Least
Significant Difference (L.S.D.) used to identify significant
differences. The greatest variation was observed for EG
with a coefficient of variation (C.V.) of 37%. Paddy grain
length has shown the lowest variation, with a C.V. of just over 1%. It is noted that this table pools together the values of the two different years, and therefore the subsequent comments are particularly accurate the more stable genotype. This pooling is however fairly accurate as
the only case where the year has a very significant impact,
which is the GP value, showed all genotypes with a similar trend, a lower value in 2013 (except those that were stable,
as identified previously).
There were some sister lines as identified in Table 1, and
just as they showed different stability, they also show
significant differences between them in the actual values
Table 4: Stability of the agronomic and paddy grain biometry characteristics to different year growth conditions, assessed by one‑way ANOVAs at 95% confidence level
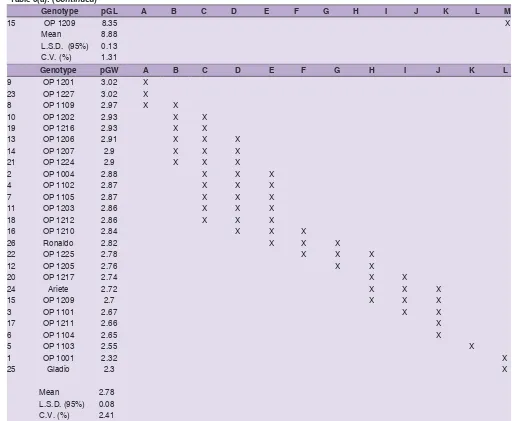
Table 5(a): Means, their comparison with the Fisher’s least significant difference (LSD) and coefficient of variation (CV) for GY (kg/ ha), pGL (mm) pGW (mm) and pLW
Genotype GY A B C D E F
9 OP 1201 8049 X
18 OP 1212 7811 X X
11 OP 1203 7393 X X X
23 OP 1227 7252 X X X X
2 OP 1004 7022 X X X X X
10 OP 1202 6919 X X X X X
21 OP 1224 6763 X X X X X X
20 OP 1217 6757 X X X X X X
15 OP 1209 6672 X X X X X
26 Ronaldo 6536 X X X X X
24 Ariete 6414 X X X X X
1 OP 1001 6408 X X X X X
22 OP 1225 6215 X X X X
14 OP 1207 6194 X X X X
17 OP 1211 6135 X X X X
7 OP 1105 6015 X X X X
25 Gladio 6014 X X X
16 OP 1210 5958 X X X
3 OP 1101 5957 X X X
6 OP 1104 5948 X X X
8 OP 1109 5865 X X
4 OP 1102 5769 X X
19 OP 1216 5714 X X
13 OP 1206 5553 X X
12 OP 1205 5504 X
5 OP 1103 5270 X
Mean 6426
L.S.D. (95%) 1341.1-1642.5
C.V. (%) 18.24
Genotype pGL A B C D E F G H I J K L M
14 OP 1207 9.54 X
17 OP 1211 9.54 X
19 OP 1216 9.39 X
4 OP 1102 9.37 X
10 OP 1202 9.31 X X
21 OP 1224 9.23 X
11 OP 1203 9.03 X
3 OP 1101 9 X
13 OP 1206 9 X
7 OP 1105 8.94 X X
25 Gladio 8.91 X X
16 OP 1210 8.84 X X
12 OP 1205 8.83 X X X
1 OP 1001 8.82 X X X
5 OP 1103 8.82 X X X
2 OP 1004 8.76 X X X
9 OP 1201 8.75 X X X
6 OP 1104 8.71 X X X
23 OP 1227 8.66 X X X
24 Ariete 8.61 X X X
18 OP 1212 8.56 X X
8 OP 1109 8.53 X X
26 Ronaldo 8.49 X X
20 OP 1217 8.39 X X
22 OP 1225 8.38 X X
of the agronomic and paddy biometry traits. The biometric parameters pGL, pGW and pLW had a high heterogeneity among genotypes obtained from the same cross. The pLW values of 8 genotypes derived from “Lido x VB 7” parents
ranged from 3.03 to 3.47 which were significantly different
from each other. OP1202 and OP1203 (genotypes 10 and 11) were the only sister lines with similar pGW and pLW values.
Genotypes 2, 9, 10, 11, 18 and 23 would be the most attractive from the production point of view. As shown in Tables 5(b) and 5(c), these all happened to have been genotypes that were also consistent over the 2 years. However, in terms of biometry genotype 10 (OP1202)
was both significantly longer and significantly wider grains
with stability in both years, with genotypes 2 (OP1004)
and 23 (OP1227) having shown significantly different
dimensions in the 2 years. Thus, in terms of the most
important field characteristics and stability, the OP1202 variety would have been identified as the best performer,
despite their high plant height when compared with commercial varieties.
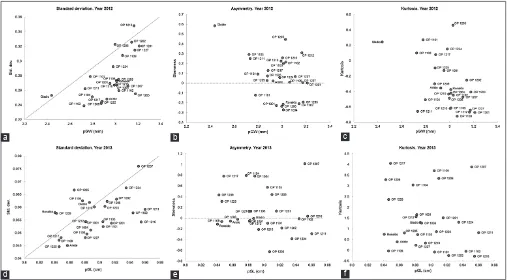
Uniformity of paddy grain length (pGL)
Figure 3(a) shows the uniformity of sizes of the paddy
grain length in 2 years. Each sample was fitted to a Normal
and a Weibull distribution, in case it would be found that the normal distribution was not applicable. However, the normal distribution was indeed appropriate for all but exceptions are OP1201 and OP1212 in the 2012 harvest. Sizes will be more uniform as standard deviation was lower and kurtosis was higher, although it should be noted that standard deviations would be higher for larger sizes simply due to the effect of shift of mean.
Genotype pGL A B C D E F G H I J K L M
15 OP 1209 8.35 X
Mean 8.88
L.S.D. (95%) 0.13
C.V. (%) 1.31
Genotype pGW A B C D E F G H I J K L
9 OP 1201 3.02 X
23 OP 1227 3.02 X
8 OP 1109 2.97 X X
10 OP 1202 2.93 X X
19 OP 1216 2.93 X X
13 OP 1206 2.91 X X X
14 OP 1207 2.9 X X X
21 OP 1224 2.9 X X X
2 OP 1004 2.88 X X X
4 OP 1102 2.87 X X X
7 OP 1105 2.87 X X X
11 OP 1203 2.86 X X X
18 OP 1212 2.86 X X X
16 OP 1210 2.84 X X X
26 Ronaldo 2.82 X X X
22 OP 1225 2.78 X X X
12 OP 1205 2.76 X X
20 OP 1217 2.74 X X
24 Ariete 2.72 X X X
15 OP 1209 2.7 X X X
3 OP 1101 2.67 X X
17 OP 1211 2.66 X
6 OP 1104 2.65 X
5 OP 1103 2.55 X
1 OP 1001 2.32 X
25 Gladio 2.3 X
Mean 2.78
L.S.D. (95%) 0.08
C.V. (%) 2.41
Different letters represent significant differences (p < 0.05). Thick lines divide groups that are significantly different from the highest or lowest value, or that are significantly different from others (no overlapping of homogeneous groups).
Table 5(b): Parameters’ means ‑ Comparison with the Fisher’s least significant difference (LSD) and coefficient of variation (C.V.) for pLW, PH (cm) and PM2
Genotype pLW A B C D E F G H I J K L M N O P Q R
25 Gladio 3.88 X
1 OP 1001 3.8 X
17 OP 1211 3.59 X
5 OP 1103 3.47 X
3 OP 1101 3.38 X
6 OP 1104 3.3 X
14 OP 1207 3.29 X X
4 OP 1102 3.27 X X X
12 OP 1205 3.21 X X
19 OP 1216 3.21 X X X
10 OP 1202 3.18 X X
21 OP 1224 3.18 X X
24 Ariete 3.17 X X X
11 OP 1203 3.16 X X X X
7 OP 1105 3.12 X X X X
16 OP 1210 3.11 X X X X X
13 OP 1206 3.1 X X X X X
15 OP 1209 3.09 X X X X
20 OP 1217 3.07 X X X X
2 OP 1004 3.04 X X X X
22 OP 1225 3.03 X X X
26 Ronaldo 3.01 X X
18 OP 1212 2.99 X
9 OP 1201 2.9 X
8 OP 1109 2.88 X
23 OP 1227 2.87 X
Mean 3.2
L.S.D.
(95%) 0.07
C.V. (%) 2.02
Genotype PH A B C D E F G H I J K
2 OP 1004 105.6 X
23 OP 1227 100.2 X
11 OP 1203 93.3 X
7 OP 1105 91.7 X
18 OP 1212 90.5 X
10 OP 1202 89.8 X X
24 Ariete 85.1 X X
9 OP 1201 84.9 X X
15 OP 1209 81.5 X X
3 OP 1101 80.8 X X
6 OP 1104 77.7 X X
5 OP 1103 77.3 X X
13 OP 1206 75.3 X X
14 OP 1207 75.2 X X X
12 OP 1205 73.9 X X X
20 OP 1217 71.6 X X X
22 OP 1225 70.9 X X X
21 OP 1224 70.6 X X X
8 OP 1109 70.3 X X
4 OP 1102 68.2 X
26 Ronaldo 67.8 X
19 OP 1216 67.2 X
17 OP 1211 66.8 X
25 Gladio 66.7 X
Figure 3(a) shows standard deviations versus length: the longer the grain and smaller the standard deviation, the more uniform are sizes. Given that genotype OP1211 is among the longest (see Table 5a), its low standard
deviation quantifies a particularly good uniformity.
One should also consider the kurtosis, and for this
variety it is not significantly different from a normal
distribution, so this is a very uniform variety. However,
it has significantly lower yields than OP1202, the most
stable variety with high yield. OP1202 also shows a good uniformity, with low (2012) to average (2013) standard deviation compared to size and among the lowest kurtosis, but still close to that of a normal distribution. The distribution is also very symmetrical, with skewness values close to 0.
Of the smallest varieties, genotypes OP1225 and OP1217 were also consistent in providing low spreads (standard deviations) in both years, however, both showed a fairly high kurtosis in 2013, although not in 2012 - however, as shown in Table 5, the actual average sizes were significantly
different in 2 years, so these varieties do not show uniformity with consistency.
Uniformity of paddy grain width (pGW)
The fit of experimental values of the size distributions
of paddy grain width to a normal distribution were all acceptable. Figure 3(b) shows the actual values of standard deviation, skewness and kurtosis.
The commercial variety Ariete shows smallest spread in both years. Gladio shows the most deviated behaviour
Genotype PH A B C D E F G H I J K
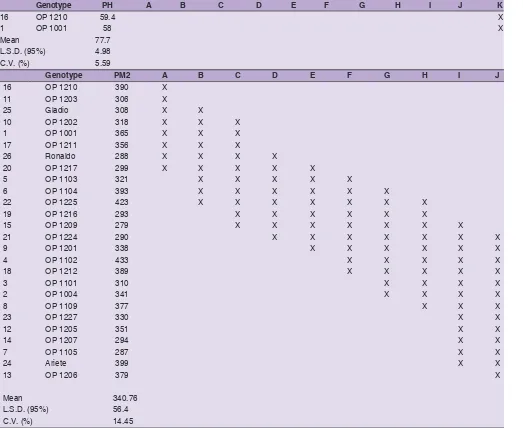
16 OP 1210 59.4 X
1 OP 1001 58 X
Mean 77.7
L.S.D. (95%) 4.98
C.V. (%) 5.59
Genotype PM2 A B C D E F G H I J
16 OP 1210 390 X
11 OP 1203 306 X
25 Gladio 308 X X
10 OP 1202 318 X X X
1 OP 1001 365 X X X
17 OP 1211 356 X X X
26 Ronaldo 288 X X X X
20 OP 1217 299 X X X X X
5 OP 1103 321 X X X X X
6 OP 1104 393 X X X X X X
22 OP 1225 423 X X X X X X X
19 OP 1216 293 X X X X X X
15 OP 1209 279 X X X X X X X
21 OP 1224 290 X X X X X X X
9 OP 1201 338 X X X X X X
4 OP 1102 433 X X X X X
18 OP 1212 389 X X X X X
3 OP 1101 310 X X X X
2 OP 1004 341 X X X X
8 OP 1109 377 X X X
23 OP 1227 330 X X
12 OP 1205 351 X X
14 OP 1207 294 X X
7 OP 1105 287 X X
24 Ariete 399 X X
13 OP 1206 379 X
Mean 340.76
L.S.D. (95%) 56.4
C.V. (%) 14.45
Different letters represent significant differences (p < 0.05). Thick lines divide groups that are significantly different from the highest or lowest value, or that are significantly different from others (no overlapping of homogeneous groups)
Table 5(c): Parameters’ means ‑ Comparison with the Fisher’s least significant difference (LSD) and coefficient of variation (C.V.) for GP, EG and TGW (g)
Genotype GP A B C D E F G H I J K L M
15 OP 1209 106 X
23 OP 1227 100 X X
6 OP 1104 97 X X X
24 Ariete 92 X X X
3 OP 1101 91 X X X
12 OP 1205 90 X X X X
2 OP 1004 89 X X X
5 OP 1103 89 X X X
13 OP 1206 87 X X X X
18 OP 1212 85 X X X X
4 OP 1102 80 X X X X
20 OP 1217 79 X X X X
7 OP 1105 78 X X X X
22 OP 1225 77 X X X X
1 OP 1001 75 X X X
14 OP 1207 75 X X X
21 OP 1224 72 X X X
25 Gladio 72 X X X
19 OP 1216 71 X X X
26 Ronaldo 70 X X X
8 OP 1109 68 X X X
17 OP 1211 63 X X X
11 OP 1203 57 X X X
16 OP 1210 54 X X
10 OP 1202 53 X X
9 OP 1201 52 X
Mean 77.73
L.S.D. (95%) 10.74
C.V. (%) 12.06
Genotype EG A B C D E F G H I J K
4 OP 1102 28.2 X
7 OP 1105 24.6 X X
12 OP 1205 21.8 X X
19 OP 1216 19.2 X X X
21 OP 1224 18.8 X X X
13 OP 1206 18.1 X X X
1 OP 1001 17.9 X X X X
9 OP 1201 16.8 X X X X
14 OP 1207 16.7 X X X X
18 OP 1212 14.5 X X X X
25 Gladio 14.2 X X X X X
6 OP 1104 13.4 X X X X X
15 OP 1209 11.8 X X X X X
23 OP 1227 11 X X X X X
26 Ronaldo 10.4 X X X X X
3 OP 1101 10.1 X X X X X
5 OP 1103 9.5 X X X X X
10 OP 1202 8.9 X X X X
11 OP 1203 8.6 X X X
17 OP 1211 8.5 X X X
20 OP 1217 8.5 X X X
2 OP 1004 7.7 X X
22 OP 1225 7.7 X X
24 Ariete 7.6 X X
from a normal distribution, with high skewness and kurtosis.
OP1203 was the genotype with highest pGW (3.18 mm) and uniformity and OP1212 showed greater width variability (Fig. 3b). The OP1202 genotype, so far considered the best, balanced between high yield, uniformity and stability, had a high standard deviation in 2012 and low kurtosis, so it is not the most uniform variety regarding width.
Quality traits of polished grains
Dehusking yield (DY, percentage of brown rice after dehusking) was higher for OP1201, 1202, 1210 and 1227
(over 82%). OP1205 and OP1206 significantly performed
poorly with yields of 77%.
Total milling yield after polishing (MY, after removing bran and kernels with defects) was highest for the commercial Gladio variety, even though within the year variability, only
8 of the advanced lines have significantly lower values.
MY over 70% are considered good locally, with about 20% loss from dehusking and 10% from bran removal. The other commercial varieties performed equally well,
and the significantly lower values (compared to Gladio)
of OP’s 1102, 1201, 1206, 1207, 1209, 1216, 1217, 1224, 1227 would be a concern for farming yields, specially the latter two.
With respect to biometric analysis, OP1217 had minimum kL (5.53 mm) whereas OP1202 had maximum kL (6.33 mm). The shorter grains OP1217, OP1225, OP1209
Genotype EG A B C D E F G H I J K
8 OP 1109 6.6 X X
16 OP 1210 5.8 X
Mean 13.3
L.S.D. (95%) 5.63
C.V. (%) 36.92
Genotype TGW A B C D E F G H I J
10 OP 1202 36.4 X
19 OP 1216 34.7 X
9 OP 1201 34.5 X
11 OP 1203 34.5 X
4 OP 1102 34 X
21 OP 1224 33.8 X X
14 OP 1207 32.3 X X
8 OP 1109 32.2 X
23 OP 1227 32.2 X
26 Ronaldo 31.5 X
18 OP 1212 31 X
7 OP 1105 30.9 X
16 OP 1210 30.8 X
2 OP 1004 29 X
24 Ariete 29 X
13 OP 1206 28.4 X X
17 OP 1211 28.3 X X
12 OP 1205 27.4 X X
3 OP 1101 27.2 X X
6 OP 1104 26.7 X X
15 OP 1209 26.1 X X X
5 OP 1103 25.2 X X
25 Gladio 25.1 X
20 OP 1217 25 X
22 OP 1225 24.9 X
1 OP 1001 23 X
Mean 29.75
L.S.D. (95%) 1.55
C.V. (%) 4.54
Different letters represent significant differences (p < 0.05). Thick lines divide groups that are significantly different from the highest or lowest value, or that are significantly different from others (no overlapping of homogeneous groups).
and OP1109 were close to Ronaldo (5.64 mm). Gladio was among the longest (6.18 mm), like OP1203 (6.19 mm) and OP1216. Ariete showed a medium kL (5.85 mm), similar to
OP1103 and OP1104. According to the grain length data,
ten of the advanced lines could be classified as long grain
varieties and thirteen as medium.
Fig 3a.Frequency distribution parameters of the 26 genotypes for paddy grain length (pGL) in years 2012 and 2013: standard deviation (a,b), skewness (c,d) and kurtosis (e,f).
a
d
b
e
c
f
Fig 3b.Frequency distribution parameters of the 26 genotypes for paddy grain width (pGW) in years 2012 and 2013: standard deviation (a,b), skewness (c,d) and kurtosis (e,f).
a
d
b
e
c
Another important biometric parameter for classification
of rice varieties is L/W ratio. According to European
classification of rice, only one advanced line, OP1001, is a
long B variety (3.06), surpassed only by Gladio (3.20), while other advanced lines belonged to round category. Ronaldo had the lowest L/W, with OP1109 and 1227 similarly round. A critical quality attribute indicator of cooking behaviour is amylose content. Gladio outnumbered all the advanced genotypes with 30% amylose content. Most advanced lines exhibited AC lower than 20%, but OP 1001, 1004, 1105, 1201 and 1209 had means over 24% that were similar to Gladio when taking the yearly variability as source of error.
Pasting behavior of 26 genotypes depicted that Ronaldo and OP1210 have highest PV (3798 cP and 3651 cP, respectively) and BD (2153 cP and 2089 cP), and minimum SB (-808 cP and -802 cP). Gladio and OP1001 showed similar trends with high SB (1417 cP and 1591 cP, respectively) and low PV (2532 cP and 1964 cP) and BD (1118 cP and 786 cP).
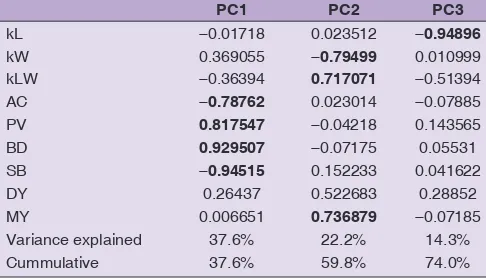
Principal component analysis of quality traits
A Principal Component Analysis with normalised Varimax rotation indicated that only 3 principal components had an eigenvalue above 1 (Scree plot not shown), explaining almost ¾ of the total variance of the data. Factor loadings (Table 6) show that the dominant parameters in the first
principal component (PC) were the viscosity parameters and the amylose content; the second PC was dominated by width, length-to-width ratio and total milling yield and the third by the kernel length.
The almost orthogonal relation between kernel length and L/W ratio is an interesting feature: the important L/W value is mostly dominated by width, not length. It is also generally expected that rice with high amylose content tends to have high length and L/W ratio but within these
genotypes, that broad relation was not verified, amylose
content relates quite well to the viscosity parameters, and
very poorly with the biometric parameters. Individual correlations will be analysed later in more detail with PLS regressions.
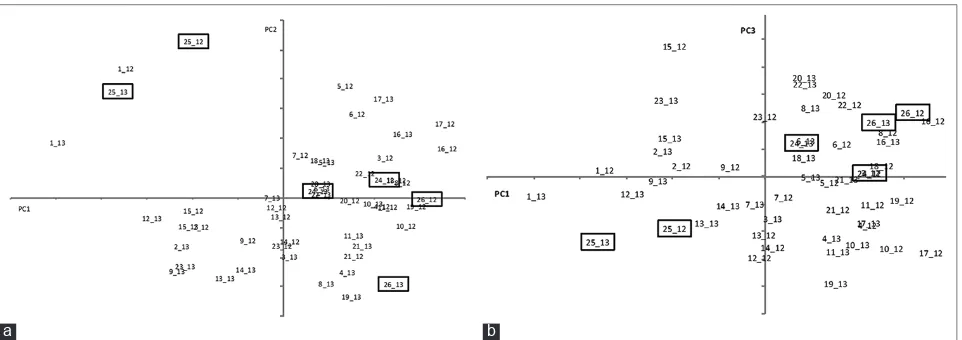
This pooling of the quality parameters with the linear
combinations defined by the scores in Table 6 permits a
representation of the quality space with two simple plots of the scores of the 3 PC for the different genotypes in the 2 different years in order to identify similarities and differences as well as stability (Fig. 4). The 3 commercial varieties are very distinctive, especially Gladio. The similarity between Gladio and OP1001 is evident in the fact that they are the only genotypes occupying the left upper quadrant in PC2 vs. PC1 graph, it is noted that this is the most meaningful of the 2 graphs, because PC2 and PC3 are both dominated by biometric parameters. The Ariete variety (24) is the closest to the center of both graphs. Advanced line OP1104 (6) is quite similar in both graphs, whereas OP1109 (8), OP1217 (20) and OP1225 (22) are very close in the PC2 vs. PC1 space. Variety Ronaldo is the furthest away from Gladio, in the diametrically opposite
quadrant, and showing a significant variability of PC2 in
the two years.
Correlations between agronomic, milling and quality parameters
Considering first the one-to-one relations, Pearson’s
correlation coefficients among agronomic and quality
traits for the 26 genotypes in 2012 and 2013 are presented (Table 7). PH correlated significantly (p < 0.05) with other
agronomic parameters and had positive correlation with GP, pGW and kW and was negatively correlated with PM2 and EG. PM2 and GP were negatively correlated
(-0.4903, p < 0.001). As expected, pGL, pGW, kL and
kW correlated positively with TGW. However, pLW had negative correlation with TGW values.
There were only six statistically significant one-to-one
correlations between quality parameters, as depicted in Table 7. AC correlated positively with kLW (p < 0.05) and SB (p < 0.001), and negatively with PV (p < 0.001) and BD (p < 0.001). BD had a positive correlation with PV (p < 0.001) and kW (p < 0.05). A positive correlation was observed between SB and kLW (p < 0.01). With regards
to PV values, an increase in kW increases PV by 0.3930
(p < 0.01). However, PV is negatively correlated with kLW
and an increase in kLW decreases PV by a value of 0.4914
(p < 0.001). kLW was significantly correlated with all the
quality parameters, followed by kW. This suggests the importance of kLW in rice varietal distinctions.
AC only significantly correlated with one of the agronomic parameters: EG (0.3098, p < 0.05). EG correlated with
other quality parameters, with a positive effect on AC kL
Table 6: Factor loadings of the 3 first principal components of a PCA of the quality and milling data with normalised Varimax rotation. Dominant factors are highlighted in bold
PC1 PC2 PC3
kL ‑0.01718 0.023512 ‑0.94896
kW 0.369055 ‑0.79499 0.010999
kLW ‑0.36394 0.717071 ‑0.51394
AC ‑0.78762 0.023014 ‑0.07885
PV 0.817547 ‑0.04218 0.143565
BD 0.929507 ‑0.07175 0.05531
SB ‑0.94515 0.152233 0.041622
DY 0.26437 0.522683 0.28852
MY 0.006651 0.736879 ‑0.07185
Variance explained 37.6% 22.2% 14.3%
and kLW and negative for BD and PV. GP was positively
correlated with SB (0.3135, p < 0.05) whereas a negative correlation was observed with kL (-0.2890, p < 0.05) and MY (-0.6010, p < 0.001). As expected, the paddy and
polished biometric parameters were highly correlated and the positive relation between pGW and kW was the
most significant (p < 0.001). TGW was an indicator of biometric and pasting behavior significantly influencing
pGL (0.2960), pGW (0.5844), kL (0.4386), kW (0.7999), kLW (-0.4678), PV (0.3281), BD (0.3231) and SB (-0.4846). However, MY and AC were not directly correlated to TGW.
DISCUSSION
The genotype was found to be the dominant influence on
total variability of agronomic parameters, with maximum effect on PH (88%), higher than the value of 73% obtained by Negrão et al. (2013). Notwithstanding, the year had a
significant influence in most of agronomic parameters,
in most cases the interactive effect indicating a different behavior between gentoypes. Singh et al. (2013) also
detected a significant effect of Genotype x Environment
interaction on plant height, but not for panicle length.
The 2013 season was characterized by a cold and rainy spring compared to 2012, conditions that had consequences on plant emergence, which was worst in 2013. The prevalence of low temperatures at sowing generally results in poor rice seed germination, seedling establishment and plants vigor (Chen et al. 2005).
Furthermore, several other significant temperature differences, favorable to 2012, between the two years for traits like PM2, TGW or GY, could be explained in part by differences in maximum values reached between the two seasons (Fig. 1). Temperatures above 35 °C (heat stress) that occurred in 2013 during the period between panicle initiation and heading can represent a constraint to number of panicles and subsequently to yield. Higher maximum
temperatures during grain filling period in 2013, especially in the final phase of grain filling, could also negatively influence grain weight. In addition, minimum temperatures
during those periods were also quite high. Several studies (Peng et al. 2004; Fitzgerald and Resurreccion 2009; Jagadish et al. 2010; Welch et al. 2010; Kim et al. 2011) concluded that abnormally high maximum and minimum
temperatures during the flowering phase can produce
some infertility problems in rice spikelets. Furthermore, heading and anthesis time in 2012 occurred in a period with higher temperatures (30.2 °C, in average) compared with 2013 (27.9 °C, in average), which in addition to the temperatures peaks (above 35 °C) that arose in 2012, could have been an environmental constraint (heat stress) to
Table
7: Pearson`s correlations coefficient among agronomic, biometric and quality traits of data obtained from 26 genotypes in years 2012 and 2013
Trai ts PH PM2 GP EG GY pGL pGW pLW TGW AC kL kW kLW PV BD SB PM2 ‑ 0.3592* GP 0.2877* ‑ 0.4903*** EG ‑ 0.3148* ‑ 0.1404 NS ‑ 0.0276 NS GY 0.1584 NS 0.2116 NS ‑ 0.3462* ‑ 0.1641 NS pGL 0.0697 NS ‑ 0.0044 NS ‑ 0.0065 NS 0.1069 NS ‑ 0.1950 NS pGW 0.3484* ‑ 0.4338** ‑ 0.0316 NS ‑ 0.0832 NS 0.1426 NS 0.0968 NS pLW ‑ 0.2578 NS 0.3768** 0.0224 NS 0.1534 NS ‑ 0.2228 NS 0.5264*** ‑ 0.7897*** TGW 0.2692 NS ‑ 0.1269 NS ‑ 0.3675* 0.0647 NS 0.2492 NS 0.2960* 0.5844*** ‑ 0.3242* AC 0.2330 NS 0.0165 NS 0.2508 NS 0.3098* ‑ 0.0534 NS ‑ 0.0980 NS ‑ 0.2742 NS 0.2120 NS ‑ 0.1718 NS kL 0.1037 NS ‑ 0.0294 NS ‑ 0.2890* 0.3215* ‑ 0.0899 NS 0.4237** 0.1048 NS 0.1859 NS 0.4386** 0.1454 NS kW 0.4624*** ‑ 0.3040* ‑ 0.0450 NS ‑ 0.1718 NS 0.1986 NS 0.1166 NS 0.7324*** ‑ 0.5766*** 0.7999*** ‑ 0.2361 NS 0.0919 NS kLW ‑ 0.3601* 0.2794 NS ‑ 0.1265 NS 0.3321* ‑ 0.2092 NS 0.1239 NS ‑ 0.6215*** 0.6385*** ‑ 0.4678*** 0.3248* 0.4551** ‑ 0.8402*** PV ‑ 0.0255 NS 0.1330 NS ‑ 0.1845 NS ‑ 0.3622* 0.0906 NS ‑ 0.0460 NS 0.2497 NS ‑ 0.2826 NS 0.3281* ‑ 0.6334*** ‑ 0.2039 NS 0.3930** ‑ 0.4914*** BD ‑ 0.2079 NS 0.2243 NS ‑ 0.2293 NS ‑ 0.2995* 0.0107 NS ‑ 0.0470 NS 0.1802 NS ‑ 0.2216 NS 0.3231* ‑ 0.6561*** ‑ 0.1490 NS 0.3324* ‑ 0.3995** 0.9539*** SB 0.1967 NS ‑ 0.1367 NS 0.3135* 0.2285 NS ‑ 0.0168 NS ‑ 0.0532 NS ‑ 0.2983* 0.2609 NS ‑ 0.4846*** 0.7039*** 0.0325 NS ‑ 0.4575** 0.4482** ‑ 0.8936*** ‑ 0. 9459*** MY 0.0615 NS 0.4275** ‑ 0.6010*** ‑ 0.1600 NS 0.4848*** ‑ 0.0617 NS ‑ 0.0794 NS 0.0224 NS 0.0670 NS ‑ 0.1384 NS ‑ 0.0252 NS ‑ 0.1154 NS 0.0898 NS 0.1451 NS 0.0607 NS ‑ 0.0527 NS
rice plants with consequences on spikelet fertility, namely number of grains per panicle (Jagadish et al. 2007).
The results obtained are coherent due to the cereals crop compensatory mechanisms of yield components (PM2 and GP), which mean that less panicle resulted in more grains per panicle and consequently lower grain weight (TGW). Zhu et al. (2002) also observed that with an increase in panicle per hill, the spikelet per panicle decreased. In 2013 season, genotypes in average obtained more grains per panicle, resulting in a lower grain weight. This season was marked by a cold and rainy spring compared to 2012, conditions that had consequences on plants emergence, which was worst in 2013, resulting in fewer plants per surface and consequently less PM2. The prevalence of low temperatures at sowing generally results in poor rice seed germination, seedling establishment and plants vigor (Chen et al. 2005).
Despite the highlighted crop season effects on grain yield and yield components, responses are mostly genotype dependent (Jeng et al. 2006). However, it was observed that the differences between genotypes that are sister lines could be almost as high as the differences between genotypes with different genealogy.
Advanced lines OP1001, OP1203 and OP1212 were considered overall to show better phenotypic traits under
field environment than all the others, as well as the best
agronomic and quality traits for their inclusion in the rice
market. OP1001 denotes shorter plant height, significant
advantage compared with taller OP1203 and OP1212 more susceptible to lodging, leading frequently to grain yield losses (Aguilar, 2010). In fact, breeding programs aim to obtain new genotypes that are shorter than the parents, but as long as these shorter lines have other outstanding
features at the same time (Guimarães et al. 2006). Of these, OP1001 was also very stable, with only the yield being
affect by the different years with significance. The other 2
were stable in terms of yield in the two years, but showed a
bit less consistency in biometry (OP1203 had significantly
higher length to width ratio of the paddy grain in 2013, and OP1212 a lower paddy grain length). The latter two were also among the highest yields, which suggest their greater interest for farmers compared to OP1001. However, OP1202 had both high yield and a better size uniformity between the different years, and is therefore more stable to the difference in growing conditions of the different years.
Several significant correlations within agronomic and
quality traits were observed and expected such as the yield components, the paddy and polished biometric parameters and the viscosity parameters. The amylose content related more closely to the viscosity parameters than the biometric data. A strong relationship between amylose content and the rice grain Indica biometric pattern has already been proven (Yadav et al. 2007; Biselli et al. 2014), but this relation was not found with these genotypes that contain more japonica germplasm and thus also lower amylose and L/W values. The correlation between amylose content (AC) and viscosity parameters has been extensively reported by other authors (Wang et al. 2013; Kaur et al. 2014).
The grain yield (GY) is only correlated with number of grains per panicle (GP) and milling yield (MY) and not with grain weight (TGW), probably due to an unusual weather in 2013 having been able to mask or minimize some expected correlations. More years of study could bring to light correlations among the traits considered more clearly.
The correlations between the paddy and polished biometric parameters are obvious but it is noted that the polished Fig 4. Quality space defined by the 3 principal components of the quality and milling parameters. Scores of the PC values of the commercial varieties are highlighted. The first digits indicate the genotype as per table 1 and the latter 2 digits the harvest year. (a) Scores of the first 2 PCs;
(b) Scores of the 1st and 3rd PCs.
grain length/width ratio depends basically of paddy width and correlates quite poorly with just the length.
Contrarily to other studies (Ahmad et al. 2009; Arulmozhi and Muthuswamy 2013; Hasnain and Ali 2013; Lee et al. 2013), no relationship between AC and GY was detected, which also has occurred in the study of Ali et al. (2014) for basmati rice.
The correlation among the data suggests that the milling yield (MY) and the biometric grain parameters are quality traits more related to agronomic parameters. The number of panicles (PM2), number of grains per panicle (GP) and grain yield could be good indicators of the milling yield (MY) and the grain width can be determined by plant height (PH) and number of grains per panicle.
CONCLUSION
The genotype has greater influence on total variability of
agronomic parameters than year and interaction but weather conditions during the crop season have an important impact on traits such as grain yield and components, namely, plant height, number of grains per panicle and grain weight.Some accessions show more grain biometric uniformity than others when studying some important traits like grain length and width. Advanced lines OP1001, OP1109, OP1203 and OP1212 would be considered the best performers in terms of
field behavior, agronomic and quality traits, for their inclusion
in the rice market. However, OP1202 was the most stable variety, with much greater consistency both of agronomic parameters, high yields and quality traits in both years. It therefore indicates a better resistance to the variability of growing conditions caused by different weather patterns, and thus the best overall quality potential in terms of consistency. Rice breeding programs should give special focus on selecting for rice grain yield and uniformity in order to obtain new varieties adapted to local environmental conditions aiming resilience to climate change and in line with the market needs.
Acknowledgments
The research leading to these results has received funding from the Portuguese Fundação para a Ciência e Tecnologia (FCT) under the grant agreement number RECI/AGR-TEC/0285/2012, BEST-RICE-4-LIFE project. The grant of Clemente Ortiz Romero was supported by IFAPA
(Andalusia, Spain) and cofinanced at 80% by the European
Social Fund, charged to the ESF Operative Program for Andalusia 2007-2013.
Author’s contributions
Clemente Ortiz-Romero analysed the data and wrote the
manuscript. Ana Sofia Almeida developed the advanced
lines under the Portuguese Rice Breeding Program. Shivani Pathania wrote the manuscript. Cátia Silvaand Diana Lourenço performed the physic-chemical analysis experiments, Jorge Oliveiraanalysed and discussed the data, Carla Brites designed and coordinated the research project experiments.
REFERENCES
AACC. 1999. International Approved Methods of Analysis, Method 61-02.01. Determination of the Pasting Properties of Rice with the Rapid Visco Analyser. Approved November 3, 1999. 11th ed. AACC International, St. Paul, MN, USA. DOI: 10.1094/
AACCIntMethod-61-02.01.
Aguilar, M. 2010. Integrated rice production in southern Spain. Ministry of Agriculture and Fisheries of the Junta de Andalucia. Fundacion Caja Rural del. Sur,Studies and Technical Reports: Farming, Sevilla.
Ahmad, S., M. Zia-Ul-Haq, H. Ali, A. Ahmad, M. A. Khan, T. Khaliq, Z. Husnain, A. Hussain and G. Hoogenboom. 2009. Morphological and quality parameters of Oryza sativa L. as affected by population dynamics, nitrogen fertilization and irrigation regimes. Pak. J. Bot. 41: 1259-1269.
Ali, H., Z. Hasnain, A. N. Shahzad, N. Sarwar, M. K. Qureshi, S. Khaliq and M. F. Qayyum. 2014. Nitrogen and zinc interaction improves yield and quality of submerged Basmati rice (Oryza sativa L.). Not Bot. Hortiic. Agrobo.,42: 372-379.
Arulmozhi, R. and A. Muthuswamy. 2013. Correlation studies on grain yield and its component traits in rice (Oryza sativa L.). Int. J. Sci. Res. 2: 13-14.
Biselli, C., D. Cavalluzzo, R. Perrini, A. Gianinetti, P. Bagnaresi, S. Urso, G. Orasen, F. Desiderio, E. Lupotto, L. Cattivelli and G. Vale. 2014. Improvement of marker-based predictability of apparent amylose content in Japonica rice through GBSSI allele mining. Rice, 7: 1-18.
Calingacion, M., A. Laborte, A. Nelson, A. Resurreccion, J. C. Concepcion, V. D. Daygon, R. Mumm, R. Reinke, S. Dipti, P. Z. Bassinello, J. Manful, S. Sophany and K.C. Lara. 2014. Diversity of global rice markets and the science required for consumer-targeted rice breeding. PLoS One, 9(1): e85106. Chen, D., T. A. Gunawardena, B. P. Naidu, S. Fukai and J. Basnayake.
2005. Seed treatment with gibberellic acid and glycinebetaine improves seedling emergence and seedling vigour of rice under low temperature. Seed Sci. Technol., 33: 471-479.
Fernandes, M. and A. M. Correia. 2012. Evolução das estratégias de investigação do arroz no INIA - Portugal. Rev. Ciênc. Agric. 35: 69-87.
Fitzgerald, M. A. and A. P. Resurreccion. 2009. Maintaining the yield of edible rice in a warming world. Funct. Plant Biol. 36: 1037-1045.
Global Rice Science Partnership (GRiSP). 2010. CGIAR Thematic Area 3: Sustainable crop productivity increase for global food security. Proposal for a CGIAR Research Program on Rice-Based Production Systems. Available from: http://www.grisp.net/ file_cabinet/download/0x0000689c1?1312766027.
Guimarães, E. P., D. Bedoshvili, A. Morgounov, S. Baboev, A. Iskakov, H. Muninjanov, E. Kueneman and M. Paganini. 2006. Plant breeding and related biotechnology competence in Central Asia and recommendations to strengthen regional capacity. Agromeridian Theor. Appl. Agric. Res. J. 2: 137-143.
of scented rice (cv. Super Basmati) in relation to irrigation and zinc application. J. Plant Breed Crop. Sci. 5: 187-194.
ISO 6646. 2011. Rice - Determination of the Potential Milling Yield from Paddy and from Husked Rice.
ISO 6647-2. 2015. Rice -- Determination of amylose content -- Part 2: Routine Methods.
Jagadish, S. V. K., P. Q. Carufurd and T. R. Wheeler. 2007. High temperature stress and spikelet fertility in rice (Oryza sativa L.). J. Exp. Bot. 58: 1627-1635.
Jagadish, S. V. K., R. Muthurajan, R. Oane, T. R. Wheeler, S. Heuer, J. Bennett and P. Q. Craufurd. 2010. Physiological and proteomic approaches to dissect reproductive stage heat tolerance in rice (Oryza sativa L.). J. Exp. Bot. 61: 143-156.
Jeng, T. L., T. H. Tseng, C. S. Wang, C. L. Chen and J. M. Sung. 2006. Yield and grain uniformity in contrasting rice genotypes suitable for different growth environments. Field Crop. Res. 99: 59-66. Kaur, S., P. S. Panesar, M. B. Bera and S. Kumari. 2014.
Physicochemical, textural, pasting, and in vitro digestion properties of some basmati and non-basmati rice cultivars. Int. J. Food Prop. 17: 1055-1066.
Kim, J., J. Shon, C. K. Lee, W. Yang, Y. Yoon, W. H. Yang, Y. G. Kim and B. W. Lee. 2011. Relationship between grain filling duration and leaf senescence of temperate rice under high temperature. Field Crop. Res. 122: 207-213.
Lee, J. S., J. H. Lee, M. R. Yoon, J. Kwak, Y. J. M. Areum-Chun, C. K. Kim. 2013. Palatability and physicochemical properties in 2001 yield increased by 10% than normal level in 2000. Korean J. Crop. Sci. 58: 292-300.
MADRP. 2007. Ministério da agricultura do desenvolvimento rural e das pescas. Diário da República, Despacho nº 11 039/2007. Moreira, A. M., P. Z. Bassinello, M. Caliari and T. C. O. Borba.
2014. Proposed methodology for quality preselection of rice populations. Cereal Chem. 91: 201-206.
Negrão, S., J. Palaniappan, J. Maroco, T. Lourenço, D. Mackill and M. M. Oliveira. 2013. Bridging SD1 molecular knowledge with recent breeding strategies for the improvement of traditional rice varieties - a japonica case-study. Afr. J. Biotechnol. 9: 2192-2200. Nicholls, N., G. V. Gruza, J. Jouzel, T. R. Karl, L. A., Ogallo and
D. E. Parker. 1995. observed climate variability and change. In: Houghton, J. T., L. G. M. Filho, J. Bruce, H. Lee, B. A. Callender, E. Haites, N. Harris and K. Maskell (Ed.), Climate Change 1995: The Science of Climate Change. Cambridge University Press,
Cambridge, UK, pp. 133-192.
Oliveira, J. C., E. P. Byrne, J. J. Fltzpatrick, J. Simões and C. Brites. 2015. Review of innovative concepts for process sustainability in the rice processing industry. In: Proceedings of the 10th AISTEC Conference Grains for Feeding the World. Milan,
Italy, 1-3, July.
Peng, S. B., J. L. Huang, J. E. Sheehy, R. C. Laza, R. M. Visperas, X. H. Zhong, G. S. Centeno, G. S. Khush and K. G. Cassman. 2004. Rice yields decline with higher night temperature from global warming. Proc. Natl. Acad. Sci. USA, 101: 9971-9975. Pourabed, E., M. R. J. Noushabadi, S. H. Jamali, N. M. Alipour, A.
Zareyan and L. Sadeghi. 2015. Identification and DUS testing of rice varieties through microsatellite markers. Int. J. Plant Gen. 20: 1-7.
Singh, P., A. Pandey and R. Kumar. 2013. Stability study in aromatic rice (Oryza sativa L.). Crop. Res. 45: 59-65.
Subba Rao, L. V., G. S. Prasad, M. Chiranjivi, U. Chaitanya and R. Surendhar. 2013. DUS Characterization for farmer varieties of rice. J. Agric. Vet. Sci. 4: 35-43.
Wang, L., F. Deng, W. J. Ren, W. Y. Yang. 2013. Effects of shading on starch pasting characteristics of Indica hybrid rice (Oryza sativa L.). PLoS One. 8: e68220.
Welch, J. R., J. R. Vincent, M. Auffhammer, P. F. Moyae, A. Dobermann and D. Dawe. 2010. Rice yields in tropical/subtropical Asia exhibit large but opposing sensitivities to minimum and maximum temperatures. Proc. Natl. Acad. Sci. USA, 107: 14562-14567. Yadav, R. B., B. S. Khatkar and B. S. Yadav. 2007. Morphological,
physicochemical and cooking properties of some Indian rice (Oryza sativa L.) cultivars. J. Agric. Technol., 3: 203-210. Yousefnia, P. H., K. R. Tabatabae, H. Aghagolzadeh and S. J.
Hashemi. 2012. Effects of weed control methods on yield and yield components of rice. Aust. J. Agric. Eng., 8: 93-105. Zhu, D. F., S. H. Chen, Y. P. Zhang and X. Q. Lin. 2002. Tillering
patterns and the contribution of tillers to grain yield with hybrid rice and wide spacing. In: Uphoff, N., A. Kassam and W. Stoop (Eds.), Assessment of the System of Rice Intensification, Cornell International Institute for Food, Agriculture and Development, Ithaca, pp. 125-131.