Original Research Article
Evaluating the Usability of Laboratory Information
Systems in Benghazi, Libya
Huda Kutrani
Health Informatics Department, Faculty of Public Health, University of Benghazi, Libya
ABSTRACT
Laboratory Information Systems (LISs) can exchange data and increase users' performance with accurate information and a low error rate. A good usability system should have a positive impact on quality of care and increases patient safety. This study aims to measure the level of the usability of the LIS system in Benghazi public hospitals. The LISs will be tested using QUIS and SUS usability tests. A survey was distributed among LISs users in public hospitals in Benghazi. Poor usability was observed; the SUS score was 65.2 which were significantly lower than the benchmark (P < 0.05). Years of experience using the LIS had influenced SUS scores; users who had less than one year experience evaluated the SUS with a score 55; while the respondents with four or more years of experience evaluated the SUS with a score of 70.2. Moreover, the screen section had a good rating as the respondents were satisfied with it. However, the system speed was slow. Based on the results of this study, the usability of LISs needs improvement, and IT developers should focus on the system speed.
Keyword:Laboratory information system, usability evaluation, SUS, QUIS
INTRODUCTION
The Laboratory Information System (LIS) model is an electronic web-based application which features easy flexible usage. It is an integrated management system that supports information sharing among hospital's departments and between hospitals and clinics. It could be implemented in a single clinic, polyclinics or hospitals. [1,2] Furthermore, it is the most common software in hospital information systems around the world. Also, LIS can play a critical role in improving healthcare delivery and in decreasing medical errors.
[1,3]
Many studies reported that the need for Laboratory Information Systems is rising to meet workload demands in hospitals which provide a high quality information for a decision making processes to improve patient outcomes. [1,2,3, 6]
Moreover, quality and efficiency are high priority factors in adopting electronic systems by healthcare organizations. Studies have shown that some of health information systems could not realize their established goals. For example, the staffs require more time to achieve their tasks with the systems. Usability problems are identified among the major causes for this defect. Studies recommended to continue evaluating the system usability to recognize and overcome such problems which make the system usability evaluation of paramount importance. [1,3,4,6]
The usability tests provide information about LIS to improve performance and for its successful adoption in hospitals; [2] especially in Libyan public hospitals where it is rarely used. This research is an opportunity to test LISs usability and to identify some of the challenges users face to assist IT's developers in improving system's performance. The aim of this research is to measure the level of the usability of the LIS system in Benghazi public hospitals.
MATERIALS AND METHODS
A cross-sectional descriptive study was conducted in Benghazi public hospitals, during the period from 15th May 2018 to 15th September 2018.
Sample size: 75 laboratory staff who currently use a LIS in a hospital setting Data collection: Primary data was collected by a questionnaire. The delivery and collection were self-administered. The questionnaire contained demographic data such as age,the “System Usability Scale” (SUS) statements and the “Questionnaire for User Interaction Satisfaction” (QUIS) statements.
SUS: The SUS is a fast secure reliable instrument in system evaluation. [7] The SUS is a 10 statement test with a 5-point Likert scale ranging from strongly disagree (1) to strongly agree (5). Computing SUS Score is calculated by subtracting one from the user's response for odd numbered statements; the next step is to subtract five from user's response to even-numbered statements. Finally, add all the new values and multiply the total by 2.5 which should be in the range of 0-100. The benchmark SUS score is a 68. [8,9] In SUS score below 60 is an "F" grade; from 60 to 70 is a "D"; from 70 to 80 is a "C"; from 80 to 90 is a "B", and from 90 to 100 is an "A". [8]
QUIS: The questionnaire is divided into four sections (overall reaction to the software, Screen, Terminology and System Information, and System Capabilities) with a total of 20 statements, on a 9 point scale. The midpoint of the rating scale is 4.5
which can be used as a criterion. When the rating scale is above five, it is getting better but not good enough; good is when the rating scale reaches 7 or above. [1,10,11]
Data analysis: Data analysis was executed using the SPSS program (Statistical Package for Social Sciences) version 18. The frequencies tables and column charts were used to describe and compare variables. The ANOVA test was applied to compare demographic variables such as "years using LIS" variable with SUS score to discover if a significant difference exists or not. And the one-sample t-test applied to the 68 (benchmark) point test to discover if a significant difference exists or not.
RESULTS
75 questionnaires out of 60 distributed were filled completely and collected which gives a response rate of 80%. Majority of the respondents were females (72.9%), and 81.3% of respondents were in the age ranged from 25 to 39 years.
The respondents' age and gender were not statistically significant factors that impact SUS scores (P > 0.05).
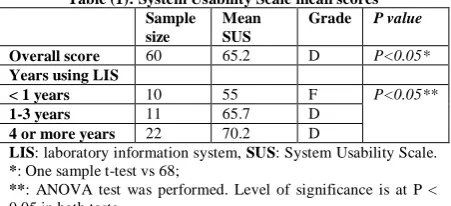
Table (1): System Usability Scale mean scores Sample
size
Mean SUS
Grade P value
Overall score 60 65.2 D P<0.05*
Years using LIS
< 1 years 10 55 F P<0.05**
1-3 years 11 65.7 D
4 or more years 22 70.2 D
LIS: laboratory information system, SUS: System Usability Scale.
*: One sample t-test vs 68;
**: ANOVA test was performed. Level of significance is at P < 0.05 in both tests
have been using their LIS for four or more years (P<0.05).
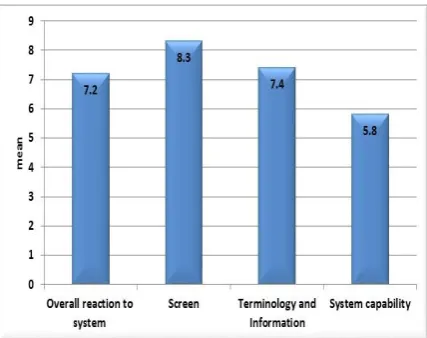
Figure (1): Questionnaire for User Interface Satisfaction (QUIS) model
From Figure 1, the screen had the highest point in QUIS score (8.3). While the system's capacity had the lowest point in QUIS score (5.8).
Table 2 shows a positive feedback from SUS and QUIS usability tests. The most of the respondents preferred to use the system frequently and the system was easy to use. The screen section, majority of respondents positively reacted to the statement of "organization of information on the screen is very clear", "characters on the computer screen are easy to read", and "sequence of the screen is very clear."
Table (2): A positive feedback from SUS and QUIS usability tests
Statements with a high correct positive response % Usability test
1-I think that I would like to use this system frequently 87.1% SUS 3-I thought the system was easy to use. 87.1% SUS Organization of information on screen is very clear 93% QUIS Characters on the computer screen is easy to read 80.7% QUIS Sequence of screen is very clear 80.6% QUIS
SUS: System Usability Scale, QUIS: Questionnaire for User Interface Satisfaction,
Table 3 shows a negative feedback from SUS and QUIS statements. Approximately 61% of the users believed that "I think that I would need the support of a technical person to be able to use this system", and they need to learn a lot of things about the LIS before using. Furthermore, the majority of users reported that the system speed was often slow with an average of 4.3.
Table (3): A negative feedback from SUS and QUIS usability tests
Statements with a high incorrect response (negative response) % Usability test
4-I think that I would need the support of a technical person to be able to use this system. 61.3% SUS 10-I needed to learn a lot of things before I could get going with this system. 61% SUS
System speed is slow 77.3%
(mean 4.3 of 9) QUIS
SUS: System Usability Scale, QUIS: Questionnaire for User Interface Satisfaction
DISCUSSION
The overall scoring of the SUS was 65.2 for the LISs evaluation of the public hospitals in Benghazi, also it was significantly lower than the benchmark of 68 (P < 0.05); as shown in Table (1). Therefore, all SUS scores indicated that usability of LISs was quite poor compared to various information systems in Kavala Hospital in Greece and Orchard Harvest LIS in the USA that had been evaluated using the SUS. [2, 3] Moreover, Table (1) showed the grading scale for SUS scores; the evaluated LISs attained a failing “D” grade. In agreement with a study conducted in the
USA by Mathews and Marc who reported most of LISs had "D" grade. [3] While the research conducted in Kavala Hospital in Greece reported that above half of hospital information system had "C & B" grades.
for four or more years. Also, the grade score increased from F grade to D grade correlated with years of experience; as shown in Table (1). These results are in agreementwith the results from the studies by Martínez-Falero et al. and by Mathews and Marc who found that the mean SUS scores increased as years of experience increased. [3,12] In Martínez-Falero et al.'s study, the mean SUS score had increased from 47.5 to 76.25 (from F grade to B grade). [12] While in Mathews and Marc's study the mean SUS score had increased from 49.3 to 67.3 (from F grade to D grade).
[3]
Figure 1 illustrates that the screen had a good rating as the highest point in QUIS score was 8.3. While the system's capacity had the lowest point in QUIS score was 5.8 which is better but not good enough; indicating the section is in need of improvement. [1,10] As showed in the results of Saudi Arabian study, the screen gained the highest score, while system capability attained the lowest score. [1] Moreover, in our study, the "overall reaction to the LIS" and "the terminology and information" sections were a good rating.
Table 2 shows the top correct positive responses to SUS and QUIS statements. The most of the respondents preferred to use the system frequently; similar results are observed in Nikomacheia's study where about 80% of the respondents preferred to use the system frequently. [2] But29.4% of the respondents found the system easy to use in Nikomacheia's study; [2] this result disagrees with our result; as shown in Table 2. Furthermore, the screen section showed positive important results. Majority of respondents positively reacted to the statement of "organization of information on the screen is very clear", "characters on the computer screen are easy to read", and "sequence of the screen is very clear."This is consistent with the results from studies performed in the USA, Saudi Arabia and the UK where the screen section had the highest rating than any other sections in QUIS;
indicating the staff's satisfaction with the screen section. [1,10,11]
Table 3 shows a negative feedback from SUS and QUIS statements. Over half of the users believed that they need support from a technician to confidently use the LIS. Moreover, most of the users supported the need to learn a lot of things about the LIS before using; emphasising the necessity of training. As our results showed more negative responses than Nikomacheia's study; where 14.3% of users supported that the guidance from a technician is important. Nineteen per cent of the users supported that "there was the need to learn a lot of things before the use of the system". [2] Also, our results are in agreement with the Saudi Arabian study. [1] The high negative responses to statements 4 and 10 in Table 3; indicating that our study staff and Saudi Arabian study staff have difficulty in dealing with the system. Therefore, the hospitals should plan staff training for the LIS, especially for the new staff. [1]
Furthermore, the majority of users reported that the system speed was often slow with an average of 4.3 which is lower than the midpoint (4.5); as shown in Table (4). Slow system speed leads to a delay in the delivery of results; and affects the score of system capability. The studies conducted in Saudi Arabia and the USA reported only at peak times when pressure on databases leads to the system slowness. [1,10]
CONCLUSION
The research's results indicated low SUS score with 'D' grade due to poor usability in Benghazi public hospitals. Only "years of experience using the LIS" variable has influenced SUS scores; as years of experience increase, SUS score increases showing a positive correlation.
While the negative feedbacks was that the system was difficult to use to the new staff, and the system speed was often slow.
Recommendation
According to this study's results, the usability of LISs needs improvement, other usability evaluation models should be used to obtain more specific details to overcome weakness in the system. Training courses for the new users should be provided with adequate guidance to all users. Moreover, IT developers should focus on the system speed.
ACKNOWLEDGEMENT
The author would like to thank Eng. OmimaSaoud, Dr. FatmaElzowai and Dr.Wael El-Hawary for their assistance in the study.
REFERENCES
1. Alanazi F. Evaluating the Usability of the Laboratory Information System (LIS) in Coombe Hospital and Hail Hospital. Masters Dissertation, Dublin Institute of Technology; 2015.
2. Nikomacheia C. Evaluation Of Hospital Information Systems. Masters Dissertation, University of Greenwich; 2005.
3. Mathews A, Marc D. Usability Evaluation of Laboratory Information Systems. J Pathol Inform. 2017; 8(40): 1-8. Available from: DOI: 10.4103/jpi.jpi_24_17 [Accessed 5 June 2018].
4. Subramoniam S, Shatat AS, Al-Balushi FAM, Al-Ghassani FKA. Survey Based Usability Analysis on an In-House Hospital Information System. Journal of Information Technology and Economic Development. 2010; 1(1): 1-15.
5. Kushniruk AW, Patel VL. Cognitive and usability engineering methods for the evaluation of clinical information systems. Journal of Biomedical Informatics. 2004; 37:56–76. Available from:
doi:10.1016/j.jbi.2004.01.003 [Accessed 6 June 2018].
6. Nabovati E, Vakili-Arki H, Eslami S, Khajouei R. Usability Evaluation of Laboratory and Radiology Information Systems Integrated into a Hospital Information System. J Med Syst. 2014; 38(35): 1-7. Available from: DOI 10.1007/s10916-014-0035-z. [Accessed 15 June 2018].
7. Finstad K. The System Usability Scale and Non-Native English Speakers. Journal of Usability Studies. 2006; 1(4):185-8.
Available from:
http://www.usabilityprofessionals.org [Accessed 10 May 2018].
8. Bangor A, Kortum P, Miller J. Determining What Individual SUS Scores Mean: Adding an Adjective Rating Scale. Journal of Usability Studies. 2009; 4(3):114-123. 9. Brooke J. SUS: A Retrospective. Journal of
Usability Studies. 2009; 8(2):29-40. Available from: http://www.usabilitypro fessionals.org [Accessed 10 May 2018]. 10. Slaughter L, Norman KL, Shneiderman B.
Assessing Users' Subjective Satisfaction with the Information System for Youth Services (ISYS). 1995; (301)314-1328.
Available from:
https://drum.lib.umd.edu/handle /1903/431 [Accessed 12 May 2018].
11. Frias-Martinez E, Chen SY. Proceedings of the 5th WSEAS Int. Conf. on SIMULATION, MODELING AND OPTIMIZATION. Evaluation of User Satisfaction with Digital Library Interfaces. Corfu, Greece. 2005: 172-177.
12. Martínez-Falero JE, Ayuga-Tellez E, Gonzalez-Garcia C, Grande-Ortiz MA, De Medina-Garrido AS. Experts’ Analysis of the Quality and Usability of SILVANET Software for Informing Sustainable Forest Management. Sustainability. 2017; 9(1200): 1-13; Available from: doi:10.3390/su9071200 [Accessed 12 May 2018].
******