Race-Based Differences In Performance
Measures: Implications For Diversity
Management In Higher Education
And The Workforce
Arlise P. McKinney, PhD, University of North Carolina at Greensboro, USA
ABSTRACT
Increased diversity representations in higher education create both opportunities and challenges for diversity management. Both in education and the workforce, one challenge has been to achieve equal access and opportunity for diverse groups because of differences in standardized measures (e.g., SAT) and other measures (e.g. GPA) used in admissions decisions and in personnel selection. This study examined race-based differences in academic measures of SAT, high school GPA, and college GPA to better understand the influence of these factors on diversity management in higher education. The implications are discussed with suggestions for future research.
Keywords: diversity, higher education, race, adverse impact
INTRODUCTION
igher education has become increasingly diverse in the U.S. with women now accounting for the majority of enrollments in undergraduate and graduate programs. In addition, minority enrollment has also increased steadily over the past twenty years (American Council on Education, 2006). As a result of increasing diversity representations, diversity management practices in higher education are important for shaping the future of the workplace. Diversity management includes practices and policies that are put in place to attract talent, empower students to excel, but also remove barriers that may hinder progress. The success of diversity management in higher education contexts is important for university accreditation but also a precursor to effective workforce diversity management. Though there are many aspects of diversity management in higher education to address (Lumadi, 2008), the current paper focuses on race given that prior research has demonstrated access issues that impact success rates in both admissions and retention (Sternberg, 2006).
University administrators are often balancing multiple goals to include maximizing campus diversity and attaining desired levels of academic performance among student body populations. Some researchers have argued that diversity and performance are competing goals given that minority students tend to score lower on standardized tests that predict academic performance (Sackett, Schmitt, Ellingson, & Kabin, 2001). Academic performance is of central concern for administrators in making college admissions decisions and SAT and high school grade point average (GPA) are two of the most commonly used predictors in assessing future academic performance (Hezlett, Kuncel, Vey, Ones, Campbell, & Camera; 2001; Sternberg, 2006). However, group differences have been demonstrated in prior research in both the SAT and high school GPA (Sternberg, 2006). While the SAT and high school GPA are widely used, SAT tests have come under scrutiny due the group differences in test scores that have the potential for adverse impact against Black and Hispanic students in college admissions decisions. Adverse impact occurs when minority group members have differential rates of success based on the use of test scores that may disproportionately affect their access to higher education and entry-level jobs (Roth & Bobko, 2000).
Research has shown the minorities (e.g., African-Americans and Hispanics) score lower on standardized tests than their white counterparts (e.g., Potosky, Bobko, & Roth, 2005; Sackett, et al., 2001). Though high school GPA has been received less research attention, recent studies have also suggested that minority group differences likely exist in college GPA reporting that Whites generally have higher college GPAs than Black students (e.g., Roth & Bobko, 2000; Young, 1994). The primary purpose of the current study is extend prior research by examining the relative contribution of SAT and high school GPA in predicting academic performance as measured by college GPA. A second purpose of this study is to examine the extent to which race-based differences exist across these measures that may lead to adverse impact in college admissions decisions. The following is a review of the three key academic indicators of performance examined in this study of SAT, high school GPA, and college GPA.
SAT AND HIGH SCHOOL GPA
The SAT is a standardized test that assesses students in both numerical and verbal reasoning, while high school GPA is a measure of student academic performance as a measure of grades earned over a period of three to four years. Most researchers would concede that both high school GPA and college GPA are determined in part by cognitive ability and motivation (Conard, 2006; Roth & Bobko, 2000; Schmitt, Oswald, Kim, Imus, Merritt, Friede, & Shivpuri, 2007, Sternberg, 2006). Motivation has proven to be a more elusive construct to measure due to its temporal nature, so most researchers and academicians have focused on the ability component of academic performance. Assessments of cognitive ability have relied largely on standardized tests that capture some aspect of aptitude as the best proxy for cognitive ability. The SAT is a standardized test that has been used as a measure of ability in a variety of studies in organizational research (Berry, Gruys, & Sackett, 2006; Kuncel, Hezlett, & Ones, 2004; Pettijohn, 1995; Schmitt et al., 2007; Sternberg, 2006). A recent meta-analysis examining the predictive validity of the SAT with first year college GPA yielded correlations ranging from .44 to .62 (Hezlett et al., 2001), representing moderate to strong effect sizes. Research has also shown group differences in SAT scores such that White and Asian students had higher scores than Black, Latino, and Native American students (Sternberg, 2006). Other studies have found that high school GPA was a better overall predictor than SAT (Ramist, Lewis, & McCamley-Jenkins, 1994) and also suggest that group differences in GPA do exist (Sternberg, 2006); however, research is more limited on high school GPA compared to SAT.
Though SAT and high school GPA have been shown to predict college GPA, prior research has demonstrated differential predictions for student populations by race and gender. Studies have found that SAT and high school GPA resulted in overestimations of college GPA for men compared to women (Goldman, 1990). Further, the accuracy of prediction has resulted in false positives and false negatives such that 30% of those predicted to succeed failed and nearly 50% of those predicted to failed successfully completed college (Mouw, 1993). Additionally, SAT tests have resulted in biased estimates for Black and White students such that Blacks had lower SAT scores, yet no differences resulted between the two groups in college GPA (Lawlor, Richman, & Richman, 1997). Prior studies have examined these variables but few have examined them over time for the stability in the predictions for academic success beyond one year. This gap highlights the need to further examine the relationships between the important decision-making aids of SAT and high school GPA that can impact diversity representations and diversity management.
ACADEMIC PERFORMANCE: COLLEGE GPA
While prior research has demonstrated group differences in SAT scores and high school GPA, college GPA has received less research attention. Only a few studies have examined group differences in college GPA that would lead to adverse impact and additional research is needed to generalize the results to current and future student populations. Because research examining group differences in college GPA has been limited, it is unclear whether and at what level group differences exist. Roth and Bobko (2000) reported that college GPA for White students were .26 points higher than Black undergraduate students. This was a primary study with a large sample but within one university and only examined college GPA at one point in time. Thus, the extent to which these results generalize to other college student populations and whether the differences remain stable over time is unknown.
PURPOSE OF THE STUDY
If the two leading predictors of academic success reflect group differences, adverse impact would be likely for Blacks and Hispanics such that the admissions rates would be lower than their White and Asian counterparts. These findings suggest that creating and maintaining a diverse student body may be limited to some degree by the exclusive or dominant use of SAT scores and high school GPA that may have a negative impact on minority students. Thus, the current study extends prior research by examining (1) validity of SAT and high school GPA in predicting college GPA, (2) group differences that may exist within these study variables, and (3) college GPA levels and group differences during the academic tenure.
METHODOLOGY
Participants and Procedure
Data were collected from the Fall 2003 freshman class of 2,075 admitted students at a large southeastern university. Applicants self-reported race and ethnicity on the college application which was used for coding in the current study. The sample was 69% female (N = 1382) and 31% male (N = 614). The demographics based on race or ethnicity was 70% White, 19% Black, 1% Asian, 3% Native American, .01% Hispanic, and 4.5% who denoted „Other‟ as race. Given the lower number of Hispanics (N=3) and unidentifiable „other‟ classification, these groups were excluded from the analysis of group differences and predictive validity of SAT and high school GPA on first year college GPA.
SAT data were reported directly from the College Board to the university and high school GPA was extracted from high school transcripts that were submitted as part of the college application process. Cumulative college GPA data were gathered over three years for admitted and enrolled students, resulting in a final sample of 1,996 students. As an additional analysis, the university examined in this study employs a computerized algorithm in the admissions decision-making process for computing predicted GPA based on SAT scores and high school GPA. For admission or acceptance, the predicted GPA must be 2.0 or higher. Each of these data (e.g., SAT, high school GPA, predicted GPA, cumulative college GPA) were obtained from the Office of Institutional Research and not based on self-report data.
Analyses
First, descriptive statistics and the inter-correlations between all study variables (e.g., predicted GPA, high school GPA, SAT, and cumulative college GPA for three years) were computed. Additionally, each of these study variables were also categorized based on reported race or ethnicity. Second, a regression analysis was conducted to assess the predictive validity of college GPA using SAT and high school GPA over time.
RESULTS
Prediction of college GPA
2.67 (SD=.48), while actual GPA at the end of the first semester was 2.69 (SD=.90) and actual first year GPA was 2.64 (SD=.86). The mean cumulative college GPA level was 2.60 (SD=.86) and 2.62 (SD=.86) for year two and year three, respectively.
Table 1
Descriptive Statistics for all study variables
Note. SEM=end of semester college GPA for semester one through six.
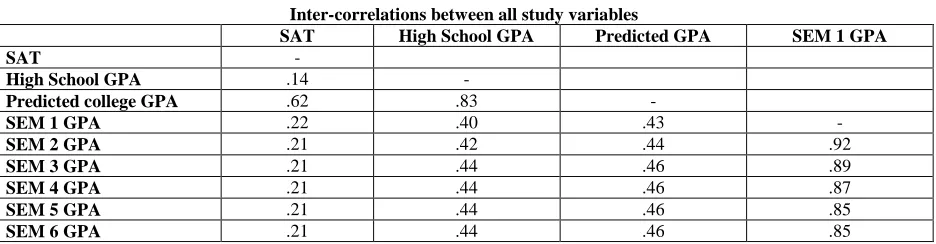
Table 2 provides the inter-correlations between predicted GPA, SAT, high school GPA, and first semester college GPA. As shown in the table, high school GPA had strongest correlation with predicted GPA (r=.83), compared to SAT (r=.62). For actual college GPA at the end of the first semester, predicted GPA had the strongest relationship (r=.43) but only slightly higher than high school GPA (r=.40), followed by SAT (r=.22). The first year college GPA had the strongest relationship with first semester college GPA (r=.92). Predicted GPA and high school GPA were moderately correlated with first year GPA with correlations of .46 and .44, respectively. SAT scores had the weakest overall relationship with college GPA of r=.21. The strength of these correlations with cumulative college GPA remained relatively stable over the subsequent two year period. Interestingly, SAT and high school GPA resulted in a small correlation (r=.14) suggesting a relatively weak relationship between standardized test scores and high school academic performance.
Table 2
Inter-correlations between all study variables
SAT High School GPA Predicted GPA SEM 1 GPA
SAT -
High School GPA .14 -
Predicted college GPA .62 .83 -
SEM 1 GPA .22 .40 .43 -
SEM 2 GPA .21 .42 .44 .92
SEM 3 GPA .21 .44 .46 .89
SEM 4 GPA .21 .44 .46 .87
SEM 5 GPA .21 .44 .46 .85
SEM 6 GPA .21 .44 .46 .85
Note. SEM=end of semester GPA for semesters one through six.
Group Differences
Table 3 reports the mean levels of SAT, high school GPA, predicted GPA, and cumulative college GPA over three years (or six semesters) by race or ethnicity. As shown in the table, Whites had the highest predicted GPA of 2.74 followed by Asians with a predicted GPA of 2.61. Predicted GPA was lower for Native American and Black students with predicted GPAs of 2.58 and 2.47, respectively. White and Black students account for 89% of the sample are generally the two focus groups of comparison in prior studies (Roth & Bobko, 2000; Sternberg, 2006). In comparing the two groups, predicted GPA for Black students was .28 lower than White students.
n Mean SD
SAT 2030 1046 136.27
High School GPA 2075 3.45 .41
Predicted college GPA 2074 2.67 .48
SEM 1 GPA 2054 2.69 .90
SEM 2 GPA 2059 2.64 .86
SEM 3 GPA 2057 2.61 .85
SEM 4 GPA 2057 2.60 .86
SEM 5 GPA 2059 2.61 .85
Table 3
Mean levels of Predicted GPA, SAT, High School GPA, and End of semester college GPA by race/ethnicity
Race n Pred_GPA HS_GPA SAT SEM1 SEM2 SEM3 SEM4 SEM5 SEM6
Overall 1996 2.67 3.45 1046 2.69 2.64 2.61 2.60 2.61 2.62
White 1417 2.74 3.47 1074 2.72 2.67 2.65 2.64 2.65 2.66
Black 388 2.47 3.42 948 2.65 2.58 2.54 2.51 2.51 2.51
Native 61 2.58 3.46 1005 2.43 2.41 2.41 2.39 2.38 2.39
Asian 37 2.61 3.49 994 2.47 2.46 2.42 2.41 2.41 2.41
Note. Pred_GPA=predicted college GPA; HS_GPA=high school GPA; SEM=end of semester GPA for semester one through six.
The mean overall SAT score was 1046 for all students. There was also variability for SAT scores across groups such that Whites had the highest mean score of 1074, followed by Native Americans with a mean SAT of 1005. Mean SAT scores for Black and Asian students were 948 and 994, respectively. More interesting were the high school GPA levels overall and for groups. The mean overall high school GPA was 3.45 and this level was similar for all groups. High school GPA ranged from 3.42 to 3.49, resulting in little variability in high school GPA levels across groups.
Actual college GPA as reported at the end of the first semester was 2.69 overall, with the highest GPA for White students of 2.72 and the lowest for Native American students of 2.43. Black students‟ mean GPA was 2.65 and Asian students‟ GPA was 2.47. The cumulative GPA values remained fairly stable over the six semesters (or three years) examined, with only slight variations. These results are interesting in that using the predicted GPA program, college GPA was fairly accurate for White students but resulted in an over-estimation for Native American and Asian students. For Black students, the predicted GPA resulted in an under-estimation of actual GPA by .11 for the first year. These findings demonstrate that predictive models differ by race or ethnicity classifications. In contrast to Sackett et al.‟s (2001) assertion, standardized tests did under-predict the performance of minority groups.
Predictive Validity
The results examining the predictive validity of SAT and high school GPA on academic performance is reported in Table 4. As shown in the table, high school GPA and SAT explain 18% of the variance in first semester college GPA. These variables explain roughly 20% of the variance in first year college GPA. This is an interesting finding given the relative importance and use of SAT scores and high school GPA to the exclusion of other alternative predictors in explaining academic performance.
Table 4
Regression Results for First Semester GPA and First Year GPA
Predictors β MR R2
First Semester GPA: High School GPA SAT
.373
.167 .429 .184
First Year GPA: High School GPA SAT
.393
.155 .441 .195
DISCUSSION
account for a significant portion of variance in explaining college GPA. It is likely that non-cognitive or motivational variables should be considered in future research to further aid university administrators in making admissions decisions.
It is unknown whether the university examined in this study gave equal consideration to SAT and high school GPA in its computerized algorithm for predicted GPA; however, the data does suggest that high school GPA should carry more weight. If there is differential weighting of predictors such that high school GPA is given more weight than SAT scores, it is less likely that adverse impact would occur given the minimal group differences in high school GPA. As a result, maintaining a diverse student body may not be as challenging as prior research suggests. While Black and Hispanic students in particular perform poorer on standardized tests, the differences are significantly smaller across all groups in academic performance as measured by college GPA over time. We still know very little about groups perform differently in standardized tests but it is an area of needed research to understand performance differences to minimize this impact on diversity representations in higher education as well as personnel selection contexts.
Future Research and Conclusion
The results of this study are consistent with prior research in that group differences exist in SAT scores such that Black and Hispanic students tend to score lower than White and Asian counterparts; however, there were no significant or practical group differences in high school GPA. The results suggest that while Black and Hispanic students score lower on standardized tests that reflect one point time, yet there were not significant differences in academic performance over time as reflected by high school GPA. This finding is essential when considering that high school GPA was a better predictor of academic performance than SAT tests. Prior research has suggested that minority students may be influenced by stereotype threat when taking standardized tests which may help explain why they perform lower on standardized tests while having the same level of academic performance in high school (Nguyen, O‟Neal, & Ryan, 2003). We also do not know to what extent gender stereotypes may be operating that would affect the performance of men or women within and across races reflected by these scores (Bosner, 2008). Lastly, one issue that has not been examined as extensively in higher education is the geographic context and racial history within which a university, which may have an impact on minority recruitment and retention (Festervand & Festervand, 2006). It is likely that diversity representations and campus diversity climate experiences may vary significantly in universities in the southern U.S. compared to northern or even western states. There is a need for future research that can address the dual needs of universities in utilizing academic measures to predict success while eliminating adverse impact against minority groups that would hinder their academic pursuits.
In summary, the findings of the current study provide some evidence that diversity and performance need not be competing goals. Additional research is needed to examine whether the results of the current study are evident in different college or university environments; however, these findings do suggest that group differences have narrowed between races in college GPA than what has been demonstrated in prior research. Another area of fruitful research for consideration in diversity management practices are alternative measures that have been proposed include SAT subject tests that assess more relevant knowledge (Thomas, 2004) and non-cognitive predictors (e.g., personality) that have been shown to provide incremental variance in academic performance that previously assumed (Conard, 2006). Thus, for continued diversity management in terms of diverse group representations in both higher education and the workforce, we need to advance our field of study to better understand all the factors that influence performance and differences between groups.
AUTHOR INFORMATION
REFERENCES
1. American Council on Education (2006), College enrollment gender gap widens for White and Hispanic students, but race and income disparities still most significant new ACE report finds, available at www.acenet.org (accessed April 2009).
2. Berry, C. M., Gruys, M. L., & Sackett, P. R. (2006). Educational attainment as a proxy for cognitive ability in selection: Effects on levels of cognitive ability and adverse impact. Journal of Applied Psychology, 91, 696-705.
3. Bosner, K. C. (2008). Gender stereotypes and self-perceptions among college students. Journal of Diversity Management, 3, 41-52.
4. Conard, M. A. (2006). Aptitude is not enough: How personality and behavior predict academic performance. Journal of Research in Personality, 40, 339-346.
5. Festervand, J. L., & Festervand, T. A. (2006). The impact of integration, affirmative action, and diversity on minority student recruitment at the University of Alabama: A longitudinal perspective. Journal of Diversity Management, 1, 25-34.
6. Goldman, B. A. (1990). Accuracy of college students‟ perceptions of their SAT scores, high school and college grade point averages relative to their ability. Perceptual and Motor Skills, 70, 514-
7. Hezlett, S., Kuncel, N., Vey, A., Ones, D., Campbell, J., & Camara, W. J. (2001). The effectiveness of the SAT in predicting success early and late in college: A comprehensive meta-analysis. Paper presented at the National Council of Measurement in Education, Seattle, WA.
8. Kuncel, N.R., Hezlett, S. A., & Ones, D. S. (2004). Academic performance, creativity, and job
performance: Can one construct predict them all? Journal of Personality and Social Psychology, 86, 148– 161.
9. Lawlor, S., Richman, S., & Richman, C. L. (1997). The validity of using the SAT as a criterion for black and white students‟ admission to college. College Student Journal, 31, 507-515.
10. Lumadi, M. W. (2008). Managing diversity at higher education and training institutions: A daunting task. Journal of Diversity Management, 3, 1-10.
11. McKinney, A. P., Carlson, K. D., Mecham, R. L., D‟Angelo, N., & Connerley, M. L. “Recruiters‟ Use of GPA in Initial Screening Decisions: Higher GPAs Don‟t Always Make the Cut.” Personnel Psychology, 56, 823-845.
12. Mouw, J. T., & Khanna, R. K. (1993). Prediction of academic success: A review of the literature and some recommendations. College Student Journal, 27, 328-336.
13. Nguyen, H.H.D., O‟Neal, A., & Ryan, A. M. (2003). Relating test-taking attitudes and skills and stereotype threat effects of eh racial gap in cognitive ability test performance. Human Performance, 16, 261-293. 14. Pettijohn, T. F. II (1995). Correlations among college students‟ grade point averages and American college
test scores. Psychological Reports, 76, 336-338.
15. Potosky, D., Bobko, P., & Roth, P. (2005). Forming composites of cognitive ability and alternative measures to predict job performance and reduce adverse impact: Corrected estimates and realistic expectations. International Journal of Selection and Assessment, 13, 304-315.
16. Ramist, L., Lewis, C., & McCamley-Jenkins, L. (1994). Student group differences in predicting college grades: Sex, language and ethnic groups. New York: College Entrance Examination Board College Board Report No. 93-1, EST RR No. 94.27.
17. Roth, P. L., BeVier, C. A., Switzer, F. S., & Schippmann, J. S. (1996). Meta-analyzing the relationship between grades and job performance. Journal of Applied Psychology, 81, 548-556.
18. Roth, P. L, & Bobko, P. (2000). College grade point average as a personnel selection device: Ethnic group differences and adverse impact. Journal of Applied Psychology, 85, 399-406.
19. Roth, P. L., & Clarke, R. L. (1998). Meta-analyzing the relationship between grades and salary. Journal of Vocational Behavior, 53, 386-400.
20. Rynes, S., Orlitzky, M. O., & Bretz, R. D. (1997). Experienced hiring versus college recruiting: Practices and emerging trends. Personnel Psychology, 50, 309-339.
22. Schmitt, N., Oswald, F. L., Kim, B. H., Imus, A., Merritt, S., Friede, A., & Shivpuri, S. (2007). The use of background and ability profiles to predict college student outcomes. Journal of Applied Psychology, 92, 165-179.
23. Sternberg, R. J. (2006). The Rainbow Project: Enhancing the SAT through assessments of analytical, practical, and creative skills. Intelligence, 34, 321-350.
24. Thomas, M. K. (2004). The SAT II: Minority/Majority test-score gaps and what they could mean for college admissions. Social Science Quarterly, 85, 1318-1334.