4596 IJSTR©2020
www.ijstr.org
MINIMUM WAGE CORRELATION
WITH CONSUMER PRICE INDEX PREDICTIONS
USING SUPPORT VECTOR REGRESSION
Mimin Fatchiyatur Rohmah, I Ketut Gede Darma Putra, Rukmi Sari Hartati, Luki Ardiantoro
Abstract— Every increase in the City / District Minimum Wage certainly affects the economy in Indonesia. One effect is the Consumer Price Index (CPI) because prices of staple goods / services have also increased.. With increased production, high consumption will also increase, so producers will indirectly increase the price of the goods. The correlation between Minimum Wage with Consumer Price Indeks Prediction in eight regions in East Java including are Surabaya, Malang, Jember, Probolingo, Banyuwangi, Kediri, Sumenep and Madiun. This study proposes a new prediction approach that is built on a predicting model based on the Consumer Price Index from Statistics Indonesia East Java Province using the RBF kernel with the Support Vector Regression (SVR) method in five Cities and three Districts and the output is the predics of CPI values for Foodstuffs. The Mean Absolute Percentage Error (MAPE) value excellent prediction criteria because it is less than 3 percent, so the Correlation between CPI and Minimum Wage for 2019 in eight regions to have a good performance, because it has an R- Square Correlation of 0.8539.
Index Terms — Minimum Wage, SVR, CPI, MAPE, R-Square.
—————————— ——————————
1
INTRODUCTION
The City-District Minimum Wage is determined by the governor by considering the recommendations of he Provincial Wage Council, in addition to the recommendation of the regent or mayor. The specified minimum wage value is usually greater than the provincial minimum wage. Every November 1st the Provincial Minimum Wage and the City-District Minimum Wage are announced simultaneously for each Governor. And for the City-District Minimum Wage established and announced no later than November 21 after the Provincial Minimum Wage stipulation. The amount of the City or District Minimum Wage is far greater than the Provincial Minimum Wage. So that some cities are higher than in the capital, for example in Bekasi and Kerawang. The effect of increasing the City-District Minimum Wage will reduce state income, because with a high City- District Minimum Wage level the state must automatically increase the amount of the state budget for workers working in the formal sector, such as in the education sector, namely the salary of a civil servant, teacher, lecturer, etc. The effect of increasing the City-District Minimum Wage then the company is threatened with bankruptcy. Not all companies in the country of Indonesia are large companies, so for companies that are of the lower middle class if the City-District Minimum Wage is increased, of course the company will also raise the salaries of its workers. If workers 'salaries go up, company spending on workers' salaries will also increase. This has an effect on middle to lower class companies. With high expenditure the company's cash is reduced and potentially bankrupt. If the company goes bankrupt, workers will also be unemployed because they do
not have a job. So that it will increase the unemployment rate [1], [2]. Increasing City-District Macroeconomic of Islam is actually permissible, but for the government that has the authority to raise it must really consider the impact of what will happen after the City-District Minimum Wage is raised. Both the impact of the company and the impact on the world economy. as inflation explained. But how can all of the negative impacts of the increase in the City-District Minimum Wage be minimized [3], [4]. One indicator in the national economy that is useful for providing information on the development of prices of goods and services in an area is the Consumer Price Index (CPI). According to Statistics Indonesia (https://www.bps.go.id), the Consumer Price Index is an index that calculates the average change in prices of goods and services consumed by households in a certain period of time. CPI is an indicator used to measure the inflation rate (www.sirusa.bps.go.id). While inflation is the tendency of rising prices of goods and services which is a basic need of the community that continues over time. According to Mankiw et all, the Consumer Price Index (CPI) is a measure of the total cost of goods and services purchased by consumers and is also used to determine the consumption patterns of people in an area [5]. Forecasting or commonly referred to as prediction is an attempt to predict something that will happen in the future by utilizing various relevant information in the previous period (historical data), through a scientific method. While the purpose of prediction is to get information on what will happen in the future with the greatest probability of occurrence. There are 2 methods in prediction, namely qualitative methods in which data collection is based on the opinions of experts in their fields and quantitative methods namely prediction methods by utilizing time series analysis. The method of collecting data is done periodically (times series), that is, data is taken in the order of time in which the variable taken is related to the variable in the previous time [6] - [9]. From the description above, it is formulated:
- City-District Minimum Wage Correlation Judging from the Prediction of the Consumer Price Index. - Predict in the consumer price index by applying the ————————————————
1,4
Informatics Engineering, Universitas Islam Majapahit, Indonesia, E-mail: [email protected], [email protected]
2
Informatics Engineering, Universitas Udayana, Indonesia, E-mail: [email protected]
3
4597 IJSTR©2020
www.ijstr.org Support Vector Regression Method whether it
correlates with the Minimum Wage of City-District. The limitation in this study as an input variable is the price data of staple commodity consumers in eight regions in East Java that have CPI as determined by Statistics Indonesia namely Surabaya, Malang, Madiun, Kediri, Probolinggo, Banyuwangi, Sumenep and Jember, which has a monthly CPI that can be viewed on the website Statistics Indonesia, as a target variable, and secondary data / input variables can be seen on http: siskaperbapo.com. Siskaperbapo website presents data on consumer prices of basic commodities that are related to previous data, current data and future data. The following table is an input variable taken on the Disperidag website, with 34 attributes. By using the SVR method, the prediction results regarding CPI are obtained and then the results from the predictions are used to analyze the City / District Minimum Wage. This research method consists of several stages, namely identifying problems, library research, data collection, system design, system implementation and system analysis.
2 BASIC THEORY
2.1 Support Vector Regression (SVR)
Support Vector Regression is part of the Support Vector Machine (SVM) which discusses predictions that have been discussed since 1999 by Vladimir Naumovich Vapnik [10], known as SVM-Regression. SVR and SVM the difference is in the output and its application in the system. SVR data mining can be used for forecasting such as forecasting/predicting the Consumer Price Index. In SVM, it looks for the best separator function on two infinite objects by increasing the distance of two unequal objects, while SVR finds functions that have deviations the largest of the actual output yi. With the SVR method the function f (x) can be a dividing line in the form of a regression function, in which all input data have the greatest deviation from the actual target yi for all training data and make the smallest error [10] – [16].The purpose of the SVR method is to map the input vector to a higher dimension and the error is ignored if it is less than epsilon. Epsilon () is the margin / degree of tolerance to errors [10]. The advantage of the SVR method compared with the linear regression method in the linear regression algorithm is that the output is a linear function, while the SVR output trend data follows the formed data path for example, wavy, so that the predicted data output is more accurate. In previous studies, many CPI forecasting was done using the SVR method by Ye Wang et al [8] and by Zhang at al [10]. In the regression function f (x) if the deviation limit (ε) is equal to 0, a perfect regression function is obtained, shown in Figure (1), while the SVR linear model for the regression function matches the equation below [ [15] - [20]:
(1)
(x) : the result of mapping the function x in the input space
w : weight vector b : bias
x : input vector f(x) : regression function
The coefficients w, b to reduce the risk function, like the following equation:
(2)
with limitations:
=1, 2, 3,…
With Lε as penalty function, penalty of
error >= ε
=
(3)
Lɛ : Loss function bertipe ε-insentive loss function R : Risk Function
||w|| : Normalisasi w
ε : Epsilon yaitu deviasi/ derajat toleransi error C : (deviasi>batas error)
The optimization problem for the proper condition is as follows :
Feasible optimization = Min ||w||2 (4)
With boundary:
(xi)
where i = 1, 2,…,
Equation (3) assumes all points are within the appropriate margin : f(x) ± ε. The figure of suport vector regression can see in Fig.1.
Input Space Feature Space Fig. 1. Support Vector Regression (SVR)
2.2 Kernel Function
4598 IJSTR©2020
www.ijstr.org 2.3 Consumer Price Index (CPI)
The price of goods or services paid by consumers by comparing current and previous prices is known as the Consumer Price Index. The way to determine CPI is by knowing the changes in prices of goods or services in consumers that ordinary people consumers. Commodities for CPI include goods or services divided into seven groups including:
Food / Raw Materials,
Processed / Processed Foods, Beverages, Cigarettes / Tobacco,
Housing, Water, ElectriCities, Gas / Fuel, Clothing,
Health,
Education, Sports / Recreation,
Transportation, Communication / Financial Services.
(5)
Pn = current price Po = base year price
In East Java the calculation of CPI is carried out in 8 regions including three districts and five cities. The Districts including (Banyuwangi, Jember, Sumenep) and the Cities including (Probolinggo, Malang, Madiun, Kediri and Surabaya). The type of CPI used in the reference is the food CPI contained in (https://jatim.bps.go.id), which is in the CPI e-book in 82 cities in Indonesia for 2016, 2017, 2018. The CPI and percentage change by expenditures grup Malang in 2018 can see in Table 2.
TABLE 2
CPI and Percentage Change by Expenditures Group Malang in 2018 (https://jatim.bps.go.id)
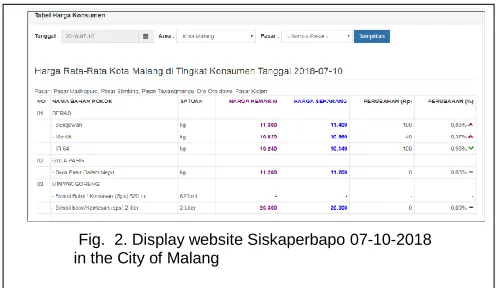
In Fig. 2, raw data from input data supporting CPI from food in website http: siskaperbapo.com are managed by Disperindag East Java, such as the data in Figure 2, consists of consumer / producer price data and data on availability which is updated every time/day as follows:
Fig. 2. Display website Siskaperbapo 07-10-2018 in the City of Malang
2.4 Mean Absolute Percentage Error (MAPE)
MAPE is a relative error measure. MAPE states the percentage of errors forecasting from actual requests during the specified period to be provides information on the percentage of errors too high / low, in other words MAPE is the average absolute error over a certain period which is then multiplied by 100% so get a percentage result.
MAPE = x100%
(6) Xi = data actual value of period i Fi = data prediction value of period i n = predict time period
Based on research from Chang, Wang et.all, 2007 [11], Prediction Criteria for MAPE as follows:
For MAPE < 10% have excellent prediction criteria, and than 10% - 20% good prediction criteria, and then 20%-50% criteria predictions are sufficient, lastly 50 percent greater have bad prediction criteria.
3 RESEARCH METHODOLOGY
The method used in this study uses the SVR method using the Kernel RBF. The result is by comparing the predicted After that the CPI prediction results are correlated with the Cities-Districts Minimum Wages in eight regions in East Java. The training data used in the research as input variable are data on the prices of staple commodity consumers in eight regions as explained earlier, which has a monthly CPI that can be viewed on the website bps.go.id as the target variable, and secondary data/ input variables can be seen on the website siskaperbapo. The website presents Pricing data to Consumers. Data on consumer prices for these staple commodities is related to previous data, current data and future data. The following table is an input variable taken on the Disperidag website (www.siskaperbapo.com), with 34 attributes as input variabel.Retrieval of data for three years from 2016 until 2018. The Target Variable is the value of the Consumer Price Index of the Foodstuffs Group, namely Y = CPI. The amount of data used as Input Variables is 816 for each region. While the target variable consists of one TABLE 1
Type of Kernel Function
N O
Type of kernel
function Kernel Function Formulation
1 Linear ( , )=
2 Polynomial ( , )= d=1,2,………
3
Gaussian - Radial Basis
Function (RBF)
( , )= exp )
( , )=exp
4599 IJSTR©2020
www.ijstr.org attribute (CPI) so that the total is 840 data.
3.1 Research Step
Identifying problems to predict CPI for foodstuffs in eight regions.
Study of the prediction concept with the SVR method, CPI theory, data utilization from the website of the East Java of Statistics Indonesia, located in Surabaya. Input variables from Disperindag, siskaperbapo web and
CPI data target variables, the results of the test are correlated with to analyze the value of the Cities / District Minimum Wage in the eight regions.
Retrieve data online from the siskaperbapo website from 01-01-2016 until 31-12-2018, the data is taken daily updated.
Collection of CPI data for monthly foodstuffs for the period 01-01-2016 to 31-12-2018, which is taken monthly from the website www.bps.go.id for the eight regions.
Preprocessing data, as many as 35 attributes, consisting of 34 attributes as input variables, namely the price of staple commodities in eight regions, and while one attribute as a target (CPI).
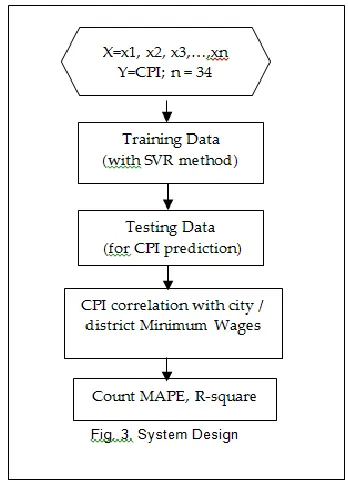
Analysis of the SVR method with MATLAB software, by dividing data into training data and testing data; analysis of the SVR method with the RBF Kernel function, to get the MSE value, MAPE, c as iteration value and the bias of the Gaussian RBF function by predicting with the model and is correlated with the Minimum Wage value for three years in 8 regions. The system design can see in Fig.3.
4 IMPLEMENTATION
In testing the SVR method training data, to predict CPI in testing data with a certain degree of accuracy. After that, test the SVR program that has been made whether it is suitable for the application of CPI value prediction. Test the program
from 01-01-2016 to 31-12-2018 using the RBF Kernel Function. The number of training data conducted was 816 data trials (each region), while the testing data were 840 data. The results of the CPI prediction are correlated with the Cities / Districts.
4.1 Testing Result
First by testing the training data for 2016-2017 it is set to 2018-2019. Where for the input data in 2019 use input data in 2018. Then the result is as follows:
A. For five cities including Surabaya, Madiun, Kediri, Probolinggo, Malang can see in Figure 4 until figure 8.
From curva Fig. 4., the (4, 11, 15)th month, the CPI prediction approach:
Actual Data : 133.71; 132.82; 134.15
Prediction Data : 133.83; 133.09; 133.83
MAPE = 0.769
From curva Fig. 5., the (5, 14, 17)th month, the CPI prediction approach:
Actual Data : 124.03; 125.33; 124.77 Prediction Data : 124.53; 125.34; 124.53 MAPE = 0.972
Surabaya:
Fig. 4. CPI Predicton Curve for Surabaya
Madiun
Fig. 5. CPI Predicton Curve for Madiun
4600 IJSTR©2020
www.ijstr.org
Malang
B.For three Districs: Sumenep, Jember, Banyuwangi can see on figure 9 until figure 11.
From the results of CPI predictions for 2019 for eight regions, a correlation table can be made between the average CPI predictions with the city / district Minimum Wage as Table 3 below.
TABLE 3
Predicted Average CPI and Minimun Wage-2019 From curva Fig. 6., in the (8, 9, 13)th month, the
CPI
prediction approach:
Actual Data : 120.25; 119.24; 121.12 Prediction Data : 120.27; 119.08; 120.95 MAPE = 0.669
From curve Fig. 7., in the (4, 10, 14)th month, the CPI prediction approach:
Actual Data : 124.80; 122.73; 124.58 Prediction Data : 124.67; 122.89; 124.46 MAPE = 0.962
From curve Fig. 8., in the (9, 12, 19, 23)th month, the CPI prediction approach:
Actual Data : 136.17; 137.32; 138.87; 137.09 Prediction Data : 136.43; 137.54; 139.21; 137.29 MAPE = 1.263
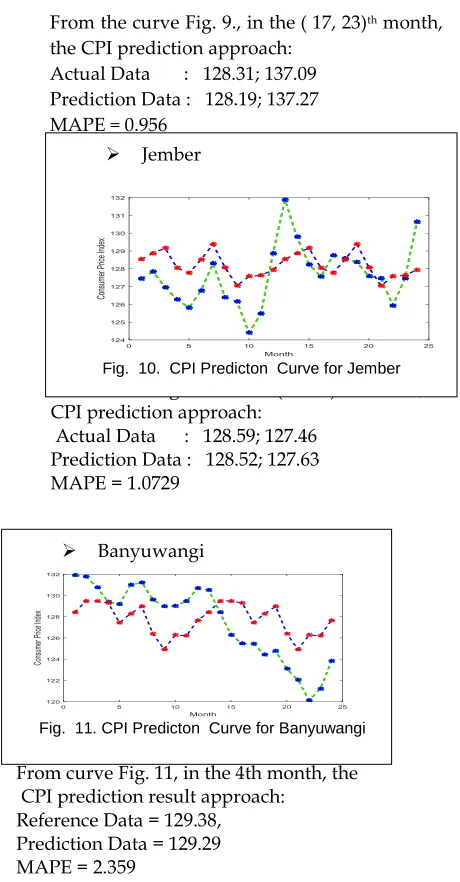
From the curve Fig. 9., in the ( 17, 23)th month, the CPI prediction approach:
Actual Data : 128.31; 137.09 Prediction Data : 128.19; 137.27 MAPE = 0.956
From curve Fig. 10., in the (18, 23)th month , the CPI prediction approach:
Actual Data : 128.59; 127.46 Prediction Data : 128.52; 127.63 MAPE = 1.0729
From curve Fig. 11, in the 4th month, the CPI prediction result approach:
Reference Data = 129.38, Prediction Data = 129.29 MAPE = 2.359
Probolinggo
Fig. 7. CPI Predicton Curve for Probolinggo
Fig. 7. CPI Predicton Curve for Probolinggo
Sumenep
Fig. 9. CPI Predicton Curve for Sumenep
Jember
Fig. 10. CPI Predicton Curve for Jember
Banyuwangi
Fig. 11. CPI Predicton Curve for Banyuwangi
Malang
4601 IJSTR©2020
www.ijstr.org From the 3rd table a regression is made between the
Average Consumer Price Index and the City / District Minimum Wage for 2019, the following regression results are obtained as Fig.12a-c below.
Figure 12b. Correlation graph between CPI Prediction and Minimum Wages (ordo 3) in 2019
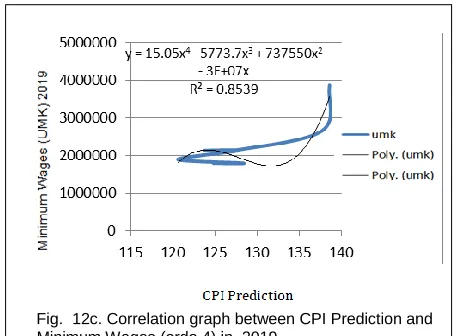
Fig. 12c. Correlation graph between CPI Prediction and Minimum Wages (ordo 4) in 2019
From Fig. 12 (a, b, c) it can be explained that the correlation between prediction CPI and minimum wage for 2019 forms a polynomial regression, with square (Correlation or R-squared) as follows:
For order 2, with the equation y = 542.62x2 - 52061x and R² = 0.6863.
In order 3, the value of R-squared is getting better, namely R2 = 0.7912.
While getting closer to number 1, for the value of R-squared in the 4th order polynomial equation that is with the value of y = 15.05x4 - 5773.7x3 + 737550x2 - 3E + 07x with R² = 0.8539, it can be said that the performance is getting better because R2 is close to 0.8539.
If the order is increased again the value of R-Square is found to be from number 1.
5
CONCLUSION
This study proposes a new predicting approach that is built on a predicting model based on the Consumer Price Index from Statistics Indonesia East Java Province using the RBF kernel with the SVR method consisting of 34 variable price staples in five Cities and three Districts and the output is the predict of CPI values for Foodstuffs. The Mean Absolute Percentage Error (MAPE) value excellent prediction criteria because it is less than 3 percent, so the Correlation between CPI and Minimum Wage for 2019 in eight regions to have a good performance, because it has an R- Square Correlation of 0.8539.
ACKNOWLEDGMENTS
This research was carried out with the cooperation of DIKTI (Ministry of Research, Technology and Higher Education of the Republic of Indonesia), under the Collaborative Research between Colleges or PKPT scheme in 2019. Where this research activity was carried out in collaboration with the Faculty of Engineering, Udayana University, as TPM (Partner Research Team). And also the author would like to thank the Statistics Indonesia of East Java province, which has explained about the data that researchers need and also about the process of the Consumer Price Index, especially CPI for foodstuffs. The researcher also thanked the The city/district Predicted
CPI Minimum Wage (Rp) Surabaya city 138.6117 3871052.61 Malang city 137.7792 2668420.1 Jember district 128.2092 2170917.8 Probolinggo city 123.754 2137864.48 Banyuwangi district 127.7337 2132779.35 Kediri city 120.6141 1899294.78 Sumenep district 128.3549 1801406.09 Madiun city 124.8201 1801406.09
Fig. 12a. Correlation graph between CPI Prediction and Minimum Wages (ordo 2) in 2019
4602 IJSTR©2020
www.ijstr.org Disperindag of East Java province for giving a lot of
explanation about the price change process that is on the siskaperbapo website.
REFERENCES
[1] A. Marinda, Nasikh, I. Mukhlis and et al., ―The Analysis of the Economic Growth, Minimum Wage, And Unemployment Rate to the Poverty level in East Java‖, International Journal of Economic Research, 2017.
[2] Azar, J A, E Huet-Vaughn, I Marinescu, B Taska, and T von Wachter, "Minimum wage employment effects and labor market concentration", NBER working paper 26101, 2019.
[3] F.N. Mustika, E. Setyowati, A. Alam, ―Analysis of Effect of ZIS (Zakat, Infaq, And Shadaqah), Regional Domestic Products of Bruto, Regional Minimum Wage and Inflation on Levels Poverty in Indonesia 2012 - 2016‖, Journal of Islamic Economic Laws, Vol. 2, No. 2 : 193-211, 2019. [4] Tjandra, Surya, ―Labour law and development in
Indonesia ―, http:/hdl.handle.net/1887/37576, holds various files of this Leiden University Dissertation, 2016.
[5] N.G. Mankiw, ―Principles of Microeconomics‖, Published by South-Western College Pub,2017. [6] W.W.S. Wei,. ―Time series Analysis Univariate and
Multivariate Methods‖. New York: Pearson education, Inc, 2016.
[7] S.D. Agustina, Mustakim., et al, ―Support Vector Regression Algorithm Modeling to Predict the Availability of Foodstuff in Indonesia to Face the Demographic Bonus‖, IOP Conf Journal of Physics: Conf. Series 1028, 2018.
[8] H. Mahjub et al, ―Performance Evaluation of Support Vector Regression Models for Survival Analysis‖: A Simulation Study International Journal of Advanced Computer Science and Applications, Vol. 7, No.6, 2016.
[9] Y. Wang, B. Wang, X. Zhang, ―A New Application Of The Support Vector Regressionon The Construction Offinancial Conditions Index To CPI Prediction‖ , International Conference on Computational Science, ICCS, Procedia Computer Science 9, p 1263-1272, 2012.
[10]V.N. Vapnik, ―Statistical Learning Theory‖. Wiley, New York, NY, 1998.
[11]P.C. Chang, et al. ―The Weighted Evolving Fuzzy Neural Network for PCB Sales Forecasting Elsevier‖, 32 (Expert Systems with Applications), p 86-96, 2007.
[12] J.A. Azar, E. Huet-Vaughn, I Marinescu, B Taska, and T von Wachter, "Minimum wage employment effects and labor market concentration", NBER working paper 26101, 2019.
[13]M. Caliendo, A. Fedorets, Malte Preuss, C. Schröder, L. Wittbrodt, ―The Short-Run Employment Effects of the German Minimum Wage Reform‖, IZA – Institute of Labor Economics, 2017.
[14] J. Meer and J. West, E_ects of the minimum wage
on employment dynamics. Journal of Human Resources, 51 (2), 500-522, 2015.
[15]H. Okudaira et al, ―Minimum wage effect s across heterogeneous markets‖, VOX CEPR Policy Portal (Research-based policy analysis and commentary from leading economists), 2019.
[16]Z. Rustam and P. Kintandani, ―Application of Support Vector Regression in Indonesian Stock Price Prediction with Feature Selection Using Particle Swarm Optimisation‖. Hindawi Modelling and Simulation in Engineering Volume 2019, Article ID 8962717, 5 pages, 2019.
[17]B. Scholkopf and A. Smola, ―Learning With Kernel‖, MIT Press, 2002.
[18]B. M. Henrique, V. A. Sobreiro, and H. Kimura, ―Stock priceprediction using support vector regression on daily and up tothe minute price,‖ Journal of Finance and Data Science, vol. 4,
no. 3, pp. 183–201, 2018.
[19] B. Miranda, H. Vinicius, A. Sobreiro, H. Kimura, ―Stock Price Prediction Using Support Vector Regression On Daily And Up To The Minute Prices‖, The Journal of Finance and Data Science 4, 2018. [20]I.A. Budiastuti, S.M.S. Nugroho, M. Hariadi,