Evolution of nuclear properties in the long chain of Sn isotopes from A=100
to A=132
V. I. Isakov1,a
1Petersburg Nuclear Physics Institute, NRC Kurchatov Institute
188300 Gatchina, Russia
Abstract. This paper presents results of both microscopical and semi-empirical calculations of single-particle characteristics of nuclei and nuclear binding energies, as well as their root-mean-square radii, excitation energies and transition rates in the long chain of Sn isotopes, from the extremely neutron deficient100Sn up to neutron excess136Sn, where the experimental information is available by now. The comprehensive comparison with the experimental data is carried out.
Nuclear binding energies B, as well as one-nucleon separation energies S, are the major nuclear characteris-tics that define borders of nuclear stability and the decay modes of nuclei. Study of evolution of nuclear properties in the long chains of isotopes or isotones, from the extremely proton-excess up to the extremely neutron-excess nuclei is of special theoretical interest, as here one can check the adequacy of the used theoretical models in the broad inter-val of (N−Z)/A. Formerly, [1] we studied in details the chain of theN =82 isotones. Different long chain is rep-resented by the sequence of the nickel isotopes from48Ni
up to78Ni, where all nuclei, except for78Ni, turn out to be discovered by the present time. The mentioned chain is of special interest as it includes doubly-magical nucleus48Ni
(which is an extremely proton-excess one), and78Ni (the
last one is strongly neutron-excess, and also the doubly-magical nucleus). This chain also includes doubly doubly-magical
56Ni and semi-magical68Ni. The mentioned series of
iso-topes was theoretically analyzed by us in [2]. Another long isotopical chain is offered by the succession of tin isotopes havingZ =50. The experimental data are available from
102Sn (N = 52) up to136Sn (N = 86). These nuclei are
theoretically studied by us here.
For description of global properties of these isotopes we apply the Hartree–Fock–Bogoliubov method. We also use the approach based on the phenomenological mean field potential that was defined by us before [3]. This po-tential correctly takes into account isovector terms, which is very important when we consider long isotopical chains of nuclei. Here, we examine global properties of nuclei, such as their masses, root-mean-square radii of nucleon distributions, one- and two-nucleon separation energies, as well as single-particle energies of protons and neutrons. We also study excitation energies of nuclei, as well as the reduced transition rates as respect to the electromagnetic and weak transitions.
To define nuclear binding energiesBin the self-consistent approach, we performed calculations based on the HF+BCS procedure that employs the Skyrme interaction and con-stant pairing with the corresponding proton and neutron
a e-mail:[email protected]
pairing constantsGpandGnto account for pairing correla-tions. In this case, one can represent the total energy of an even-even nuclei in its ground state in the following form, see the details in [4, 5]:
E = −B = ∫
HHFBCS(r)dr−
∆2
n
Gn −
∆2
p
Gp. (1)
Here and below, “n” refers to neutrons, while “p” to pro-tons. Pairing correlations in the Hartree–Fock–Bogoliubov energy densityHHFBCS(r) were considered by introducing
the occupanciesv2
i into the single-particle density of mat-ter, as well as into the kinetic energy and spin densities. In this way, the Hartree–Fock problem with modified den-sities was solved in coordinate representation, while the iteration procedure was applied for joint solution of the HF+BCS equations.
In our self-consistent calculations we used parameters of the Skyrme 3 interaction, while the pairing constantsG were close to those from [6]. The exchange Coulomb terms were treated in the Slater approximation. In our calcula-tions we considered all bounded single-particle levels as well as the quasi-stationary states.
One can see the values of the obtained binding energies for even isotopes of Sn in figure 1. In accordance with the experiment, the maximal binding energy per one nucleon happens for stable isotopes havingA∼124.
In figure 2, we show both theoretical and empirical values of the two-neutron separation energiesS2n for the sequence of the even Sn isotopes. One can see the good agreement with the experiment. In particular, we observe rapid fractures of the values S2n at N = 82 and N = 50, these fractures correspond to the closure of the cor-responding neutron shells. Unfortunately, the mass of the Z = 50,N = 48 nucleus is unknown yet in the experi-ment. Note that we observe very small singularity of the curve atN =64 (if at all). This is in contrast with the sit-uation characteristic for isotones having N = 82, where one can see the visible fracture atZ =64. This peculiarity, in aggregate with other experimental data, affords ground to consider146Gd as a nucleus having the features of the magical one [7].
DOI: 10.1051/
C
Owned by the authors, published by EDP Sciences, 2012
epjconf 20123/ 811002
This is an Open Access article distributed under the terms of the Creative Commons Attribution License 2 0 , which . permits unrestricted use, distributi and reproduction in any medium, provided the original work is properly cited.
Fig. 1.Binding energies per nucleonB/Ain the chain of the tin isotopes calculated with the standard Skyrme 3 and constant pair-ing interactions. All the experimental data concernpair-ing nuclear masses are from the Atomic Mass Evaluation (AME 03), see [8].
Fig. 2.Two-neutron separation energiesS2nin the chain of even tin isotopes. The calculations are performed within the HFBCS (Skyrme 3+constant pairing) scheme.
Together with the self-consistent potential, we used also the phenomenological one. We defined this potential in [3], and it has the form
V(r, σ)=U·f(r)+Uls· 1 r
d f
drl·s; f(r)=
1
1+exp((r−R)/a). (2) In Eq. (2), U = V0
(
1−βN−AZ·tz
)
, Uls =Vls
(
1−βlsN−AZ·tz
)
, R = r0A1/3,tz=1/2 for neutrons andtz = −1/2 for pro-tons. In the case of protons we added to (2) the poten-tial of a uniformly charged sphere withRc = rcA1/3. The parameters of potential used here were as follows:V0 =
−51.0 MeV,Vls=32.4 MeV·fm2,r0=1.27 fm,rc=1.25 fm,
β=1.31,βls=−0.6, anda =0.6 fm for both neutrons and protons. These parameters are very close to those from the paper [3].
In figure 3, we show evolution of the proton single-particle energies in the sequence of even tin isotopes as calculated by using the phenomenological and the self-consistent approaches. One can observe the similar behav-ior of the proton levels calculated in the framework of both schemes. We see that the energies of the proton single-particle levels decrease with the increase of the neutron numberN when we approach the neutron drip line, this
Fig. 3.Proton single particle energiesεnl jin the chain of tin iso-topes in the WS and the HFBCS schemes. The HFBCS proce-dure used the Skyrme 3 plus constant pairing interactions with
Gn=21/AMeV.
Fig. 4.Proton separation energiesSpin the chains ofZ=51 and
Z=50 isotopes as functions of the neutron numberNcalculated by using the phenomenological [3] WS scheme. Arrows show closest as respect to the gap single-particle proton orbit.
tendency is reproduced by the isotopical dependency of the central potentialUin Eq. (2).
Fig. 5.Proton separation energiesSp forZ = 51 andZ = 50 calculated in the exact HFBCS method.
agree-Fig. 6.Neutron single particle energiesεnl jin the chain of tin isotopes calculated in the WS and the HFBCS (standard Skyrme 3 plus constant pairing interaction withGn=21/AMeV) schemes.
ment is over the magnitudes of the separation energies as well as over the values ofJπfor the isotopes withZ =49 andZ = 51. One can see the existence of the large gap corresponding to the closure of the proton shell having Z=50, for all values ofNin the interval 50≤N≤82.
In figure 6, we show evolution of the neutron single-particle levels for the succession of even isotopes of Sn. Here, one can see the striking difference between the fore-casts as given by the WS and the HFBCS (Skyrme 3+ pair-ing) schemes. The neutron levels obtained in the frame-work of the self-consistent method do not follow the iso-topical dependence of the central phenomenological po-tential (2). Self-consistent calculations show that by the approach to the neutron drip line bounded neutron lev-els close to the Fermi surface resist their extrusion into continuum. This gives a chance for existing very neutron-excess even Sn isotopes that are stable as respect to the neutron emission. Single-particle levels are not the observ-able ones, especially if we are far from the filled shells. So, let us compare the observable values, for example the one-neutron separation energies obtained in the frameworks of two methods. We show in figure 7 results of calculations of single-neutron separation energiesSn(nl j) for a sequence of Sn isotopes in the framework of the phenomenological potential by using the ansatz:
Sn(nl j)(N+1)=−λn(N)−Eminnl j(N+1) and
Sn(nl j)(N−1)=−λn(N)+Eminnl j(N−1); Nis even, while
λis chemical potential. Results of concurrent calculations, but performed in the HFBCS approach are shown in fig-ure 8. Here, separation energies are found as differences of the corresponding binding energies. It is remarkably that both calculations lead to similar results and agree with the experiment.
By now, there exist large experimental information on the values of the root-mean-square charge radii of tin iso-topes, the majority of information is obtained by means of methods of the laser spectroscopy. Thus, we performed corresponding calculations, both for protons and for neu-trons. In Table 1 we show results of our calculations that were carried out in the self-consistent procedure by using both standard and modified (see below) Skyrme 3 schemes. Both calculations lead to close results. One can observe an agreement with experiment accurate within 0.3 %.
Fig. 7.Neutron separation energiesSnin the chain of tin isotopes calculated in the WS scheme.
Fig. 8.Neutron separation energiesSnin the chain of tin isotopes calculated in the HFBCS approach (Standard Skyrme 3+pairing withGn=21/AMeV).
We also calculated proton and neutron density distribu-tions for even isotopes of tin both in the standard Skyrme 3+pairing, and in the WS schemes. The pattern of these distributions for the nuclei120Sn, that is close to the
sta-bility line is shown in figure 9. Both methods lead to close results.
0 1 2 3 4 5 6 7 8 9 10 11 12
0.00 0.02 0.04 0.06 0.08 0.10 0.12
Proton density, HFBCS Neutron density, HFBCS Proton density, WSBCS Neutron density, WSBCS
Radius, fm Density, fm-3
Rp(rms)HFBCS = 4.639 fm
Rn(rms)HFBCS = 4.760 fm
Rmatt(rms)HFBCS = 4.710 fm
Rp(rms)WSBCS = 4.597 fm
Rn(rms)WSBCS = 4.813 fm
Rmatt(rms)WSBCS = 4.724 fm
RP(rms)exp = 4.655(2) fm
(2p 1s muon transition); Rp(rms)exp = 4.651(2) fm
(laser spectroscopy).
Fig. 9.Proton and neutron densities in120Sn in the WSBCS and the HFBCS schemes;Gn=21/AMeV.
Table 1.Root-mean-square radiiRpandRnof the proton and the neutron distributions in the even isotopes of Sn, in the units of fm. Experimental data are borrowed from the electronic database [11] and from [12]. Calculations are performed by using the HFBCS method with the Skyrme 3 interaction and constant pairing having the standard value of the pairing constant [6],Gn =21/AMeV. Results of calculations performed by using the modified mean-field spin-orbital term are shown in square brackets.
N R(p)th R(p)exp R(n)th
50 4.464 [4.469] – 4.387 [4.392]
52 4.484 [4.489] – 4.434 [4.439]
54 4.503 [4.508] – 4.478 [4.482]
56 4.521 [4.527] – 4.519 [4.523]
58 4.540 [4.545] 4.558(3) 4.557 [4.560] 60 4.558 [4.563] 4.577(3) 4.594 [4.596] 62 4.575 [4.580] 4.594(2) 4.628 [4.630] 64 4.592 [4.596] 4.609(2) 4.662 [4.664] 66 4.609 [4.612] 4.624(2) 4.696 [4.697] 68 4.624 [4.628] 4.639(2) 4.728 [4.730] 70 4.639 [4.643] 4.651(2) 4.760 [4.762] 72 4.654 [4.658] 4.663(2) 4.791 [4.794] 74 4.668 [4.672] 4.673(3) 4.816 [4.819] 76 4.683 [4.686] 4.683(4) 4.840 [4.844] 78 4.696 [4.700] 4.692 6) 4.863 [4.867] 80 4.710 [4.714] 4.702(7) 4.884 [4.889] 82 4.724 [4.727] 4.709(8) 4.905 [4.909]
84 4.739 [4.742] – 4.962 [4.950]
like particles and in a particle–particle channel this inter-action coincides with the interinter-action used in the paper [10]. Our effective interaction ˆϑhas the form
ˆ
ϑ=(V+Vσσ1σ2+VTS12+Vττ1τ2+Vτσσ1σ2·τ1τ2 (3)
+VτTS12τ1τ2
)
exp(−r212/r200)+ e
2
r12
(
1 2−tˆz(1)
)(
1 2 −tˆz(2)
)
.
The entering parameters are as follows:V=−16.65,Vσ= 2.33,VT =−3.00, Vτ =3.35, Vτσ =4.33, VτT =3.00 (all these values are in MeV), whiler00=1.75 fm.
Using the standard procedure, we can pass to the quasi-particle basis,a+→ξ+:
a+α = u|α|ξ+α−v|α|φαξ−α;u2|α|+v2|α| = 1 ;φα=(−1)lα+jα−mα. (4) Supposing the presence of correlations in the true ground state|˜0⟩of an even–even nuclei, we define the creation op-eratorQ+n,J Mof the one-phonon excited state|ωn,J M⟩with
|ωn,J M⟩=Q+n,J M|˜0⟩in the following way:
Q+n,J M = ∑
a≥b
Xnj,J ajb
[
ξ+
aξ+b
]
J M−
∑
c≥d
Ynj,J cjd
[ξ
cξd
]
J M , (5) where
[
ξ+
aξ+b
]
J M = 1
√
1+δjajb
∑
mamb CJ Mj
amajbmbξ + jamaξ
+
jbmb, (6)
[ξ
cξd]J M = 1
√
1+δjcjd
∑
mcmd CJ Mj
cmcjdmdξjc−mcξjd−md·φcφd, (7) Xnj,J
ajb=⟨ωn;J M|
[
ξ+
aξ+b
]
J M|˜0⟩,Y n,J
jcjd=⟨ωn;J M|
[ξ
cξd
]
J M|˜0⟩. (8)
In Eqs. (6), (7) and belowδjajb = δjajbδlalbδnanb.
One may obtain the set of the QRPA equations which define the amplitudes “X” and “Y” of the states|ωn,J M⟩ and the eigenvaluesωn. These equations have the form
[(E−−ωB)I+A]−[(E+Bω)I+A]×
( X Y )
= 0. (9)
Here,E =Eab =Eja+Ejb, Icd,ab =δjajcδjbjd, while the matrix elements of the sub-matricesAandBin the case of even–even nuclei are as follows:
Acd,ab ≡AJjcjd,jajb=
(
ujcujdujaujb+vjcvjdvjavjb
) × ×a⟨jcjd;J|ϑˆ|jajb;J⟩a +
+ (ujcvjdujavjb+vjcujdvjaujb
)
a⟨jcj¯d;J|ϑˆ|jaj¯b;J⟩a +
+(−1)ja+jb+J+1(v
jcujdujavjb+ujcvjdvjaujb
) ×
×a⟨jcj¯d;J|ϑˆ|jbj¯a;J⟩a; (10)
Bcd,ab ≡ BJjcjd,jajb =
(
ujcujdvjavjb+vjcvjdujaujb
) × ×a⟨jcjd;J|ϑˆ|jajb;J⟩a−
(
ujcvjdvjaujb+vjcujdujavjb
) × ×a⟨jcj¯d;J|ϑˆ|jaj¯b;J⟩a+(−1)ja+jb+J × (11)
× (vjcujdvjaujb+ujcvjdujavjb
)
a⟨jcj¯d;J|ϑˆ|jbj¯a;J⟩a. In Eqs. (10) and (11), a⟨jcjd;J|ϑˆ|jajb;J⟩a and a⟨jc¯jd;J|ϑˆ|ja¯jb;J⟩aare the antisymmetric matrix elements of the effective interaction ˆϑ in the particle–particle and particle–hole channels with a given spin. They have the form
a⟨jcjd;J|ϑˆ|jajb;J⟩a =
1
√
(1+δjcjd)(1+δjajb)
× (12)
×[⟨jcjd;J|ϑˆ|jajb;J⟩ +(−1)ja+jb+J+1⟨jcjd;J|ϑˆ|jbja;J⟩
]
,
a⟨jc¯jd;J|ϑˆ|ja¯jb;J⟩a = −
(−1)lb+ld
√
(1+δjcjd)(1+δjajb)
×
× ∑
J′
(2J′+1)W[jbjajcjd;J J′] × (13)
×[⟨jbjc;J′|ϑˆ|jdja;J′⟩+(−1)jd+ja+J ′+1
⟨jbjc;J′|ϑˆ|jajd;J′⟩
]
.
Using an explicit form of the matrix equation (9), we obtain the orthonormality relation
∑
a≥b
Xnj,J ajbX
m,J jajb−
∑
c≥d
Ynj,J cjdY
m,J jcjd
= δmn, (14)
which in terms of the QRPA bosons corresponds to the condition
⟨ωn,J M|ωm,J M⟩ = ⟨˜0|Qn,J M·Q+m,J M|˜0⟩ = δmn. (15) Considering the transition rates, we must distinguish between two different types of transitions, namely, transi-tions between the phonon states (i.e., between the two ex-cited states), and the phonon–ground-state transitions. The latter transition is described by the reduced matrix element
⟨˜0∥M(λ)∥ωn,J⟩ = (−1)λδ(J, λ)δ(πnπλ) × (16)
×[ ∑
ja≥jb Xnj,J
ajb(ujavjb±vjaujb) (−1)lb
√
1+δjajb
⟨ja∥mˆ(λ)∥jb⟩ −
−∑
ja≥jb Ynj,J
ajb(vjaujb±ujavjb) (−1)lb
√
1+δjajb
⟨ja∥mˆ(λ)∥jb⟩
]
where the upper signs refer to T-even (Eλ), while the lower ones to T-odd (Mλ) transitions.
One can show that the “phonon–phonon” matrix ele-ment has the form
⟨ωn,J′∥Mˆ(λ)∥ωm,J⟩=[(2J+1)(2J′+1)]1/2 ×
× ∑
ja≥jb,jc≥jd
[ Xmj,J
ajbX n,J′ jcjd±Y
m,J jajbY
n,J′ jcjd
] √
(1+δjajb)(1+δjcjd)
× (17)
×{δjbjdW[λjcJ jb;jaJ ′](u
jcuja∓vjcvja)⟨jc∥mˆ(λ)∥ja⟩ −
− (−1)jc+jd+J′δ
jbjcW[λjdJ jb;jaJ ′](u
jduja∓vjdvja) ×
× ⟨jd∥mˆ(λ)∥ja⟩ − (−1)ja+jb+JδjajdW[λjcJ ja;jbJ ′] ×
×(ujcujb∓vjcvjb)⟨jc∥mˆ(λ)∥jb⟩+(−1)
ja+jb+J+jc+jd+J′ ×
×δjajcW[λjdJ ja;jbJ ′](u
jdujb∓vjdvjb)⟨jd∥mˆ(λ)∥jb⟩
}
,
where the upper signs refer to Eλ, while the lower ones – to Mλ transitions. In figure 10, we show systematics of
ex-48 50 52 54 56 58 60 62 64 66 68 70 72 74 76 78 80 82 84 86 88 0
1 2 3 4 5 6
E, MeV
Experimental data for the 21 +
levels
Experimental data for the 31
levels
Theoretical QRPA data for the 21 +
levels
Theoretical QRPA data for the 31
levels
Neutron number N
E
x
c
it
a
ti
o
n
e
n
e
rg
y
Fig. 10.Experimental and theoretical energies of the 2+1 and 3−1 states in even isotopes of Sn. Our basis included 10 proton and 15 neutron single-particle levels.
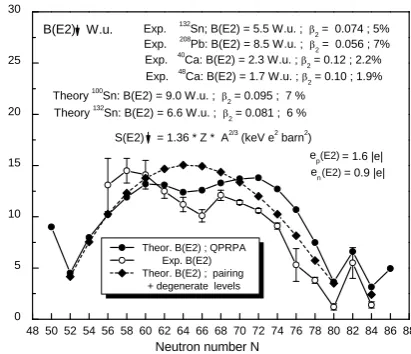
perimental and theoretical energies of the first quadrupole and octupole states in the sequence ofN-even isotopes of Sn, while figure 11 demonstrates the comparison of theo-retical and experimental values ofB(E2). For magical nu-clei we also show here fractions of the corresponding tran-sition rates as compared to the total sum rule. One can find results of alternative calculations in the paper [13]. Here we used values of corresponding effective charges defined by us before in description of the E2 transitions in the vicinities of208Pb and132Sn. Similar comparison, but for
theE3 transitions is shown in figure 12. One should men-tion here previous calculamen-tions [14–16] performed for nu-clei where the experimental information is available.
Results of the more detailed calculations for130Sn are
shown in figure 13. Here we also show results of our RPA calculations obtained by solution of the Bethe–Salpeter equa-tion in media. Results of the analogous calculaequa-tions, but for
102Sn are shown in figure 14. By now, there exist two sets
of experimental data pertinent to102Sn, namely [17], and
[18]. Being strongly different from each other, they both lead to anomalously large values of the effective neutron charge as defined from the 6+to 4+transition.
48 50 52 54 56 58 60 62 64 66 68 70 72 74 76 78 80 82 84 86 88 0
5 10 15 20 25 30
Theor. B(E2) ; QPRPA Exp. B(E2) Theor. B(E2) ; pairing + degenerate levels
B(E2)
Exp. 208
Pb: B(E2) = 8.5 W.u. ; β2 = 0.056 ; 7% Exp. 132Sn; B(E2) = 5.5 W.u. ; β2 = 0.074 ; 5%
W.u.
Neutron number N
Theory 132Sn: B(E2) = 6.6 W.u. ; β2 = 0.081 ; 6 % Theory 100
Sn: B(E2) = 9.0 W.u. ; β2 = 0.095 ; 7 %
ep en
= 1.6 |e| = 0.9 |e|
(E2)
(E2)
Exp. 40
Ca: B(E2) = 2.3 W.u. ; β2 = 0.12 ; 2.2% Exp. 48
Ca: B(E2) = 1.7 W.u. ; β2 = 0.10 ; 1.9%
S(E2) = 1.36 * Z * A2/3 (keV e2
barn2 )
Fig. 11.Reduced transition rates from the 2+1 states in even iso-topes of Sn. Dashed line shows results of calculations performed by using only degenerate neutron levels of the 50–82 shell and the pairing interaction. The corresponding curve line (parabola) is normalized to theoretical (QRPA) transition rate in130Sn. The sum rule evaluation corresponds to the uniform charge distribu-tion withR=1.2A1/3fm. Experimental data are borrowed from the papers [19]–[24].
48 50 52 54 56 58 60 62 64 66 68 70 72 74 76 78 80 82 84 86 88 0
5 10 15 20 25 30 35 40 45 50 55
Exp. B(E3) Theor. B(E3)
B(E3) W.u.
Exp. 132
Sn; B(E3) > 8 W.u.; Exp. 208Pb; B(E3) = 34 W.u.;
Neutron number N
lower limit
Exp. 40
Ca; B(E3) = 24 W.u.; Exp. 48Ca; B(E3) = 6 W.u.;
β3=0.40; 12% β3= 0.20; 4%
β3= 0.11 ; 7%
β3 > 0.09 ; > 4%
Theory 100
Sn: B(E3) = 50 W.u. ; β3 = 0.22 ; 15 %
Theory 132
Sn: B(E3) = 25 W.u. ; β3= 0.15 ; 12 %
ep = 1.35 |e|
en = 0.35 |e|
(E3)
(E3)
S(E3) = 0.0294 * Z * A4/3 (keV e2
barn3 )
Fig. 12.Reduced transition rates from 3−1 states in even isotopes of Sn. The experimental data are from [25].
The structure of the lowest states in102Sn strongly
de-pends on the mutual disposition of the neutron d5/2 and
g7/2states, and is sensitive to the spin-orbit splitting. In the
Skyrme scheme this splitting is generated by the parameter W, that defines the strength of the two-body sporbit in-teraction. At the same time, some spin-orbit splitting arises also from the spin-density term, which is usually ignored in the Skyrme single-particle equations. The contribution of this term into splitting is proportional to
(t1−t2)
∑
jα
v2
jα(2jα+1)
[
jα(jα+1)−lα(lα+1)−3 4
] R2j
α(r),
(18) wheret1andt2are the Skyrme force parameters.
-0.5 0.0 0.5 1.0 1.5 2.0 2.5 3.0 0+ , g.s. 2+ 7
-4+2
+
5-4
-6+8
+
10+
E, MeV
B(E2; 2+
0+
)= 1.2(2)
B(E2; 4+ 2+)= 2.2(8)
B(E2; 6+
4+
)= 2.5(2)
B(E2; 8+ 6+)
B(E2; 10+
8+
)= 0.38(4)
B(E2; 5-- 7--)= 1.4(2)
(all in W.u.)
exp. QRPA
RPA
ep =1.6, en=0.9 en = 0.9
0+ 0+
2+
0+
7
-4+2+
6+ 5
-8+ 10+ 4 -2.10 1.63 1.75 0.41 1.72 -- 1.08 4.01 1.07 1.05 0.65 0.25 1.06 2+ 0+
4+7
-6+5
-8+2
+
10+
Fig. 13.Spectra of levels and transition rates in130Sn. The exper-imental data are from [26] and [27].
0 1 2 3
exp. QRPA RPA
E, MeV 0+ ,gr.st. 2+ 4+ 6+ 0+
,gr.st. 0+,gr.st.
2+ 0+ 4+ 6+ 2+ 4+
5+3+
B(E2; 6+
4+
)exp=
B(E2; 6+
4+
)th. =0.32 W.u. B(E2; 6 +
4+
)th= 0.33 W.u.
2+
0+
4+
62+
+
4+
5+3+
Lipoglavsek, et al.,
en= 3.74(+0.76-0.80) en= 3.68(+0.65-0.85)
T1/2 = 0.62 (+0.43-0.19)µs
∆E = 48 keV
5.53(+2.46-2.28) W.u
T1/2= 0.367(11)µs; ∆E = 87.6(3) keV
B(E2) = 3.0(1)W.u. en= 2.75(5) en=2.72(5)
(νg7/2 νd5/2)
(νd5/2)2
B(E2; 2+
0+
)th = 4.5 W.u.
B(E2; 4+
2+
)th =0.86 W.u.
1+
B(E2; 2+
0+
)th = 1.97 W.u.
B(E2; 4+
2+
)th = 1.60 W.u.
1+
T. Faestermann, et al.
(ep=1.6, en=0.9) (en=0.9)
Fig. 14.Structure of levels and transition rates in102Sn. Leading configurations shown in the figure correspond to the case, when the neutron 2d5/2state is lower than the 1g7/2one.
filled 1g9/2 proton and neutron sub-shells, this
contribu-tion is small and of the opposite sign as compared to that mediated by the spin-orbit two-body interaction. However, we also performed calculations with inclusion of the spin-density term into the corresponding single-particle equations. The results are shown in figure 15, from which we see that here the spin-orbital splitting really decreases a little, with the main effect of variation of the mutual dispo-sition of the neutrond5/2andg7/2levels in even isotopes of
Sn close toA=100. Here, the neutrong7/2level proves to
be lower than thed5/2 one, this difference may be
impor-tant for description of the electromagnetic transition rates in these nuclei. One can observe the same pattern for the proton levels. It is very important that such modification of the Skyrme single-particle potential in practice does not influence the results of calculations shown in figures 1, 2, and figure 8. The influence of this term on the values of the root-mean-square radii is also small, as one can see from Table 1. We note here that spin-density terms, by their im-pact on binding energies and on the spin-orbital splitting, in a way simulate the two-body tensor interaction. Our cal-culations show that the reasonable variation of the mutual disposition of thed5/2 andg7/2 states may really lead to
some increase of theB(E2; 6+1 → 4+1) in102Sn, but in any
46 50 54 58 62 66 70 74 78 82 86 90
-12 -11 -10 -9 -8 -7 -6
WS, 3s1/2 state WS, 2d3/2 state WS, 1g7/2 state WS, 2d5/2 state ws, 1h11/2 state HFBCS, d5/2 state HFBCS, g7/2 state HFBCS, s1/2 state HFBCS, d3/2 state HFBCS, h11/2 state
Neutron number N
1h11/2 2d3/2 3s1/2 2d5/2 1g7/2 d5/2 g7/2 s1/2 d3/2 d5/2 g7/2 s1/2 132Sn exp h11/2 d3/2 100 Snexp g7/2 d5/2
ε
nlj
,
MeVFig. 15.Neutron single particle energiesεnl jin the chain of even isotopes of tin calculated in the WS and the HFBCS approaches (with modified Skyrme 3 scheme).
case the value of the neutron effective charge is more than 2. At the same time, the available experimental data man-ifest [28] that in nuclei close to100Sn thed
5/2 state is the
lowest one.
100
Sn
0+,gr.st.
6+,gr.st. 2+ 3+ 4+ 1+ 2+ 4+ 5+ 3+ 5+ 7+ 7+ 6+ 8+ 100 In
νd5/2 πg9/2
νg7/2 πg9/2
EC, β+ 15
N(1/2-)
Final state |GA/GV|
1.120(158)
17
O(5/2+) 1.153(181)
18
O (0+) 1.040(122)
18
F (1+) 1.041(110)
39
K (3/2+
) 1.134(210)
41
Ca(7/2-) 1.107(108)
42
Ca (6+) 1.118(62)
54
Fe (6+) 1.073(123)
55
Co(7/2-) 1.338(150)
57
Ni(3/2-) 0.942(165)
57
Ni(1/2-) 1.115(179)
Average 1.097(148)
Q
EC = 4.31(20) MeV T
1/2 = 1.16(20) s C. Hinke, et al. Nature (2012)
B(GT) = (160/9) sh.m.
(14.8) RPA
100
In(1+) 1.00(15)
Theory, Isakov Phys.At.Nuc.(2002)
Other calculations of spectra: Grawe (2003), Stone and Walters(1985)
2.66 MeV
Theory, Isakov PHAN 2009
(1.24 for a free neutron)
Fig. 16.Structure of levels and EC/β+transition rate in100In.
Authors of the recent paper [29] carefully measured QEC andT1/2 for the very strong Gamow–Teller
transi-tion from 0+(g.s.,100Sn) to 1+in100In. This gives us the
opportunity to define the|GA/GV|ratio for this transition. The comparison of the obtained result with the results of our our recent calculations [30] performed for otherN∼Z nuclei are shown in figure 16. We see that the renormal-ization of the GA constant in nuclei as compared to that in the decay of a free neutron is very small. Note that in our calculation for the decay of100Sn we did not take into
consideration fragmentation of theπg9/2andνg7/2 states,
this fragmentation is not known in the experiment in nu-clei close to100Sn. However, we considered similar effects in other nuclei. The account of this fragmentation will lead to a further small increase of the|GA/GV|ratio in the decay of100Sn.
neutron-deficient100Sn up to the neutron-excess132Sn. For
description of different nuclear properties we used more-or-less standard methods, as well as previously defined en-tering parameters, and obtained results that are mainly in agreement with the experiment.
Our results show that the neutrond5/2 andg7/2 states
of the 50−82 shell are separated from theh11/2,d3/2 and
s1/2ones. It exhibits in the downfall of theB(E2; 2+1 →0+1)
values and in a small raising of theE(2+1) energies atN ∼ 64, both effects are seen in the experiment. At once we do not see the fracture of theS2nvalues atN=64.
We notice that the value of the neutron effective charge defined from the 6+1 → 4+1 transition in 102Sn is
abnor-mally large. At the same time, it was shown in [31] that by using the experimental value [32] ofB(E2; 8+1 →6+1) in
98Cd, we obtain the anomalously small value of the proton
effective charge. One may conventionally assume the pres-ence of strong superfluid correlations in nuclei just close to
100Sn. This results in suppression of the transition matrix
elements between the two-quasiparticle states in98Cd due to the factor (u1u2 −v1v2), and thus leads to the increase
of the proton effective charge. However, we are unable to explain in this way experimental data in102Sn. For a while
we do not have satisfactory quantitative explanation of ab-normal values of the effective charges.
Our calculations denote that the quenching of the M1 transition rates in nuclei against those calculated with the bare value ofGAis small.
Acknowledgement
This work was performed under the support of the Russian Foundation for Basic Research
(grant no. RSGSS-65751.2010.2).
References
1. K.I. Erokhina, V.I. Isakov, B. Fogelberget al., Part. and Nucl. Lett. No. 4 (107), 5 (2001)
2. V.I. Isakov, Phys. At. Nucl.73, 1515 (2010)
3. V.I. Isakov, K.I. Erokhina, H. Machet al., Eur. Phys. J. A14, 29 (2002)
4. V. I. Isakov, K. I. Erokhina, B. Fogelberget al., Part. and Nucl. Lett. No. 5102, 44 (2000)
5. D. Vautherin and D. M. Brink, Phys. Rev. C 5, 626 (1972)
6. V.G. Soloviev,Theory of Complex Nuclei(Pergamon Press, Oxford, 1976)
7. S.A. Artamonov, V.I. Isakov, Yu.N. Novikovet al., Part. and Nucl.20, No. 2, 440 (1989)
8. G. Audi, A.H. Wapstra, and C. Thibault, Nucl. Phys. A729, 337 (2003)
9. M. Baranger, Phys. Rev.120, 957 (1960)
10. K. Heyde and M. Waroquier, Nucl. Phys. A167, 545 (1971)
11. I.N. Boboshin, V.V. Varlamov, Yu.P. Gangrskyet al., http://cdfe.sinp.msu.ru/services/radchart/radmain.html 12. I. Angeli, At. Data Nucl. Data Tables87, 185 (2004) 13. N. Lo Iudice, Ch. Stoyanov, and D. Tarpanov, Phys.
Rev. C84, 044314 (2011)
14. V. Gillet, D. Giraud, and M. Rho, Phys. Rev.178, 1695 (1969)
15. A.P. Severyukhin, V.V. Voronov, Ch. Stoyanov, and N. Van Giai, Phys. At. Nucl.66, 1434 (2003)
16. A.P. Severyurhin, V.V. Voronov, and N. Van Giai, Eur. Phys. J. A22, 397 (2004)
17. M. Lipoglavsek, D. Seweryniak, C.N. Davids et al., Phys. Lett. B440, 246 (1998)
18. T. Faestermann, Private communication;
http://www.nscl.msu.edu/brown/EFES-2010/pdf/ faestermann.pdf
19. S. Raman, C.W. Nestor Jr., and P. Tikkanen, At. Data Nucl. Data Tables78, 1 (2001)
20. D.C. Radford, C. Baktash, J.R. Beeneet al., Eur. Phys. J. A25, Suppl. 1, 383 (2005)
21. R.L. Varner et al., Eur. Phys. J. A25, Suppl 1, 391 (2005)
22. J. Cederc¨all, A. Ekstr¨om, C. Fahlander et al., Phys. Rev. Lett.98, 172501 (2007);EGP Workshop( Paris, 2008)
23. A. Ekstr¨om, J. Cederc¨all, C. Fahlanderet al., for the IS418 Collaboration,ISOLDE Workshop(CERN 17– 19 Dec., 2007)
24. A. Jungclaus, J. Walker, J. Leske et al., Phys. Lett. B695, 110 (2011)
25. R.H. Spear, A.M. Baxter, S.M. Burnett, and C.L. Mil-ler, At. Data Nucl. Data Tables42, 55 (1989)
26. http://www-nds.iaea.or.at
27. K.I. Erokhina, V.I. Isakov, B. Fogelberg, and H. Mach, Preprint PNPI-2225 (Gatchina 1998)
28. D. Seweryniak, M.P. Carpenter, S. Grosset al., Phys. Rev. Lett.99, 022504 (2007)
29. C.B. Hinke, M. Bohmer, P. Boutachkovet al., Nature 486, 341 (2012)
30. V.I. Isakov, Phys. At. Nucl.72, 33 (2009)
31. V.I. Isakov and K.I. Erokhina, Phys. At. Nucl. 65, 1431 (2002)


![Table 1. Root-mean-square radii Rp and Rn of the proton and theneutron distributions in the even isotopes of Sn, in the units of fm.Experimental data are borrowed from the electronic database [11]and from [12]](https://thumb-us.123doks.com/thumbv2/123dok_us/9026013.1439353/4.595.75.268.159.369/table-theneutron-distributions-isotopes-experimental-borrowed-electronic-database.webp)