5665 IJSTR©2020
www.ijstr.org
Support vector regression in statistical
downscaling for rainfall forecasting
Ana Fauziah, Dian Angreni, Agustina Pradjaningsih, Abdul Riski, Alfian Futuhul Hadi
Abstract—In recent atmospheric global climate change, rainfall forecasting has an important role especially in the archipelagic-agricultural country like Indonesia. We use statistical downscaling to get rainfall forecasting in order to support plantation crops in Kabupaten Jember. Therefore, long-term forecasting in this case is really needed. Statistical downscaling methods seek to draw empirical relationships that transform large-scale feature of global atmospheric condition called General Circulation Model (GCM) to a local scale rainfall variable. In this study we use Support Vector Regression (SVR) to construct the empirical relationship in Statistical Downscaling approach. The three grid size of GCM (8x8,10x10,12x2) were used to develop models and the best identified model was used for simulations of future rainfall forecasting. The result show that all the models in each grid sizes are able to simulate rainfall, however, SVR model in 8x8 grid size slightly better than other grid sizes and we get the SVR-SD’s cross-validation accuracy of 61.77 of Root Means Square Error (RMSE) and 78% R-square. Then we obtain forecasting value or rainfall for 2019-2020 period.
Index Terms— GCM, Grid size,Statistical downscaling, PCA, SVR, Precipitation,Rainfall Forecasting .
—————————— ——————————
1 INTRODUCTION
ndonesia is an agricultural country which agriculture has important role in the whole national economy [1]. The agricultural sector is very vulnerable to climate change because not only it influences cropping patterns, but also affects planting time, production yields, and quality of yields [2]. Climate change occurs because of changes in climate variables, one of which is rainfall. Several studies indicate that the high and low intensity of rainfall has an impact on the descreased crop yield and crop failure. Thus, rainfall forecasting information is needed.The Indonesian region has a complex topography and interaction between sea, land and atmosphere, so an accurate rainfall forecasting model is needed at a local scale by considering information about global atmospheric circulation that can be obtained from the General Cirulation Model (GCM) output. GCM is a spatial and temporal oriented model that is able to produce large global circulation characteristics such as continental and annual scale or decade [3]. GCM has been designed to simulate the past, present and future climate and it is used to predict long-term climate patterns [4]. GCM information which is still on a global scale cannot be directly used for smaller scale phenomena. To obtain these values, projection of climate variable must be downscaled from GCM due to coarse resolution of GCM.
Statistical Downscaling (SD) is a downscaling technique in which data on a large-scale grid over a certain period and time period is used as a basis for determining data on a smaller scale grid. The SD model is basically a regression model that involves a function between one or more predictor variables and or one predictand variable. One of the most important step in downscaling is to select appropriate predictors [5,6]. The variable can be used as predictor if a relationship exists between the predictor and predictant. In this study, the predictand variable is local rainfall and the predictor variable is precipitation. Precipitation is an important parameter for climate change impact studies [7]. GCM domain is used as a predictor with many dimensions according to the number of grids. A large number of predictor variables will become problem such as multicollinearity and curse of dimensionality
problem.
One of the SD techniques based on linear regression such as principal component regression can be a solution in these problems by performing dimension reduction [8]. Principal component regression is regression analysis technique that is based on principal component anaysis that have be carried out by Weilun et. al and Aji [9,10]. In previous studies [11], rainfall forecasting in kabupaten Jember was downscaled using the principal Component Regression combined with ARIMA. However, this method is linear regression that it cannot handle problem in non linear situation [12]. Predictor which is GCM data and predictand, local variable such as rainfall, generally have nonlinear characteristics and non gaussian distribution. SD techniques based on nonlinear and non-parametric regression are needed. Research conducted by Shivam, Chen and Darshana [13,14,15] used Support Vector Machine (SVM) and Artificial Neural Network (ANN) to overcome these problems. SVM was first introduced by Vapnik in the late 1960s and it is an artificial intelligence-based method that has advantages in pattern recognition optimization systems and good generalization capabilities. This is because training SVM equivalents by solving convex optimization problems that produce optimal and unique global solutions [16]. SVM can be used for nonlinear data regression cases with large amounts of data input and continuous output. This SVM method is also called Support Vector Regression (SVR).
2 MATERIAL AND METHOD
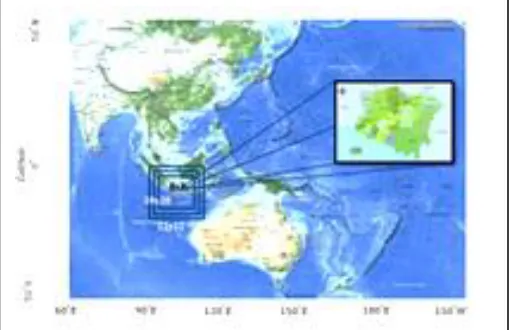
2.1 Study Region5666 Fig. 1. Location map of kabupaten Jember with three grid size.
such as Tobacco. The dry season generally occurs in May to August and the rainy season occurs in September to January, whereas it ranges from 1.969 - 3.394 mm per year [17]. Jember is one of region affected by climate change inflict hydrometeorological disasters such as droughts and floods. This will affect the agriculture and plantation sectors. Thus, it is necessary to anticipate such as forecasting rainfall in the future.
2.2 Data Description
This study the predictand is monthly rainfall data in kabupaten Jember during 2005 – 2017 period taken from 77 observation station points. The GCM output data which is the predictor variables follows the monthly rainfall for the period of January 2005 to December 2017 for 3 spatial grid size: 64 grid points whose latitude ranges from -16.25
֯
N to 1.25֯
N and longitude from 103.75֯
E to 121.25֯
E, 100 grid points whose latitude ranges from -18.75֯
N to 3.75֯
N and longitude from 101,25֯
E to 123,75֯
E and 144 grid points between -21,25֯
N to 1,25֯
N latitude and 98.75֯
E to 126.75֯
E longitude were downloaded from the page http://climexp.knmi.nl/select- field_cmip5.cgi.2.3 Method Description
2.3.1 Principal Component Analysis (PCA)
PCA is widely applied in meteorology or climatology literature [18]. PCA is a multivariate statistical procedure to identify the pattern of multidimensional variables and to transfer correlated varabels into a set of uncorrelated variables or be independent of one another called principal components (PCs). PCs are combinations of old variables and still keeping
the most valuable parts of old variables even when we drop one or more Pcs. The PCA model can be stated in the following equation
1 1 1 11 1 21 2 ... p1 p Y PC e X e X e X e X
12 1 2 2
2 2 2 2 ... p2 p
Y PC e X e X e X e X
. . .
Where var
PCi
ei ei and covThere are several ways to determine an appropriate number of PCs i.e seeing the cummulative variance that has been explained by more than 80% and choosing PCs with eigenvalue more than 1[19]. For determine number of PCs we can also look for an elbow in the scaree plot [20].
2.3.2 Support Vector Regression (SVR)
Support Vector Regression (SVR) is an SVM development for regression. SVR performs linear regression in the high dimension feature space using ε-insensitive loss function proposed by Vapnik [21],
and for otherwise
at the same time SVR tries to reduce model complexity by minimizing . This can be described by introducing slack variables ,i=1,..,n, to measure the deviation of training samples outside insensitive zone. Thus SVR is formulated as minimization of the following function:
s.t.
i=1,..,n
this optimization problem can transformed into the dual problem [22] and its solution is obtained considering the lagrange as:
Where are lagrange multiplier and parameter can be adjusted follows:
Then the final decision function:
from the application of mecer’s theorem, ———————————————
Ana Fauziah
Department of Mathematics, Faculty of Mathematics and Natural Science, University of Jember, Jember, Indonesia
E-mail: [email protected] A.F. Hadi
Department of Mathematics, Faculty of Mathematics and Natural Science, University of Jember, Jember, Indonesia
E-mail: [email protected] 2 w * , i i
2 * 1 1 min 2 n i i iw C
║
, ( , )
0 ( , )L
y f x w if y f x w
, ,
( , )L
y f x w y f x w
1p 1 2p 2 ... pp p
p p p
Y PC e X e X e X e X
Ti i
w x y b
–T
i i
y w x b
*
i i
2 *
1 1 1 , , *, , * 2 n n T
i i i i i i
i i
L w w C y w x b
║
*
* * 1 1 * 1n n n
T
i i i i i i i
i i i
i w x y b
* * , , , w
* 1
( i )
n
i
i xi
w
*
1 ( ) = n T Ti i i i j
i
f x w x b x x b
xi T
xj K x x
i, j
5667 IJSTR©2020
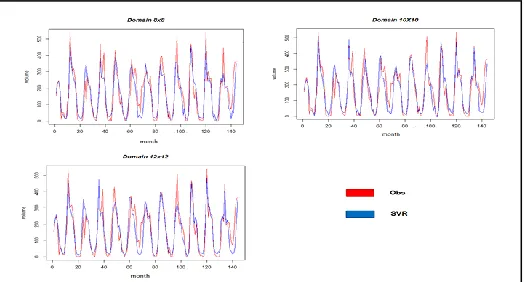
www.ijstr.org Fig.2 Comparison of monthly observed and simulated precipitation
using SVR model for 3 square domain size.
where represent the non linear tranformation function defined to convert a non linear problem to linear problem in high dimensional feature space. defined as the kernel function.
The expression for decision function becomes:
SVR performance depends on a good setting of parameters C and kernel parameters. Parameter tuning can choose the correct parameter while defining a model, save a lot of time and help deploy the model faster.
2.4 Method Evaluation
In this study the performance of the SVR model was evaluated using RMSE and . RMSE is performance index to determine the accuracy of the SVR model in predicting the target values. RMSE is a measure of how spread out these residuals or error that has occurred between the test values and the predicted values. A smaller RMSE value indicates a better model, mathematically:
RMSE =
The coefficient of determination symbolized is the proportion of the variance in the dependent variable that is predictable from the independent variable(s). Its provides a measure of how served outcomes are replicated by the model, based on proportion of total variationof outcomes explained by the model[23].
3
MODEL DEVELOPMENT
Predictors were taken from GCM data according to the period of local data from 2005 to 2017 (156 months) and the target location of estimation as a predictant model in this study using monthly rainfall in kabupaten Jember from 2005 to 2017. Data for this period is divided into training and testing data. The training data which is taken as 2005 - 2016 and the testing set as the remaining 12 months (2017).
The optimal domain determination produces an accurate rainfall estimation model. The domain chosen for optimization consists of 3 square grid size, 8x8, 10x10 and 12x12. The three grids size have a high number of predictor variables, i.e 64, 100 and 144 predictor variables. Therefore, PCA, in this study used to reduce the dimension of variable for each domain size. The new variable from reduction results are used to build the SVR model. Kernel function is used to obtain nonlinear problem in the SVR model. RBF kernel function was chosen because it has a high sensitivity on model performance and it can map data to infinite dimensions and can overcome the problem of predictor relations and non-linear responses [24,16]. In this study SVR has two parameters to be determined: the width of RBF (γ) and penalty factor (C). A tuning procedure, which can automatically optimize parameters, is applied to select them.
The performance of simulation models is evaluated by RMSE and . Compare the value of RMSE and in each grid size to get the best grid size with the minimum RMSE value and maximum . The simulation result using training data for each grid size are shown in the following Fig.2 The the training data is used to establish the regression function and the testing set. Fig.2 shows that, generally, simulation by SVR is close to the observed precipitation in training and testing data for all grid size.
Table 1 has shown that there is small difference and RMSE between 3 grid size but 8x8 grid size with the minimum RMSE value and maximum is the best domain and suitable for simulation of future regional rainfall.
4
R
ESULT ANDD
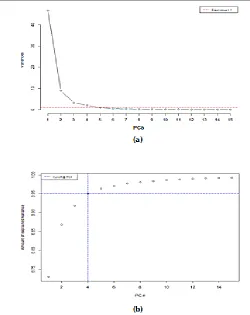
ISCUSSIONGrid size 8x8 has 64 predictor variables. The PCA method was then applied to extract principal components (PCs) which are orthogonal. The obtained PCs is based on an eigenvalue more than 1 and preserve more than 95% of the variance.
From Fig.3. the first 4 PCs have eigenvalues of more than 1 and 95% of the information variance, so that the number of new predictor variables that are used for forecasting models consist of 4 PCs. The development model of SVR using RBF kernel with parameter γ is 1 and parameter C is 1 which are used to simulated the testing data.
TABLE1
RESULT OF PERFORMANCE STATISTICS
IN DIFFERENT GRID SIZES
Domain Size PCs
Parameter
RMSE
γ C
8x8 4 1 1 61.77 78%
10x10 5 0.1 10 71.40 70%
12x12 6 0.1 5 67.60 73%
(.)
i, j
K x x
x iK x
i, j
f
x b2
R
1
2
1 ˆ
i n i
i
y y
n
22
2 ˆ
1 – 1 –
( )
i i
i
R SS Error y y
SS Total y y
2
R R2
2
R
2
R
2
R
2
R
2
5668 Fig.3. (a) Elbow in the scaree plot (b) cummulative variance plot.
Fig. 4. M onthly rainfall of observed (obs) and simulated by SVR in 2017.
Fig. 5. Monthly rainfall of simulated by SVR during 2019-2020 period.
The presented SD result in Fig.4 has well perform with RMSE is 71.60 and is 68 % and it is inferred that the observed values have same pattern and quite close to the simulated data.
Therefore, a SVR model used to simulations for the future regional rainfall in 2019 - 2020 period. From the fig 5 the result follow the same pattern of past studies on historical rainfll in the study area which low rainfall in August and increasing trend of rainfall during September to December.
5 CONCLUSION
SVR is an effective statistical downscaling technique to rainfall forcasting in kabupaten Jember. The proposes method could be used in further research to downscale other predictands such as temperature and evaporation. Domain determination using a square grid size is considered more practical, but a study of GCM domain determination is still needed to get a better estimate that results in a high correlation.
A
CKNOWLEDGMENTWe thanks to all member of DATA SCIENCE Research Group, and all member of the Statistical Laboratory, Department of Mathematics of The University of Jember. We also thanks to the Faculty of Mathematics and Natural Sciences, The University of Jember, Indonesia.
R
EFERENCES[1] Mubyarto. 1989. Pengantar ekonomi pertanian. Jakarta: LP3ES
[2] Nurdin. 2011. ―Antisipasi perubahan iklim untuk keberlanjutan ketahanan pangan‖. Srikpsi. Sulawesi Utara: Universitas Negeri Gorontalo
[3] H.W. Aji, A. Djuraidah, S. Sahriman,‖Statistical downscaling dengan pergeseran waktu berdasarkan korelasi silang‖ Jurnal Meteorologi dan Geofisika16 1 19-24, 2015.
[4] Alan R, P.T. Richard, A.H. Mark, A. Thomas, A. Rigoberto, S.C. Hsin, V. K. S. Mannava,‖ Use of general circulation model output in the creation of climate change scenarios for impact analysis‖, Climatic Change, 23 4 293-335, 1993.
[5] D. Martin, B. Josef, Z. Zdenek,‖ High-frequency and low-frequency variability in stochastic daily weather generator and its effect on agricultural and hydrologic modelling ―, Climatic Change63 145-179, 2004.
[6] H.Bruce, G.C. Robert, ―Climate downscaling: technique and application‖, Climate Research7 85-95, 1996.
[7] K.G. Manish, S.P.O Chandra, ―Evaluation of various linear regression methods for downscaling of mean monthly precipitation in arid pichola watershed‖, Natural Resources1 1 11-18, 2010.
2
5669 IJSTR©2020
www.ijstr.org
[8] G. Subimal , P.M. Pradeep,‖ Future rainfall scenario over orissa with GCM projections by statistical downscaling‖, Current Science 90 3 396-404, 2006.
[9] T. Weilun, Y. Fadhilah, Y. Zulkifli, ‖Non-homogenous hidden markov model for daily rainfall amount in peninsular Malaysia‖, Jurnal Teknologi (Science and Engineering)63 2 75-79, 2013.
[10] H.W. Aji, ―Pemodelan statistical downscaling dengan regresi projection pursuit untuk peramalan curah hujan bulanan‖. Disertasi Bogor Program Pascasarjana: Institut Pertanian Bogor, 2006. [11] S. Izdihar,‖ Principal componen regression dan ARIMA pada teknik
statistical downscaling untuk peramalan curah hujan di kabupaten Jember‖, Skripsi Jember: Fakultas Matematika dan Ilmu Pengetahuan Alam Universitas Jember, 2019.
[12] G.Subimal, P.M Pradeep,‖ Statistical downscaling of GCM simulations to streamflow using relevance vector machine “,Advances in Water Resources
31 1 132-146, 2007.
[13] T. Shivam , V.V. Srinivas, S.N. R.avi, ―Downscaling of precipitation for climate change scenarios: a support vector machine approach‖, Journal of hydroogyl 330 3-4 621-640, 2006.
[14] H .Chen,J Guo, W. Xion, ―Downscaling GCMs using the smooth support vector machine method to predict daily precipitation in Hanjian basin‖, Advances in Atmospheric Sciences27 2 274-284, 2010. [15] D. Darshana, P. Ashish,‖ Statistical downscaling of temperatur using
three techniques in the tons river basin in central India‖, Theoritical and Applied Climatology 121 3-4 605-622, 2014.
[16] S. Budi, ―Data mining terapan dengan MATLAB”. Yogyakarta: Graha Ilmu, 2007.
[17] Badan Perencanaan Pembangunan Kabupaten Jember [BAPPEDA] dan Badan Kerja Politeknik Negeri Jember [POLIJE],. Laporan Akhir Penyusunan Masterplan Pertanian, Jember: Badan Perencanaan Pembangunan Kabupaten Jember, 2015.
[18] T. Hasan , D. Nuzhet, M. Sibel, ‖A statistical downscaling method for monthly total precipitation over Turkey‖, International Journal of Climatology 24 161-180, 2004.
[19] H.M .Galih, B.A.Teguh, A.S. Noor,‖ Penggunaan metodologi analisa komponen utama (PCA) untuk mereduksi faktor-faktor yang mempengaruhi penyakit jantung koroner―, Jurnal Science, Engineering and TechnologyTE47 1-5, 2012.
[20] Jhonson and Wichern, ―Applied multivariate statistical analysis―, Pearson Prentice Hill, 2007.
[21] V.N. Vapnik, ‖Statistical Learning Theory. New York 732 Pp: Wiley,
1998.
[22] C.P. Jhon, ―Fast training of support vector machines using sequential minimal optimization‖, Advancess in Kernel Methods Support Vector Learning, MIT Press Cambridge MA 185-208, 1998.
[23] R.D.Norman, S. Harry, ― Applied Regression Analysis”, Wiley-Interscience ISBN 978-0-471-17082-2, 1998.