Applied Research On House Price Prediction
Using Diverse Machine Learning Techniques
Maharshi Modi, Ayush Sharma, Dr. P. Madhavan
Abstract: With the booming civilization and ever-changing market requirements, it is essential to know the market drifts. Today prediction of house prices according to the trends is the principal essence of the study. It is imperative for an individual to understand the business trends so that he can prepare his budgetary needs according to his requirements. Real Estate is an ever-growing enterprise with an expanding society. For an investor, it is essential to comprehend the business drifts, which can assist him to underwrite in the right way and augment his business throughput. Sometimes clients get dupe by the hoax market rate set up the agent due to which the real estate industry is less translucent these days. With an uptick in convince of the dataset, it's viable for a researcher to develop a model with high accuracy. The previous model with decreased accuracy and overfitting of data reduces the efficiency, whereas the proposed system resolves such issues and provides a better and enhanced model with a rich user interface. The foremost intention of this design is to develop a comprehensive model that is advantageous for a business society as well as an individual, whic h is the main nub of this investigation. This design is intended to assist a client by diminishing his fieldwork moreover extricate his time and money. Models are enlightened in diverse machine learning algorithms such as Extra Tree, Support Vector Machine, K Nearest Neighbor, Naive Bayes, Logistic Regression, Stochastic Gradient Descent, and they are coupled by implementing the stacking technique.
Keywords: House Price Prediction, Real Estate, Ensemble learning, Extra Tree, Support Vector Machine, Stochastic Gradient Descent, Naïve Bayes, K Nearest Neighbor, Logistic Regression, Classification.
—————————— ——————————
1
INTRODUCTION
The three Essential for a human to nurture in today’s world are Food, Cloth, and House. With the availability of these resources, human productivity can increase. Housing plays a vital role in one’s growth. From investment, to providing refuge it plays an indispensable role in one's life. Real Estate's contribution to the Indian economy is expected to be 13% of India's GDP by 2025 which would play a pivotal part in the advancement of the country. The germination in real estate grants India with its much-needed infrastructure requirements. The real estate enterprise ranks third among the 14 influential sectors of the Indian economy. Many Real Estate companies are facing breakdown in the market due to lack of such analysis and this could also lead to disruption in countries economy as Real Estate sector contributes significantly. A fallout of the real estate industry could lead to a global economic meltdown similar to the 2008 recession.The market is evolving day by day, today a lot of software giants are shifting towards Artificial intelligence for better decision-making and resolving some complicated difficulties in real-world using the data accessible in ample quantity. Today machine learning is applied in various sectors hence integrating it with the Real Estate sector can help an investor to intensify his business throughput also support an individual to shape his budgetary needs according to his requirements. For making it convenient to the majority of the people a user-friendly Graphical User Interface (GUI) is deployed.
In 1990s due to lack of research and data availability people didn’t have such technology to build model that could predict the house prices with efficiency. Traditionally, people had to do the standard fieldwork, in-order to check the house price and it was considerably inconvenient for them to investigate diverse areas which could match their stipulation. It would restrict one's need to traverse more areas due to lack of infrastructure additionally it would cost them a lot of time and money. Through improvised analytics and higher data with accurate prediction, this project aims to develop a complete model that is beneficial for an individual as well as an organization and solve the real-time problem which could save time and money. Employing diverse machine learning algorithms, it enhances the precision and throughput of the model. With the growth in real estate, there is a need for a model that could satisfy the business as well as individual needs. Developing a model with high throughput will provide the higher technical potential to dramatically reduce the risk of the downfall of the real estate industry with spontaneous analytics and higher accuracy of results. This project involves the implementation of an ensemble learning method to provide more accurate and precise outcome.
2
RELATED WORK
To accomplish the aspirations of this project and achieve an in-depth study of the methodologies used to bolster the range and outlook of the concept of ensemble learning, an overview of related works based on various machine learning approach on house price prediction is discussed. AI permits us to undertake difficulties that are complicated for people to work by moving a bit of the burden to the algorithm. The research in "Industrial Revolution and Artificial Intelligent" by Supriya Mandhare and Chanda Chouhan [10] shows how AI can be used to enhance systems to decide how to allocate effort in an organization and decrease error rate and improve performance. Development of the description of the particular system. This was done through the careful analysis of the research paper "A Multi Feature-Based Housing Price Prediction for
____________________
Maharshi Modi, B.Tech., Computer Science and Engineering, SRM Institute of Science and Technology, Kattankulathur, Chennai, Tamil Nadu, E-Mail: [email protected] Ayush Sharma, B.Tech., Computer Science and Engineering,
372 Indian Market Using Machine Learning" by Ms.Ankita
Gupta, Yashwant Jangid, Tushar Tiwari, Saurabh Jain, Rushab Sawant [1] which proposes the idea of house price prediction using ensemble learning using numerous factors. Real estate is a thriving enterprise, and hence a comprehensive design is obliged, which can analyze diverse factors according to the market needs of the country, which is portrait in this paper. The research conducted by William M. Dorner and Alexander N. Bogin [2] points out that pricing can be increased by fifteen percent in popular regions, while it showed inconsequential impacts on the outskirts of the city. In the study conducted by D. X. Zhu and K. L. Wei, it shows that location holds a notable impact on the land prices [3]. Therefore, there is a need for a design that can analyze such trends and can have a significant bearing on the house management schemes and can assist an investor to bankroll in the correct direction. The paper "A Quick Review of Machine Learning Algorithms," by Susmita Ray [4] highlights the gains and losses of the most often used algorithms of machine learning namely Support Vector Machine, Stochastic Gradient Descent, K-Nearest Neighbours, Logistic regression, Naive Bayes Algorithm along with comparisons of these algorithms in terms of precision, accuracy, error rate, etc. It intends to provide a brief understanding of commonly used algorithms of machine learning to solve regression, clustering and classification queries. In addition to this, the research was done in "Predicting the Housing Price Direction using Machine Learning Techniques" by Suchibrota Dutta, Debanjan Banerjee [5] enlightens the correlation among discrete machine learning algorithms and highlights that random forest classifier has high accuracy and support vector machine is the supreme classifier to study which is less prone to data overfitting. The employment of neural networks enhances the efficiency of algorithms used in machine learning as shown in "House Price Prediction Using Machine Learning And Neural Networks " by Ayush Varma, Rohini Nair, Abhijit Sarma, and Sagar Doshi [6]. The outcome is the mean of several regression techniques such as linear regression and boosted regression to increase the accuracy and decrease the error rate of the model to prevent the risk of investing in the wrong place. They've employed Google maps to get reliable data from the real world. The research conducted on hybrid regression for house price prediction by Sifei Lu, Rick Siow Mong Goh, Xulei Yang, Zheng Qin [7] promotes the study of various regression technique such as Ridge, Lasso, and Gradient boosting. Regressions such as Lasso and Ridge with a wide number of characteristics can model cases hence this can avoid data overfitting. Here coupling of various regressions is performed over the features and it was observed that the Gradient boosting and hybrid lasso produced the most favourable score. Ensemble learning exercises various algorithms of machine learning to accomplish superior performance than could be attained from any one of the constituent algorithms solely. "Predicting Housing Price Based on Ensemble Learning Algorithm " by Pengcheng Gui ,Yajuan Tang, Shuang Qiu [8] have used ensemble learning to increase the accuracy and precision of their model. The outcomes exhibit that the error rate amongst real house prices and predicting house prices are constrained in a very profound range. Implementation of Ensemble technique in the business
application is the principal characteristic of the research conducted in ―A Comparison of Ensemble Methods in Financial Market Prediction‖ by Jiajia Wang, Cheng Cheng, Wei Xu [9]. Comparative analyses about several Ensemble technique such as Stacking, Boosting and Random Spacing is performed and it is mentioned that the bagging performance the best given that the iteration of ensemble technique is adjusted and hence higher iteration leads to the incompetent and underperforming model with overfitting of data.
―Prediction of Real Estate Price Variation Based on Economic Parameters‖ by Kai-Hsuan, Chu, LiLi [11] studies the various economic parameters and analyses the market trend. It highlights the influence of the price fluctuation model and its consequences on the housing plan and aids the government authorities as well as investors to make a meticulous decision.
3
DATASET
The current design employs the data from Kaggle.com, and the dataset has been used from the resource accessible by that web application. The dataset chosen has 22 attributes upon which the various algorithms are tested and trained. These attributes range from different types of building to the square feet of the house. It consists of the utilities available suchlike electricity, water, and Gas. Important parameters that hugely affect the price of a property, for instance, the number of bedrooms, overall quality of the house, distance from the main road, and the area, are thoroughly examined in the dataset.positions such as Data Scientist, Software Developer, Web Developer were collected. Finally, the resumes attached to the emails were also used for testing the model.
4
PROPOSED METHODOLOGY
The proposed framework has an implementation of several machine learning algorithms, which are then ensembled into the voting classifier. Comparison and analysis of various machine learning classifiers are done, and their outcomes are noted.
4.1 Data Cleaning
subdivision of the dataset and use it for training the model and test using the corresponding subdivision of the dataset. It enables us to compare different algorithms of machine learning and get a sense of how they work in practice. We need data to test and train the machine learning methods. Reusing the same data for both training and testing is a bad idea since we need to know how the technique works on new data. The standard approach is to make a straightforward 80%-20% break, at times with varying values such as 70%-30% or 90%-10%. In cross-validation, 3,5, or any k number of splits, can be performed. Some portion of the sample dataset is reserved. The remainder of the data is for training the model. The model is tested using the set-aside portion of the dataset. Cross-validation allows more efficient use of data and protects against the overfitting of data.
4.2 Data Visualization
Visualization of data is an analytical skill exercised in machine learning. Data visualization helps to get a detailed understanding of various attributes of datasets. Several machine learning algorithms are perceptive to the range and distribution of the characteristics. It can help identify corrupt data, outliers, and patterns. It also aids to investigate the market drifts and assist the investor to maximize this throughput. Here in our design, we have deployed several graphs to classify the key relationships which can be used to train the model.
Fig. 1 Sales price distribution of property
The given Fig. 1 shows the relationship between the sales price, which is a portrait in the x-axis, and the square feet,
which is a portrait in the y-axis.
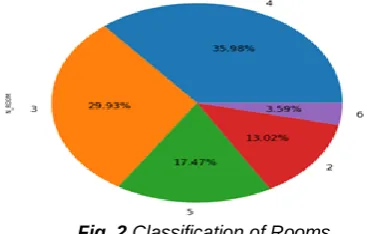
Fig. 2 Classification of Rooms
In Fig. 2, we find the correlation between the number of rooms using the pie-chart. The detail classification of each room is made, and its active share from the entire dataset is studied.
Fig. 3 Distribution of Area
In the given Fig. 3 it depicts the distribution of different area that is studied in this paper.
Fig. 4 Determining correlation amongst attributes.
Here in the given Fig. 4, it shows the multivariate correlation amongst the other attributes. Here its primarily utilised to examine the outliers of the data and classifying fundamental relationship amongst the qualities for performing exploratory data analysis. 4.3 Algorithm Used
Logistic Regression
This approach aims to represent the likelihood that an occurrence materializes based on estimates of experimental variables, that could be either numerical or categorical. It strives to determine the impact of a set of variables on a binary response variable and calculates the probability of an event occurring for a randomly selected observation against the likelihood it doesn't occur. It groups findings by calculating the likely hood of an occurrence in a particular class — for example, classifying whether a website is fraudulent or not.
Sigmoid Function:
374 The curve of the sigmoid function resembles as an
S-shaped curve. The primary purpose of employing a sigmoid function is that it ranges within zero and one. It’s particularly beneficial for models where probability is to be predicted as an outcome and since the probability of everything ranges between zero and one, its the correct choice.
Support Vector Machine
Here in this method, we complete the classification by defining the hyperplane amongst the characteristics. Each data item is interpreted as a point, and they are plot versus n-dimensional space such that the value of each feature being the value of a particular coordinate. Here the use of SVM is to depreciate the error rate and misclassification by recognising hyperplane with high margin from the data point. SVM are instrumental in case of high dimensional space. Individual attributes have coordinates which are formally comprehended as support vector. To accomplish the data transformation from the lower-dimensional input space towards higher dimensional input space, we use kernel function, which encourages to tackle such complex change.
Naïve Bayes
It's a statistical classification technique used to solve problems concerning classification. It is a fast, precise, reliable algorithm and has high accuracy and speed on large datasets. Naive Bayes implies that the existence of a specific characteristic is independent of other characteristics being present. For instance, if the fruit is orange in colour, ten centimetres in diameter and round in shape, the fruit could be viewed as orange. Every one of these properties, both separately and autonomously, lead to the likelihood that the fruit is orange while paying little regard to whether they rely upon one another, and that is the reason it is called ' Naive.’ Bayes Theorem: The theorem obtains the likelihood of an event taking place provided that another event has already taken place. Its expressed by the following formula
P(L|M) – the likelihood of event L occurring, given event M has occurred
P(M|L) – the likelihood of event M occurring, given event L has occurred
P(L) – the likelihood of event L P(M) – the likelihood of event M
events L and M are independent of one another. ( | ) ( | ) ( )
( ) ( )
Stochastic Gradient Descent
It’s a commonly used algorithm of machine learning and forms the basis of neural networks. The general concept of gradient descent in machine learning consists of sequentially adjusting parameters to decrease the cost function. There is a term called batch in Gradient Descent, which denotes the total quantity of samples from a dataset used to measure the gradient for each iteration. Typically, this batch is taken to be the whole dataset. The problem arises when the dataset is huge. If we use a typical gradient descent optimization technique, we will have to use all the samples to complete one iteration while the Gradient Descent is performed, and it must be repeated for each iteration until the minimum is reached. Therefore, it
becomes computationally expensive, whereas Stochastic Gradient Descent at each stage selects one case from the dataset at random instead of the whole dataset and updates gradient-based only on that single record. The benefit of it is that it's computationally less expensive, and in most scenarios, it's preferred over other gradient descent techniques for optimization.
Extra Tree
ExtraTreesClassifier is a type of ensemble learning method fundamentally based on decision trees like RandomForest, ExtraTreesClassifier randomizes specific decisions and data sub-sets to reduce data overlearning and overfitting. Usually, an individual decision tree overfits the data from which it is learning because it learns from just one decision path. Estimates from only one decision tree typically do not evaluate correctly on new data. Extra-tree models reduce the likelihood of overfitting by constructing numerous trees, and it doesn't make bootstrap observations meaning it samples without replacement. Nodes are divided by random splits between a random subgroup of features selected at each node. Randomness in Extra Trees does not come from data bootstrapping, but rather from the arbitrary divisions of each finding. This contributes to less variance in the extra tree than in a random forest and decision tree.
K-Nearest Neighbors
It is a simple, versatile and straightforward to implement supervised learning algorithm. It works on the ideology that similar observations are close to each other. It captures the concept of similarity by calculating the separation within two points on a graph. The 'k' in the algorithm is a numerical value that tells how many data points to consider for taking a vote. To classify a new point, we encircle the point with K number of datapoints and assign it to the group with the maximum number of points within the circle. The ideal way to identify the value of K is by trying out a few values of k before settling on one, which reduces the error and concurrently maintains the accuracy of the prediction. Low values can be noisy and subject to outliers. Large values of K smooth over thing but K should not be so large that other categories shall always outvote a category with a few examples.
4.4 Ensemble Technique
models of different types, which leads to a reduction in either bias or variance error depending on the combining learner used. To build stacking method, we have to define two things: a meta classifier that we want it to ensemble with and the weak learners L. Here the weak Learners used in this proposed framework are Logistic Regression, Extra Tree, Stochastic Gradient Descent, Naïve Bayes, Support Vector Machine and K-Nearest Neighbor. The meta classifier that we use is the voting classifier which performs soft voting to get the desired outcome in this framework.
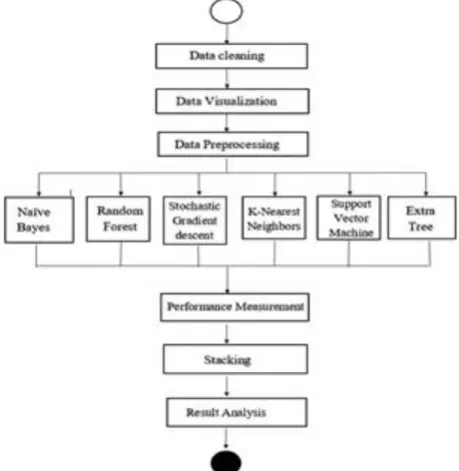
Fig 5. Simple Flowchart of proposed framework
As shown in Figure 5, we choose the algorithms as the weak learner and using the blending function, and we calculate the final result based on the weighted average. In this framework, the process takes in two primary steps: Initially, development of base-level classifiers takes place from the dataset using several algorithms, and they are tuned into a meta-level classifier.
4.5 Performance Measurement
In this model, we use confusion matrix to determine the accuracy, specificity, sensitivity, f1 factor and precision. The confusion matrix is a performance determination table offered for the classification model on a set of data. Through graph and various measures, we can actively comprehend the performance of the data. Each class reports the number of incorrect and correct prediction counts. Two primary types: Positive and Negative, have been described, and hence various outcomes are being depicted.
Positive (P) : Observation are positive. Negative (N) : Observation are negative.
True Positive (TP) : Observation are positive, and are predicted to be positive.
False Negative (FN) : Observation are positive, but are predicted negative.
True Negative (TN) : Observation are negative, and are predicted to be negative.
False Positive (FP) : Observation are negative, but are predicted positive.
(i) Accuracy: We calculate accuracy as
Accuracy = (TP +TN) * 100 / (TP + TN + FP + FN )
(3)
(ii)Precision: We calculate precision as
Precision = (TP *100) / (TP + FP)
(4)
(iii) Recall: We define recall as
Recall = (TP)/(TP +FN)
(5)
(iv) Sensitivity: We define sensitivity as
Sensitivity = (TP * 100)/ (TP + FN) (6)
(v) Specificity: We define specificity as
Sensitivity = (TP * 100)/ (TP + FN) (7)
5
RESULTS AND DISCUSSION
In order to build stacking method to we have to define two things: a meta classifier that we want it to ensemble with and the weak learners L. Here the weak Learners used in this proposed framework are Logistic Regression, Extra Tree Stochastic Gradient Descent, Naïve Bayes, SVM and K-NN. The meta classifier that we use is the voting classifier which performs soft voting in order to get desired outcome in this framework
TABLE I
COMPARISION BETWEEN DIFFERENT TYPES OF CLASSIFIERS
Algorithm Accuracy
in(%)
Precision in(%)
Sensitivity in(%)
Specificity in(%) Logistic
Regression 95.89 96.64 84.69 96.43
Support Vector
Machine 81.48
81.28 71.4 74.6
Naive Bayes 95.84 94.80 94.89 96.05
Stochastic Gradient Descent
81.53 92.37 64.28 98.37
Extra Tree
96.78 92.51 89.79 98.37
K-NN 79.12 81.74 5.86 95.76
Voting
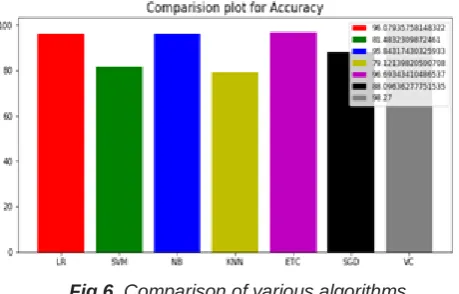
376 Fig 6. Comparison of various algorithms
By using a voting classifier, we can see that there is an improvement in the accuracy and precision is enhanced. Here the overall efficiency of the system is optimized.
6
CONCLUSION
A model with high accuracy is developed, which can be used for business as well as individual purpose with user-friendly GUI. Using the ensemble method, we obtain high accuracy by deploying various machine learning algorithm. Algorithms are distinguished based on various metrics, for instance, accuracy, precision and specificity.
VII. REFERENCES
[1] Ms. Ankita Gupta, Yashwant Jangid, Tushar Tiwari, Saurabh Jain, Rushab Sawant ―A Multi Feature-Based Housing Price Prediction for Indian Market Using Machine Learning‖, ISSN 2347 – 8527, IJCMS December 2017
[2] William M. Doerner, Alexander N. Bogin, ―Property Renovations and Their Impact on House Price Index Construction‖,https://www.fhfa.gov/PolicyProgramsRe search/Research/PaperDocuments/wp1702.pdf [3] KANG Ling-Wei and D. X. Zhu, ―The Land Prices and
Housing Prices —— Empirical Research Based on Panel Data of 11 Provinces and Municipalities in Eastern China‖, 2013 International Conference on Management Science & Engineering (20th) July 17-19, 2013.
[4] Susmita Ray, ―A Quick Review of Machine Learning Algorithms, ‖. International Conference on Machine Learning, Big Data, Cloud and Parallel Computing, India, 2019
[5] Suchibrota Dutta, Debanjan Banerjee, ―Predicting the Housing Price Direction using Machine Learning Techniques‖, 2017 IEEE ICPCSI
[6] Rohini Nair, Abhijit Sarma, Sagar Doshi, Ayush Varma, ―House Price Prediction Using Machine Learning And Neural Networks‖, 2018 Inventive Communication and Computational Technologies [7] Zengxiang L., Mong G., Sifei L., Xulei Y., Zheng Q.,
Rick S., ―A Hybrid Regression Technique for House Prices Prediction‖, IEEE IEEM International Conference(2017)DOI: 10.1109/IEEM.2017.8289904
[8] Yajuan Tang, Pengcheng G., Shuang Qiu, ―Predicting Housing Price Based on Ensemble Learning Algorithm‖, IEEE IDAP (2018) DOI: 10.1109/IDAP.2018.8620781.
[9] Wei Xu, Cheng Cheng, Jiajia Wang, ―A Comparison of Ensemble Methods in Financial Market Prediction‖, IJCCSO 2012 International Joint Conference on Computational Sciences and Optimization
[10] Supriya Mandhare, Snehal Kathale, Chanda Chouhan,
―Industrial Revolution and Artificial Intelligent‖, International Journal of Engineering Research & Technology ISSN: 2278-0181 ICIATE – 2017