A Fast and Efficient Algorithm
for Finding
Frequent Items over Data Stream
Ling Chen
Department of Computer Science, Yangzhou University, Jiangsu, China State Key Lab of Novel Software Tech, Nanjing University, Nanjing , China
Email: [email protected]
Yixin Chen
4
Department of Computer Science, Washington University in St Louis, USA [email protected]
Li Tu
Department of Computer Science, Jiangyin Polytechnic College, Jiangyin 214405, China Email:
[email protected]
Abstract— We investigate the problem of finding the frequent items in a continuous data stream. We present an algorithm called λ-Count for computing frequency counts over a user specified threshold on a data stream. To emphasize the importance of the more recent data items, a fading factor is used. Our algorithm can detect ε-approximate frequent items of a data stream using O(logλε)
memory space and O(1) time to process each data record. The computation time for answering each query is O( lo g ), and for answering a query about the frequentness of a given data item is O(1). Experimental study shows that λ-Count outperforms other methods in terms of accuracy, memory requirement, and processing speed.
Index Terms— Data mining, data stream, frequent items
I. INTRODUCTION
In recent years, researchers have paid more attention to mining stream data. Mining frequent item sets from stream data is an important task in stream data analysis. Frequency is a fundamental characteristic in many data mining tasks such as association rule mining and iceberg queries. It has applications in many areas such as sensor data mining, business decision support, analysis of web query logs, direct marketing, network measurement, and internet traffic analysis. Correspondingly, the input stream data could be stock tickers, bandwidth statistics for billing purposes, network traffic measurements, web-server click streams, and data feeds from sensor networks. Traditional mining algorithms assume a finite dataset and multiple scans on the data. For the stream data applications, the volume of data is usually too large to be stored in memory or to be scanned for more than once. Furthermore, for data streams, there can only be sequential but not random access. Therefore, traditional frequent item mining algorithms are not applicable to stream data.
The problem is difficult because of the high throughput of the data streams , possibly in the order of gigabytes per second. Any feasible algorithm for detecting frequent data item must perform data processing and query fast enough so as to match the speed of arriving data in the stream. In addition, the algorithm can use only limited memory space and store only the sketch or synopsis of the data items in the stream.
Several solutions for finding frequent items in stream data have been proposed. Several algorithms use random sampling [1,5,6,7,8,9,10,11,12,13,14] to estimate the frequencies of the data items. For example, the Sticky Sampling [1] algorithm is a sampling based algorithm for computing an ε -deficient synopsis over a data stream. It is a probabilistic one-pass algorithm that provides an accuracy guarantee on the set of frequent data items and their frequencies reported. The second class of algorithms are deterministic algorithms [2,3,4,15,16,17,18,25]. The MG algorithm by Misra and Gries [4] is a well-known deterministic algorithm to detect frequent stream data.
In general, the closer to 1 the fading factor λ is, the more important the history is taken into account. There are two advantages of the fading model over the sliding window model. One is that in the fading model, frequency takes into account the old data items in the history, while the sliding window model only observes within a limited time window and entirely ignores all the data items outside the window. This is undesirable in many real applications. The second is that in the fading model, when more data arrive continuously, the frequency changes smoothly without a sudden jump which may occur in the sliding window model.
In this paper, we propose an efficient frequency estimation algorithm based on the fading model which needs as little space and running time as possible. We propose an algorithm called λ-Count which can detect ε -approximate frequent items in data stream. The algorithm requires O(logλε) memory space and O(1) time for
processing one input data item. Moreover, the computation time for answering each query is O(lo g
), and for answering query about the frequentness of a given data item is O(1). Through extensive experiments, we show that λ-Count outperforms other methods such as LC and EC in terms of the accuracy, memory requirement, and processing speed.The rest of the paper is organized as follows. Section 2 reviews related work. Section 3 formally defines the problem and describes a data fading model. Section 4 describes the framework of the λ-Count algorithm and analyzes its space and time complexity. Section 5 reports our experimental results and Section 6 gives conclusions.
II. RELATED WORK
Problems related to frequency estimate have been actively studied. Algorithms for identifying frequent items and other statistics in the entire data stream have been proposed.
Lossy Counting [1] was among the first algorithms for finding frequent items from a data stream. Lossy Counting is a one-pass algorithm that provides an accuracy guarantee on the set of frequent data items and their frequencies reported. Given a user-specified support threshold S, and an error threshold ε, Lossy Counting guarantees that: 1) All items whose true frequency exceeds SN are detected, where N is the total number of data items processed. Namely, there are no false negatives. 2) No item whose true frequency is less than (S-ε)N is output. 3) The estimated frequency of any item is less than its true frequency by at most εN. Nuno Homem et al. [28] presented an algorithm for identifying the most k frequent elements by merging the commonly used counter-based and sketch-based techniques. The algorithm also provides guarantees on the error estimate, order of elements and the stochastic bounds on the error and expected error estimates. Karp et al. [2], and Demaine et al. [3] applied a deterministic MG algorithm [4] to detect frequent stream data. They reduced the processing time of MG algorithm to O(1) by managing all counters in a hash table. The algorithm can easily be
adapted to find ε-approximate frequent items in the entire data stream without making any assumption on the distribution of the item frequencies. This algorithm needs 1/ε counters for the most frequent data items in the stream. Processing the arrival data items entails incrementing or decrementing some counters.
Many algorithms for frequent item counting use random sampling. They make assumptions on the distribution of the item frequencies and the quality of their results is guaranteed probabilistically. Flajolet and Martin [5] and Whang et al. [6] proposed probabilistic algorithms to estimate the number of distinct items in a large collection of data in a single pass. Golab et al. [7] gave an algorithm for the case when the item frequencies are multinomially-distributed. Gibbons and Matias [8] presented sampling algorithms to recognize top-k queries. H. Liu et al. [9] presented an error-adaptive and time-aware maintenance algorithm for frequency counts over data streams. G.S. Manku et al. [1] advanced a sampling based algorithm called sticky sampling for computing an ε-deficient synopsis over a data stream of singleton items. It scans the data in the stream and randomly samples the data items based on three user-specified parameters: support S, error bound ε, and probability of failure δ.
Many algorithms use hashing technique to map the data items in a stream to a hash table which can be stored in the main memory. Estan and Varghese [10] presented a sampling algorithm and a hash-based algorithm for frequent item detecting. Based on the hashing technique, Charikar et al. presented an algorithm named Count Sketch [11], which requires O(k/ε2logn) memory space and O(k/ε2logn) computation time to process one data item. The algorithm can output the items with frequency larger than 1/(k+1) under the probability of 1-δ. Cormod et al. presented an algorithm called groupTest [12] which requires O(k(logk+log(1/ δ))logM) memory and O(logk) time for each item. Jin et al. [13] advanced an algorithm hCount which uses O(ε-1log(-M/logδ)) memory and O(log(-M/logδ)) time for each data element. The algorithm can detect the ε-approximate results under the probability of1-δ. Fang et al. [14] also advanced several algorithms based on hashing to compute iceberg queries, but each requires at least two passes over the data stream.
frequency error bound of the results returned by the
proposed algorithm is (1−S+ε)εN.
In many applications, recent data in the stream is more meaningful. The algorithms mentioned above does not discount the effect of old data, all data items in the whole history of the data stream are given equal weights. This is undesirable in solving many application problems. One way to handle such problems is to use a sliding window model. Recently several data mining algorithms over sliding windows are proposed. Arasu and Manku [19]
gave the first deterministic algorithm for finding ε
-approximate frequent items over a sliding window. It
requires O((1/ε)log(1/ε)) time for each query/update and
uses O((1/ε)log2(1/ε)) space. Their algorithm divides the
sliding window into several possibly overlapping sub-windows with different sizes. The algorithm applies the
MG algorithm to each of these sub-windows to find the
frequent items in these sub-windows. These sub-windows are organized into levels so that whenever there is a query on the frequent items, one can traverse these sub-windows efficiently to identify the frequent data items. In
[30] Regant Y. S. Hung et al. studied the space
complexity of the ε-approximate quantizes problem, and
proved that any comparison-based algorithm for finding
ε-approximate quantizes in a data stream needs
an Ω((1/ε)log(1/ε)) space. Golab et al. [20] gave some
heuristic algorithms for identifying frequent items over a sliding window. Lee and Ting [21] proposed an approximate frequent stream data mining algorithm
which requires O(1/ε) space. Their algorithm needs
O(1/ε) processing time for update and query. L. Zhang
and Y. Guan [22] proposed a stream data frequency estimation algorithm over sliding windows. Their
algorithm requires O(1/ε) memory space and O(1) time
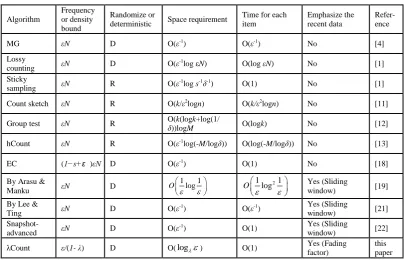
for query/update. Other recent works on mining frequent items in data stream have been surveyed in [23,24,26,27,37]. The major algorithms for mining approximate frequent items in data stream are listed in Table 1.
III. CONCEPTS AND DEFINITIONS
In this section we describe a data fading model by
using a fading factor λ to discount the frequencies of the
old data in a stream. We also give a formal definition of our mining problem. In this paper, we use a standard stream model with discrete time steps labeled as 0, 1, 2,
3…, and only one data record a(t) ∈ X arrives at each
time step, where X={x1, x2, …, xm} is a domain
containing discrete values.
To emphasize the importance of recent data, we use a
fading factor λ∈(0,1) in calculating the data items’ support
counts. For each data item x, its support count decreases
as x ages. We call such modified support counts the
density of the data item. In each time step, the density of
a data item will be reduced by the fading factor λ.
Definition 1 (Density of a data item) The density
of a data item x∈X at time t is defined as
0 0
( , )
( , 1) ( , ) 1, 2,3,...
t D x t
D x t λ δ t x t
= ⎧
= ⎨ − + =
⎩
(1)
Here, ( , ) 1 ( )
0 o th erw ise
a t x
x t
δ = ⎨⎧ =
⎩
, where a(t) is the
data record received at time t.
The density of a data item is constantly changing. However, we found that it is unnecessary to update the density values of all data items at every time step. Instead, it is possible to update the density of a data item only when this item is received from the data stream. For each item, the time when it was last received should be
recorded. Suppose a new data item x is received at time
tn, and suppose the last time x was received before is ts (tn
> ts), then the density of x can be updated as follows:
( , )
( , )
n s+1
nt t s
D x t
=
D x t
λ
−(2)
Lemma 1 Let X(t) be the set of all the data items that
are received at least once from time 0 to t, we have:
1)
( )
1
( , )
1
x X t
D x t
λ
∈≤
−
∑
, for any t=1, 2, …. .2)
( )
1
lim
( , )
1
t→∞x X t∈
∑
D x t
=
−
λ
Proof: For a given time t,
( )
( , )
x X t
D x t
∈∑
is the sum
of density of the t+1 data records that arrive at time steps
0, 1, … , t. For each time step t’, 0≤t’≤t, the data record
contributes λt-t’ to the total density. Therefore, we have
( )
( , ) x X t
D x t ∈
∑
=
' 1' 0
1 1
1 1
t t
t t
t
λ λ
λ λ
+ −
=
−
= ≤
− −
∑
.
Also, it is clear that:
1
( )
1 1
lim ( , ) lim
1 1
t
t x X t D x t t
λ
λ λ
+
→∞ ∈ →∞
−
= =
− −
∑
. Q.E.D.Since a data stream may consist of potentially huge volume of data items, the number of the data items in the stream could become very large, and the count of each item could overflow. From Lemma 1, we can see when a fading factor is used, the summation of the densities of the data items is independent of the number of the data items in the stream, and the density of each data item is
within the range of
[0, 1/(1
−
λ
)
]
and never overflows.Like most previous work, our λ-Count algorithm takes
two user-specified parameters, a support threshold
S
∈
(0,1), and an error parameterε∈
(0,1)such that ε<S.Definition 2 (Frequent data item) Let S be a user
specified threshold, at time t, a data item x is a frequent
item if its density D(x,t)satisfies
D
(
x,t
)
1 S
λ ≥
− .
Given ε as a user specified relative error bound and
ε<S, we are asked to maintain some data items with density at least
1
S ε
λ
−
− , which are called ε-approximate
frequent items.
Our algorithm outputs a list of ε-approximate frequent
items along with their estimated densities. Similar to
1. All items whose densities exceed 1
S
will be
found, which means there are no false negatives.
2. No item whose density is less than
1
S
will be found.
3. The estimated density for each item is no more than its actual density. The difference between the estimated density and the actual density is no more
than 1
.
IV.THE
λ
-COUNT ALGORITHMWe now present the proposed λ-Count algorithm. We first describe the algorithm and prove its optimality. Then, we discuss some key implementation details and analyze the complexity of the algorithm.
A. Description of the algorithm
In our λ-Count algorithm, for each data item, it suffices to store a characteristic vector which consists of the necessary information of the data item. The λ-Count algorithm processes the incoming data from stream and updates a summary structure called item_list which is a list of frequent data item candidates. Each entry of item_list is a characteristic vector of a data item x: C(x)=[x, De(x, ts), ts], where ts is the last time when x was
received, and De(x, ts) is the estimated density of the data
item x at time ts.
The item_list is organized in a queue structure and has a size limitation of
L
= log
. These entries in item_list are arranged in the descending order of their ts values.The entry with the least ts value is located at the head of
the queue while the one with largest ts value is at the tail
of the queue. Whenever the size of item_list goes beyond L, the entry at the head of item_list should be deleted. Whenever a new entry is going to be inserted to item_list, it should be placed at the tail of the queue.
When a new data record x is received from the stream, the algorithm creates or updates its characteristic vector in item_list. If the characteristic vector of x already exits in item_list, the algorithm modifies its density and ts
value before moving it to the tail of the queue; otherwise, the algorithm creates a new entry for x and inserts it to the tail of the queue.
The framework of the algorithm is given in Algorithm 1.
Algorithm 1: λ-Count input: str: the data stream; λ: the fading factor; ε: the density error bound; S: the density threshold;
output:item_list: list of frequent data item candidates; begin
1. sett=0;
L
=
log
;2. while not terminate do
3. receive a data item x from the data stream str; 4. if x is not in item_list then
5. create a new entry [x, 1, t];
6. If |item_list|
L (item_list is full) then 7. delete the entry at the head of item_list; 8. endif9. insert the new entry [x, 1, t] to the tail of item_list;
10. else
11. update the corresponding entry [x, De(x, ts), ts]
TABLE I. ALGORITHMS FOR MINING APPROXIMATE FREQUENT ITEMS OF DATA STREAM
Algorithm
Frequency or density bound
Randomize or
deterministic Space requirement
Time for each item
Emphasize the recent data
Refer-ence
MG εN D O(ε-1) O(ε-1) No [4]
Lossy
counting εN D O(ε
-1log εN) O(log εN) No [1]
Sticky
sampling εN R O(ε
-1log s-1δ-1) O(1) No [1]
Count sketch εN R O(k/ε2logn) O(k/ε2logn) No [11]
Group test εN R O(δ k(logk+log(1/
))logM O(logk) No [12]
hCount εN R O(ε-1log(-M/logδ)) O(log(-M/logδ)) No [13]
EC (1−s+ε )εN D O(ε-1) O(1) No [18]
By Arasu &
Manku εN D
1 1 log
O
2
1 1
log O
Yes (Sliding
window) [19]
By Lee &
Ting εN D O(ε
-1) O(ε-1) Yes (Sliding
window) [21]
Snapshot-
advanced εN D O(ε
-1) O(1) Yes (Sliding
window) [22]
to
[
x
,
( , ) t ts 1 e sD x t
,
t
]
; 12. move the entry[
x
,
( , ) t ts 1e s
D x t
,
t
]
to the tailof item_list; 13. end if; 14. t=t+1 15. end while
end
Since the density of a data item may be deleted previously, the estimated density recorded in the entry in item_list may be less than the actual density of the data item. We will show that the error is within a bound ε /(1-λ). If a data item x is not listed in item_list, it is possible that x has been deleted from item_list several times, causing its historical density to be discarded. We will show that if x is not listed in item_list, then it cannot be a frequent item even if it has never been deleted from item_list. In other words, all the frequent items will be kept in item_list and there is no false negative.
Theorem 1 Suppose an entry C(x)=[x, De(x, ts), ts] of
data item x is deleted from item_list at time t, then its actual density D(x,t) at time t satisfies D (x, t)
/ (1
)
.Proof: Suppose ever since the beginning of the data stream, the item x has previously been deleted at time steps t1, t2,…,tp, and now is deleted at time t. We denote t
as tp+1. The density of the ith deletion is acquired during
the period of (
t
il,t
ir), wheret
ilandt
irare the time steps when x is first and last received in this period, respectively. It is obvious thatt
il
t
ir < ti, fori=1,2,…p+1, where,
t
p+1
t
andt
p+1r
t
s . Then the characteristic vector of x at timet
i is C(x)=[x, De(x,r i
t
),r i
t
]. Since we have ( , ) ( , )r ti tire i e i
D x t D x t , the density of x at time t= tp+1 should be
1
1
( , ) ( , ) i ir i
p
t t t t r
e i i
D x t D x t
1 2 1(1
...
ir il)
irp
t t t t i
1 1 r i l i t p t k i k t
1 1 1 11 1
r r l
p p
r p l
t t t t t
t k k k k t
1 1 1 1 11
1
r l p r p p t tt t
.
(3)When x is deleted from item_list, it must locate at the head of item_list and has the least ts value in item_list.
Since the length of item_list is L=
log
, and every entryin item_list has a different ts value, we know
1 1
r
p p
t
t
=t-ts>L. Thus, we have 1 r1p p
t t
log.
s
t t L
Therefore from (3) we have,
D(x,t) 1 1 1 1
1 1 1 r l p r p p t t t t 11 1 1 r l p t t 1
.Q.E.D. From Theorem 1 we know that if a data item does not appear in item_list at time t, then its actual density must satisfy D(x,t)<
1
.
Theorem 2. At time t, for any entry C(x)=[x, De(x, ts),
ts] in item_list , we have
a)
De(x, ts)
D(x, ts)
De(x, ts)+1
,
(4)
and b) De(x, t)
D(x, t)
De(x, t)+1 s t t
. (5)
Here, D(x,t) is the actual density of data item x at time t.
Proof. a) If x has not been previously deleted, De(x,
ts)= D(x, ts). Otherwise, since x has been previously
deleted from item_list, we have De(x, ts)
D(x, ts). FromTheorem 1, we infer that the actual density of x when it is last deleted is at most
1
. Therefore, we have
D(x, ts) De(x, ts) +
1
.b) Since De(x, t) = De(x, ts)
s
t t
, D(x, t)= D(x, ts)
s
t t
and De(x, ts)
D(x, ts), it is obvous that De(x, t)
D(x, t).
Since D(x,t)= D(x, ts)
s
t t
, from (4) we have
D(x, t) [ De(x, ts)+
1 ] s t t
= De(x,
ts) s t t
+ 1 s t t
= De(x, t) +
1 s t t
. Q.E.D. From Theorem 2, we can see that De(x, t) is always less than D(x,t). The error of using De(x, t) to approximate D(x, t) is less than1
t ts.When item_list is full, it has L entries, the errors of which are less than
1 , 2 1 , …, 1
L
,
respectively. The average error is less than
1
1 . (1 ) 1
L L
= 2
(1 )
<
(1 ) (1- )
L L
.
Based on the Theorems above, the algorithm for answering a query at time t is as follows.
Algorithm 2 λ-Count-Query(t,S)
input: item_list=[ C(1), C(2),…,C(L)]: list of frequent data item candidates; S: the density threshold;
λ:the fading factor; ε: the density error bound;
H(x2)
H(xL)
H(x1) 1. F =Ф;
2. for i=1 to Ldo
3. get C(i)=[x, De(x,ts), ts ] and compute
De(x, t) = De(x,ts)
s
t t
;
4. if De(x, t)> 1
S
then F=F
{x} endif; 5. end for6. output F; end
The following Theorem shows that algorithm λ -Count-Query can correctly detect ε-approximate frequent items.
Theorem 3. The λ-Count-Query algorithm has the following guarantees:
a) All items whose densities exceed 1
S
will be
output; there are no false negatives. b) No item whose density is less than
1 S
will be
output.
c) The estimated density for each item is no more than the actual density. The error of the estimated density is less than
1
.
Proof:
a) From Theorem 2 we know
De(x, t)
De(x, t)
D(x, t)-1
s
t t
.
If density of a data item x satisfies D(x, t)> 1
S
,
then De(x, t)
1 S
-1
s
t t
>1
S
.
According to the λ-Count-Query algorithm, x will be output.
b) If an item x’s density is less than
1
S
, thenfrom Theorem 2 we know De(x, t)
D(x, t) <1 S
.
Therefore, x will not be output by the λ -Count-Query algorithm.
c) From Theorem 2, it is obvious that De(x, t)
D(x, t), and D(x, t) - De(x, t)
1
t ts
<
1
.Q.E.D.
For a given data item x, the algorithm for answering the query of whether x is a frequent item is as follows.
Algorithm 3 λ-Count-item-Query(x,t,S)
input: item_list=[ C(1), C(2),…, C(L)]: list of frequent data item candidates; S: the density threshold;
λ:the fading factor; ε: the density error bound;
output: f: a flag indicating whether x is a frequent item;
begin
1 f=false;
2. ifx is in the item_list then 3. get [x, De(x,ts), ts ] and compute
De(x, t) = De(x,ts) s
t t
;
4. if De(x, t)>
1
S
then f=true endif ;
5. end if 6. output f ; end
B. Data structure and complexity
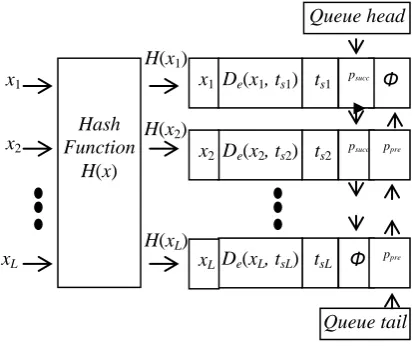
In every time step, the λ-Count algorithm processes the income data and updates a summery structure item_list. Each entry of item_list is a vector [x, De(x, ts), ts, psucc,
ppre], where De(x, ts) is the estimated density of the data
item x at time ts, ts is the last time when item x was
received, psucc and ppre are pointers to its successor and
predecessor respectively. The maximal length of item_list is L=
log
. To accelerate the process of updating item_list, it is organized as a hash table using a hash function H. For a data item x, its address is H(x). Entries in item_list are arranged in a queue structure in the descending order of their ts values. The queue isconstructed as a doubly linked list, as shown in Figure 1.
Figure 1 The data structure of item_list.
Now we examine the operations and analyze the time complexity of the algorithm λ-Count.
Delete an entry (Line 7 of Algorithm 1). Since we always delete the entry at the head of the queue, the time cost is O(1).
Insert an entry (Line 9). Since we always insert the entry to the tail of the queue, the time cost is O(1).
Update an entry when receiving a new data item (Line 11). Since we use the hash function to get the address of an item, the time cost is O(1).
Move an entry to the tail of the queue (Line 12). Given the doubly linked list structure of item_list, this operation can be done by first saving the vector of the entry to a buffer, deleting the entry from the queue, and then inserting the vector in the buffer to the tail of item_list.
x1
tsL
De(xL, tsL)
xL
De(x1, ts1) ts1
De(x2, ts2)
x2 ts2
Ф
psucc ppre
psucc
Ф ppre
Queue head
Queue tail Hash
Function H(x) x1
x2
Since item_list is a doubly linked queue, each of those operations costs O(1) time.
From the above, we conclude that λ-Count processes one incoming data record in O(1) time. Since the maximum size of item_list is L=
log
, algorithm λ-Count requires no more thanO(log
) memory space. Moreover, from the Algorithm 2 and Algorithm 3 we can see that the computation time for answering each query using λ-Count-Query is O(log
), and the time for answering a query about the frequentness of a given data item is O(1) using algorithm λ-Count-item-Query.V. EXPERIMENTAL RESULTS
We evaluated our algorithm and compared its performance against the revised versions of Lossy Counting (LC)[1] and EC [21] on the time fading model. We focus on the algorithms' computing time, memory requirement, recall and precision in handling data streams.
All experiments were run on a PC with 1.0GHz Pentium III CPU running Windows 2000. In our experiments, we set S=0.01 and λ=0.99.
A. Synthetic data sets
We generate four datasets based on Zipf distributions, with parameters 0.5, 0.75, 1, 1.25, respectively. Each dataset contains one million data records. We compare LC, EC and λ-Count with two error bound settings, ε=0.0005 and ε=0.001.
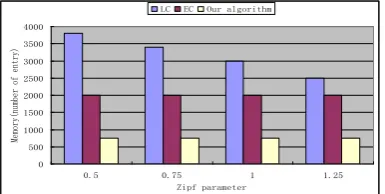
Figure 2 and Figure 3 compare the memory requirements of the three algorithms. We can see that λ-Count requires the least memory for all the different settings of Zipf parameter and ε. In fact, the memory size of λ-Count is always around logλε, while the sampling sizes of EC and LC are at least 1/ε andO 1logN
,
respectively. Since N is the number of data items received from the stream, LC may require huge memory space with the lapse of time.
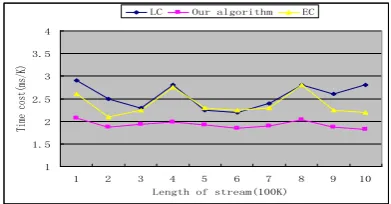
Figure 4 and Figure 5 compare the average time for processing 1M data records by the three algorithms. We see that λ-Count is the fastest. In fact, λ-Count requires only O(1) time for processing one data item, while LC has a processing time of O(1/ε). For EC, although theoretically it has a processing time of O(1), it has a larger hidden constant than λ-Count. This is because, to delete a data in the list, λ-Count only needs to delete the head of the queue, while EC needs to do multiple decrement operations. Therefore, λ-Count is much faster than the other two algorithms.
We also test and compare the quality of the results by the three algorithms in terms of recall and precision defined as follows.
recall=number of the truly frequent items reported by the algorithm number of all the truly frequent items
precision=number of the truly frequent items reported by the algorithmnumber of the frequent items reported by the algorithm Since all the algorithms have no false negatives, all the frequent items can be detected, their recalls are all 100% . Figure 6 shows the precision of the three algorithms on
synthetic data with Zipf parameter 1.25. From the figure we can see that all the algorithms can achieve high precision. But precisions of algorithms LC and EC decrease when the length of the stream increases, while λ-Count obtains high precision close to 100% regardless of the length of the data stream.
Figure 2 Comparison of the memory requirement of the three algorithms on datasets with different distributions (1M, ε=0.0005).
Figure 3 Comparison of the memory requirement of the three algorithms on datasets with different distributions (1M, ε=0.001).
Figure 4 Comparison of time cost of the three algorithms on different distribution data (1M, ε=0.0005)
Figure 5 Comparison of time cost of the three algorithms on different distribution data (1M, ε=0.001)
B. Real datasets
In this section, we adopt the log file data of visitors to the 1998 Soccer World Cup official website [33]. This log
file records all of the visit requests for the Word Cup official website during 1998 World Cup. Each request consists of 8 attributes including visit time, IP address, the ID of the visited web page and so on. We pick up all
0 500 1000 1500 2000 2500 3000 3500 4000
0.5 0.75 1 1.25
Zipf parameter
Memory(number of entry)
LC EC Our algorithm
0 200 400 600 800 1000 1200 1400 1600 1800 2000
0.5 0.75 1 1.25
Zipf parameter
Memory(number of entry)
LC EC Our algorithm
0 5 10 15 20 25 30 35 40
0.5 0.75 1 1.25
Zipf parameter
Time cost(ms/K)
LC EC Our algorithm
0 5 10 15 20 25 30
0.5 0.75 1 1.25
Zipf parameter
Time cost(ms/K)
Figure 6 Precision of three algorithms on Zipf 1.25( ε=0.001)
of the IDs of the visited web pages as the experimental data set and find out the most frequently visited pages. Figure 7 and Figure 8 show the comparison of the memory requirement of the three algorithms on different data sets with ε=0.0005 and ε=0.001. From Figure 7 and Figure 8, we can see that λ-Count requires less memory than LC and EC.
Figure 7 Comparison of the memory requirement of the three algorithms on World CUP-98 data(ε=0.0005)
Figure 8 Comparison of the memory requirement of the three algorithms on World CUP-98 data(ε=0.001)
Figure 9 and Figure 10 compare the average time by the three algorithms for processing World CUP-98 data
with ε=0.0005 and ε=0.001. From the figures, we can see that λ-Count is much faster than the other two algorithms.
Figure 9 Comparison of time cost of the three algorithms on World CUP-98 data(ε=0.0005)
Our experimental results show that the recalls of the three algorithms are all 100%. Furthermore, in Figure 11 we show precisions of λ-Count and other two algorithms on different sizes of World Cup 98 data sets. From the figure we can see that λ-Count has higher precision than the other two algorithms.
Figure 10 Comparison of the time costs of the three algorithms on World CUP-98 data(ε=0.001)
Figure 11 Precision of three algorithms on World CUP-98 data ( ε=0.001)
VI.CONCLUSIONS
In many modern applications, data arrives at a system as a continuous stream of transactions. Traditional stream mining algorithms were generally designed to handle all data items in the streams with equal weights. To emphasis the importance of the more recent data items, we present an algorithm λ-Count for computing frequency counts based on a fading model with a fading factor . Our algorithm can detect ε-approximate frequent items of a data stream using O(logλε) memory space and the processing time for each data item is O(1). Moreover, the computing time for answering each query is O(
log
), and for answering query about the frequentness of a given data item is O(1). Through extensive experiments on both real and synthetic data, we show that λ-Count outperforms other methods in terms of accuracy, memory requirement, and processing speed.ACKNOWLEDGMENT
This research was supported in part by the Chinese National Natural Science Foundation under grant No. 61070047, 61070133 and 60773103, Natural Science Foundation of Jiangsu Province under contract BK21010134, and Natural Science Foundation of Education Department of Jiangsu Province under contract 08KJB520012 and 09KJB20013.
0 500 1000 1500 2000 2500 3000 3500
1 2 3 4 5 6 7 8 9 10
Length of stream(100K)
Memory(number of entry)
LC Our algorithm EC
1.5 2 2.5 3 3.5 4 4.5 5
1 2 3 4 5 6 7 8 9
Length of stream(100K)
Time cost(ms/K)
LC Our algorithm EC
1 1.5 2 2.5 3 3.5 4
1 2 3 4 5 6 7 8 9 10
Length of stream(100K)
Time cost(ms/K)
LC Our algorithm EC
0 0.1 0.2 0.3 0.4 0.5 0.6 0.7 0.8 0.9 1
20 40 60 80 100 Length of stream(K)
Precision
LC EC λ-Count
0 200 400 600 800 1000 1200 1400 1600 1800 2000
1 2 3 4 5 6 7 8 9 10 Length of stream(100K)
Memory(number of entry)
LC Our algorithm EC
0 0.1 0.2 0.3 0.4 0.5 0.6 0.7 0.8 0.9 1
20 40 60 80 100
Length of the stream (K)
Precision
REFERENCES
[1] G. S. Manku and R. Motwani, Approximate frequency counts over data streams. In Proc. of 28th Intl. Conf on Very Large Data Bases, pages, 2002, pp.346-357
[2] R. M. Karp, S. Shenker, and C. H. Papadimitriou. A simple algorithm for finding frequent elements in streams and bags. ACM Transactions on Database Systems, vol.28,2003,pp.51-55
[3] E. D. Demaine, A. Lopez-Ortiz, and J. I. Munro. Frequency estimation of internet packet streams with limited space. In Proceeding of the 10th Annual European Symposium on Algorithms, 2002,pp.348-360
[4] J. Misra and D. Gries. Finding repeated elements. Science of Computer Programming, vol.2, 1982,pp.143-152 [5] P. Flajolet, G.N.Martin, Probabilistic counting algorithms
for data base applications, Journal of Computer and System Sciences, vol. 31,1985, pp. 182-209
[6] K. Y. Whang, B. T. Vander-Zanden, H.M. Taylor, A linear-time probabilistic counting algorithm for a database applications, ACM Trans. Database Systems, vol.15, 1990, pp. 208-229
[7] L. Golab, D. DeHaan, A. Lopez-Ortiz, and E. D. Demaine. Finding frequent items in sliding windows with multinomially-distributed item frequencies. In Proceedings of the 16th International Conference on Scientific and Statistical Database Management, 2004, pp. 425-426 [8] P. B. Gibbons and Y. Matias. New sampling-based
summary statistics for improving approximate query answer, Proc. SIGMOD, 1998, pp.331-341
[9] Hongyan Liu, Ying Liu, Jiawei Han, Jun He, Error-adaptive and time-aware maintenance of frequency counts over data streams, Proceeding of WAIN 2006, INCS 4016, pp. 484-495
[10] C. Estan and G. Varghese. New directions in traffic measurement and accounting: focusing on the elephants, ignoring the mice. ACM Transactions on Computer System, vol. 21, 2003,pp. 270-313
[11] Charikar M, Chen K, Farach-Colton M. Finding frequent items in data streams. In: Widmayer P, Ruiz FT, Bueno RM, Hennessy M, Eidenbenz S, Conejo R, eds. Proc. of the Int’l Colloquium on Automata, Languages and Programming. Malaga: Springer-Verlag, 2002. 693-703. [12] Cormode G, Muthukrishnan S. What’s hot and what’s
not: Tracking most frequent items dynamically. In: Halevy AY, Ives ZG, Doan AH, eds. Proc. of the 22nd ACM SIGACT-SIGMOD-SIGART Symp. on Principles of Database Systems. San Diego: ACM Press, 2003. 296-306. [13] Jin C, Qian W, Sha C, Yu JX, Zhou A. Dynamically maintaining frequent items over a data stream. In: Carbonell J, ed. Proc. of the 2003 ACM CIKM Int’l Conf. on Information and Knowledge Management. New Orleans: ACM Press, 2003, pp. 287-294.
[14] M. Fang, N. Shivakumar, H. Garcia-Molina, R. Motwani, and J. D. Ullman. Computing iceberg queries efficiently. In Proceedings of 24th International Conference on Very Large Data Bases (VLDB 1998), New York, USA, Aug. 1998.
[15]Toon Calders, Nele Dexers, Bart Goethals, Mining frequent itemsets in a stream, ACM
[16]Bill Lin, Wai-Shing Ho, Ben Kao, Chun-Kit Chui, Adaptive frequency counting over bursty data streams, Proceedings of the 2007 IEEE Symposium on Computational Intelligence and data mining, 2007, pp. 516-523
[17] M. Greenwald and S. Khanna. Space-efficient online computation of quantile summaries. In Proc. SIGMOD, 2001.
[18]Wei-Ping WANG, Jian-Zhong LI, Dong-Dong ZHANG , Long-Jiang GUO, An efficient algorithm for mining approximate frequent item over data streams, Journal of Software, vol.18, no.4, 2007, pp.884-892.
[19]A. Arasu and G. Manku. Approximate counts and quantiles over sliding windows. In Proceedings of the 23rd ACM Symposium on Principles of Database Systems, 2004, pp. 286-296
[20]L. Golab, D. DeHaan, E. D. Demaine, A. Lopez-Ortiz, and J. I. Munro. Identifying frequent items in sliding windows over on-line packet streams. In Proceedings of the Internet Measurement Conference, 2003, pp.173-178
[21]L. Lee and H. Ting. A simpler and more efficient deterministic scheme for finding frequent items over sliding windows. Proceedings of the 23rd ACM SIGMOD-SIGACT-SIGART Symposium on Principles of Database Systems (PODS 2006), Chicago, USA, June 2006.
[22]Linfeng Zhang, Yong Guan, Frequency estimation over sliding windows, Proceedings of SIGKDD 2007,
[23] B. Babcock, S. Babu, M. Datar, R. Motwani, and J. Widom. Models and issues in data stream systems. Proc. PODS, 2002.
[24]S. Muthukrishnan. Data streams: Algorithms and applications. Technical Report, Rutgers University, Piscataway, USA, 2003.
[25]Hüseyin Akcan, Alex Astashyn, Hervé Brőnnimann, Deterministic algorithms for sampling count data, Data & Knowledge Engineering,vol. 64, 2008, pp.405–418 [26]Nishad Manerikar, Themis Palpanas, Frequent items in
streaming data: An experimental evaluation of the state-of-the-art, Data & Knowledge Engineering, Volume 68, Issue 4, April 2009, pp.415-430
[27]Bibudh Lahiri, Srikanta Tirthapura Identifying frequent items in a network using gossip, Journal of Parallel and Distributed Computing, Volume 70, Issue 12, December 2010, pp.1241-1253.
[28]4Nuno Homem, Joao Paulo Carvalho, Finding top-k elements in data streams, Information Sciences, Volume 180, Issue 24, 15 December 2010, pp. 4958-4974.
[29]Nuno Homem and Joao Paulo Carvalho, Finding top-k elements in a time-sliding window, Evolving Systems, 2011, Volume 2, Number 1, Pages 51-70.
[30]Regant Y. S. Hung and Hingfung F. Ting, An Ω(1/εlog(1/ε)) Space Lower Bound for Finding ε-Approximate Quantiles in a Data Stream, Lecture Notes in Computer Science, 2010, Volume 6213, Frontiers in Algorithmics, 2010, pp.89-100.
[31]C. Busch and S. Tirthapura. A deterministic algorithm for summarizing asynchronous streams over sliding windows. Proceedings of the 24th International Symposium on Theoretical Aspects of Computer Science (STACS 2007), Aachen, Germany, Feb. 2007.
[32] Zhang, Shan; Chen, Ling; Tu, Li, Frequent Items Mining on Data Stream Based on Time Fading Factor, 2009. AICI '09. International Conference on Artificial Intelligence and Computational Intelligence, Volume: 4 ,2009 , pp. 336 - 340.
[33] http://ita.ee.lbl.gov/html/contrib/WorldCup.html.2004 [34]Hongyan Liu, Ying Lu, Jiawei Han, et al. Error-Adaptive
[35]A. Manjhi et al., Finding (recently) frequent items in distributed data streams, CMU-CS-04-121, Technical report.
[36]G. Cormode and M. Hadjieleftheriou, Finding frequent items in data streams, VLDB'08, 2009, pp. 1530-1541 [37]H. Liu, Y. Liu, J. Han, Methods for mining frequent items
in data streams: an overview. Knowledge Information System, vol. 26, 2011. pp.1-30
Ling Chen Currently he is a professor of the Department of Computer Science, Information Technology College, Yangzhou University, Jiangsu Province, P.R. China. His research interests include computational intelligence, evolutional optimization and data mining. He is a member of IEEE CS society, ACM and senior mumber of Chinese Computer Society. He has co-edited 6 books/proceedings, and published more than 200 research papers including over 60 journal papers. He was awarded the Government Special Allowance by the State Council, the title of “National Excellent Teacher” by the Ministry of Education, the title of “Young and Middle-aged experts with outstanding contributions” by the Government of Jiangsu Province, the title of “Famous University Teacher of Jiangsu Province” by the Province Government and the Award of Progress in Science and Technology by the Government of Anhui Province.
His recent research has been supported by National Science Foundation of China, Science Foundation of Jiangsu Province. He has organized several academic conferences and workshops and has also served as a program committee member for several major international conferences.
Yixin Chen He is an Associate Professor of Computer Science at the Washington University in St Louis, USA. His research interests include planning and scheduling, computational optimization, data mining, and machine learning. His work on planning has won First Prizes in optimal and satisfying tracks in the International Planning Competitions (2004 & 2006) and the Best Paper Award at the International Conference on Tools for AI (2005), the Outstanding Paper Award at the AAAI Conference on Artificial Intelligence (AAAI-10). He has received an Early Career Principal Investigator Award from the Department of Energy (2006) and a Microsoft Research New Faculty Fellowship (2007). He is a senior munber of IEEE. He serves on the Editorial Board of Journal of Artificial Intelligence Research and IEEE Transactions on Knowledge and Data Engineering. He received a Ph.D. in Computing Science from University of Illinois at Urbana-Champaign in 2005.