Performance Analysis of Roundabouts under
Mixed Traffic Flow Conditions
Chandrakant Patel Dr. B.V. Khode
M. Tech Student Professor
Department of Civil Engineering Department of Civil Engineering
G H Raisoni College of Engineering, Nagpur 440016 G H Raisoni College of Engineering, Nagpur 440016
Abstract
The capacity of the roundabout mainly depends on the flow at different entry legs approaching the roundabout. The critical gap is a crucial input parameter which mainly gives the idea about the gap acceptability behavior of vehicle’s driver. The performance of roundabout or rotary intersection in terms of queue lengths, avg. control delays and degree of saturation typically depends on entry capacity. Two roundabout intersections with different geometric characteristics are taken up for performance analysis. Different modes of transportation pass through these junctions. These roundabout intersections are working under mixed traffic flow conditions. All approach entry capacity has been analyzed for both roundabouts at their entry legs. Entry capacity verses circulating flow relationship have been developed & entry capacities evaluated by different models are compared in this paper which shows the behavior and variations of each entry capacity models in our condition. This paper deals with the performance of roundabouts which is based on various parameters such as critical headway, follow-up headway, entry (approach) capacity, circulating traffic, and average control delay. Capacity analysis results indicate that most of the approaches of Medical Square roundabout has greater than 0.85 degree of saturation and these approaches are critical for traffic flow & all entry approaches of Krida Square roundabout has degree of saturation under 0.85.
Keywords: Roundabout; Critical headway; Follow-up headway; Entry Capacity; Delay; Degree of saturation; LOS ________________________________________________________________________________________________________
I. INTRODUCTION
Continuously growing population is a bigger challenge for transportation engineers. As traffic or transportation engineer, we have to provide the transportation users all the possible safety and convenience. Roundabouts are a major form of intersection which has been used in various cities of India. Roundabout is a type of intersection or a junction mostly has four legs in which the road intersection’s traffic slowed and moves continuously in one direction around a circular Island to many exits onto the multiple intersecting roads. This type of intersection generally used in rural or sub-urban areas where mostly the traffic volumes do not approaching saturation level. But with the growth of the modes of transportation along with the growing population these intersections have also become a part of urban traffic. They need enough effective capacity of roundabout intersection for traffic movements, pedestrian movement with safety, aesthetics of the area and other safety. The studies which have been made on capacity of roundabout in our country India mostly based on the IRC-65(1976) recommended method which is recommended by the T.R.B. Laboratory (United Kingdom) gave the practical capacity of different roundabout weaving sections (1; 15). Performance analysis need to be done based on other techniques or Capacity models which are used around the world for capacity analysis for rotary or roundabout intersections are generally based on: empirical approaches typically based on observed real time field data of roundabout intersection/junction capacity findings and theories of gap-acceptability generally based on models of driver’s behavior characteristics and vehicular characteristics at intersections/junction. The critical gap and follow-up time are important inputs in the evaluation of the entry capacity of roundabout intersection and is the minimum gap that a vehicle’s driver wants to merge with the moving conflicting flow or circulating traffic. The critical headway and follow-up headway values are mostly closer to the values mentioned in H.C.M. 2000. The critical headway depends upon accepted and rejected gaps on a roundabout entry (9).The Highway Capacity Manual (H.C.M.) {T.R.B. 2000} Entry Capacity Model based on gap acceptance theories is used to evaluate the entry capacity (4). Another method used to estimate entry capacity of each entry approach of roundabout is F.H.W.A. methods based on linear regression. N.C.H.R.P. Report 572 recommended a model for the entry capacity each entry approach of roundabout (8).Tanner (1967) also introduced a entry capacity model for unsignalized intersections (6). Wu. Ning. derived a formula for evaluation of the entry approach capacity of the roundabout which is modified Tanner Capacity Model (1967) as adopted by the German H.C.M. new methodology based on theories of gap-acceptability to obtain the entry capacity of roundabouts and weaving section capacity of the roundabout have been proposed (13). The total capacity of roundabout should be unrelated with the initial entry volume or flow. The L.O.S. of roundabout can be defined in terms of delays experienced by traffic users approaching the roundabout intersection (8; 10; 11).
II. METHODOLOGY
1) Follow-up Headway Estimation (sec): It is an important parameter for estimating the entry capacity of roundabout. The follow-up time is defined as the time difference between two vehicles queued in an approach entering the roundabout. The mean value of follow-up time is used for the estimation of the entry capacity.
2) Estimation of Minimum headway between the circulating vehicles (∆)(sec.): The time difference between two vehicles queued in the circulating flow before an entry approach is defined as Minimum headway between the circulating vehicles (∆) (sec). The mean value of Minimum headway between the circulating vehicles (∆) (sec) is used for the estimation of the entry capacity.
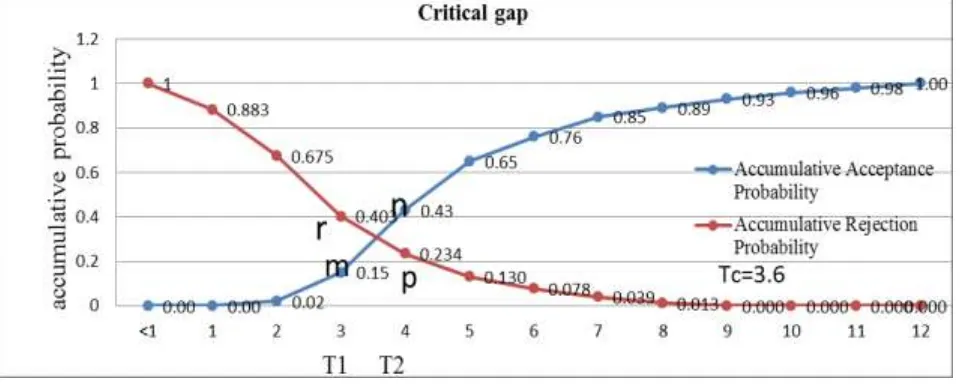
3) Critical Headway Analysis: When a driver’s vehicle in a approach leg tries to enter the circulating flow or conflicting flow, the first opening can be referred to as a time lag. If that time lag is rejected, the driver has to wait for another acceptable time gap to merge into the circulating flow or conflicting flow. That acceptable time lag is defined as critical headway/gap. One of the methods to evaluate critical headway/gap is Raff’s method (9). This method does not consider the maximum rejected time gap which are equal to zero. This method is graphical method, the critical gap is the cross point of two cumulative proportion curves of accepted and rejected gap. The cross point can be obtained by following equation:
,Where Tc= critical gap, ∆T=time lag interval, Tc lies between T1 and T2. 4) Entry (approach)Capacity Estimation:
- The H.C.M. Capacity Model for the estimation of the entry capacity of single- lane roundabouts. The formulation of HCM Model is given as follows:
3 6 0 0 3 6 0 0
1 . f c QT QT
en tr y
e e Q
C ,Where Cen try= Entry (approach) Capacity (vehicles/hour), Q = Circulating Flow or conflict flow
(vehicles/hour), Tc = Critical headway (sec), Tf = Follow-up headway(sec).
- N.C.H.R.P. Report 572 Capacity Model for the Entry Capacity of roundabouts:
c
entry a bQ
C .exp . ,Where Centry = entry (approach) capacity (PCUs/hour), Qc = conflicting flow (PCUs/hour),
f T a 3600 ’
3600 2 f c T T
b ’ Tf = follow-up headway(sec), Tc= critical headway(sec).
- Tanner’s Equation: They introduced the entry capacity formula for unsignalized road junctions. As roundabout is a type of unsignalized road junctions, this formula also applicable to evaluate the entry capacity of roundabouts. The model formula is :given below:
f f
c f
en try q T
T q f C
e
q
. fexp
1
.
.q
1
.
.
3600
, Where Cen try = entry capacity (vehicles/hour),f
q = conflict flow in front
of the entry approach (vehicles/sec), = the headway between the conflicting vehicles (minimum) (sec), Tc = critical headway (sec), Tf = follow-up time (sec).
- Modified Tanner’s Entry Capacity Model: Wu. Ning et.al. derived a new formula for the entry (approach)capacity of the roundabout(which is a modification of Tanner’s Capacity Model :1967 )and is also known as universal formula for capacity estimation of roundabout is given by:
0 3600 1 .exp
.
.
.
3600
.
1
3600
Q
T
T
N
N
N
Q
C
c f e c c centry , Where Cen try = Entry capacity (PCUs/hour), Qc
= circulating or conflict flow in front of each entry approach (PCUs/hour), Nc = number of circulating lanes, Ne = number of
lanes in subject entry approach, 2 0 f c T T
T ,Tc = critical headway (sec), Tf = follow-up headway (sec), = headway
n p
r m
] . 450 36001 )
1 [( . 900
3600 2
T s C s
s T C
da vg , Where, da vg=avg. control delay, s =degree of saturation, C=
capacity, T=time period (T=1.5 for 1.5 hour, T= 0.166 for 10 minutes. Table – 1
H.C.M. 2010 method for Level of Service definition based on Delay and V/C for vehicle with alternative methods for Roundabout.
Level of service Average control delay (veh/s) Comments
A da vg≤10 Usually no queued vehicle or circulating traffic
B 10< da vg ≤20 Occasionally more than one vehicle in the queue
C 20< da vg ≤35 It common to have a standing vehicle in queue(at least one vehicle)
D 35<
a vg
d ≤50 Delay is long enough to experience an irritation to most of the drivers
E 50< da vg ≤70 Delay reaches most driver’s level of tolerance
F da vg >70 Approx. at roundabout entry capacity
7) Queue(Q95) Analysis: The model for 95th queue length estimation is based on the FHWA Report, is given by:
3600 ] . 150 3600
1 ) 1 [( .
900 2
9 5
C
T s C s
s T
Q th , Where Q95th=95
th percentile queue length (vehicles), s=degree of
saturation, S= capacity, T=time period (T=1.5 for 1.5 hour, T=0.166 for 10 minutes.
III. DATA COLLECTION
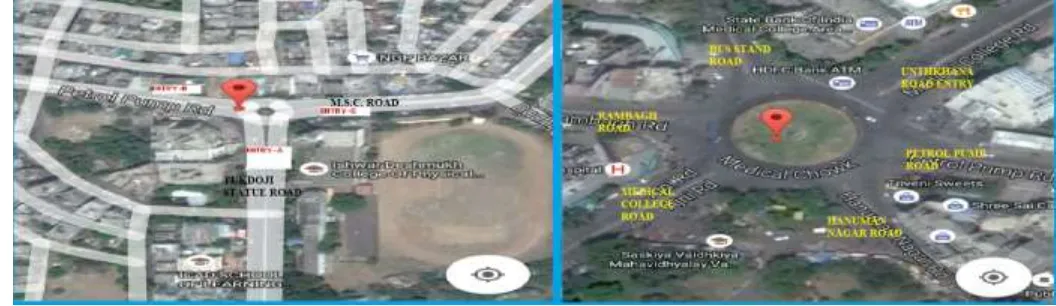
There are few roundabouts in Nagpur City (India). The study area selected is Medical Square Intersection (roundabout) which is surrounded by commercial areas. It has six roadways merging (4 roadways with single lane entries and 2 roadways with 2 lane entries at approach) or we can say it is a six leg roundabout. It is a double lane roundabout with inscribed circle diameter approximately 60 m. Other roundabout which is taken up for performance analysis is Krida Square Roundabout which is a three leg intersection with the inscribed circle diameter approximately 26 meters. The traffic flow varies during morning hours and afternoon hours. Each entry approach of both roundabouts experiences its peak during morning hour or afternoon hours. The traffic data was collected for both the roundabouts for a week (Monday to Sunday) for two periods of time morning hours (9:30-11:00AM) and afternoon hours (1:30-3:00 PM). A video camera was used for the same.
Fig. 1: Locations: KRIDA SQUARE & MEDICAL SQUARE.
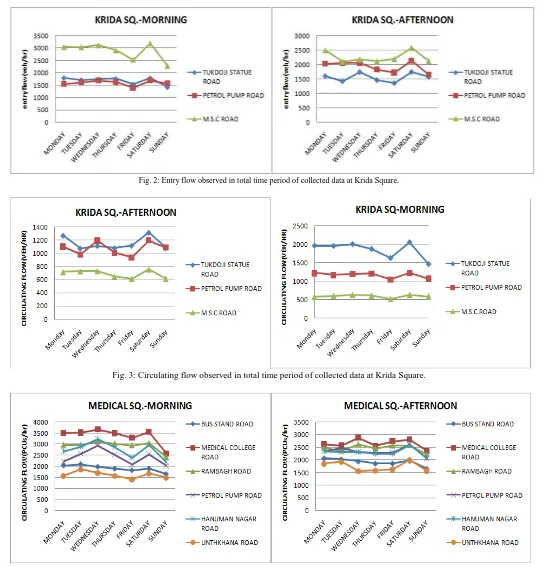
Fig. 2: Entry flow observed in total time period of collected data at Krida Square.
Fig. 3: Circulating flow observed in total time period of collected data at Krida Square.
Fig.5: Entry flow observed in total time period of collected data at Medical Square.
IV. DATA ANALYSIS & RESULTS
This performance analysis is done based on the average traffic volume/flow observed at different roundabouts and their entry approaches. The follow-up time headway evaluated based on a sample of 100 entry vehicles arriving at each entry approaches of both roundabouts. These sample calculations were done for both morning and afternoon hours for a week (Monday to Sunday). The follow-up time headway observed for Krida sq. entries ranges between 1.2 s to 1.4 s. The follow-up time headway observed for Medical sq. entries ranges between 1s to 1.4 s. Minimum headway between the circulating vehicles (∆) (sec) is also evaluated based on a sample of 100 conflicting vehicles arriving before each entry approaches of both roundabouts. Minimum headway between the circulating vehicles (∆) (sec) observed for Krida sq. entries ranges between 1.2 s to 1.4 s. Minimum headway between the circulating vehicles (∆) (sec) observed at Medical sq. entries ranges between 1s to 1.4 s. The critical gap(s) analysis was done based on a sample of 100 vehicles merging in circulating flow before each entry approaches. The accepted and rejected gaps count was done for above samples for each entry for both morning and afternoon hours for each day of data collection. The time gap was taken for this count for krida square is <1(0.5 s) to 10 s. The time gap was taken for this count for Medical square is <1(0.5 s) to 10 s. This method of critical gap estimation does not consider the “0 s” rejected gap. Critical observed for Krida sq. entries ranges between 1.7 s to 2.9 s for different enries. Critical gap (sec) observed at Medical sq. entries ranges between 2.3 s to 5.0 s.
Fig. 6: The curve of accumulative probability & critical gap.
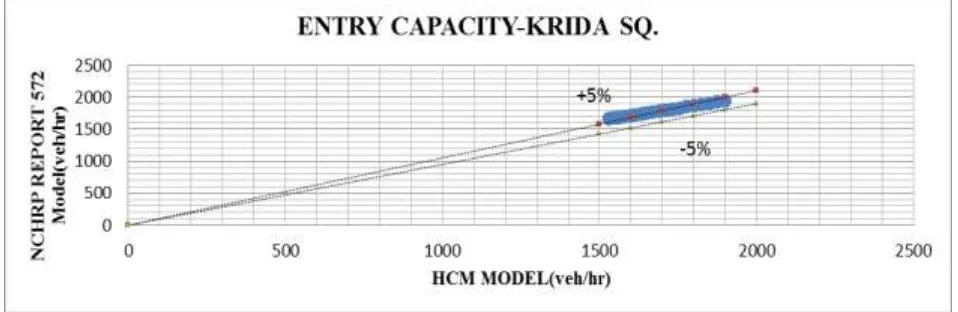
Fig. 7: Comparison of Capacity Models used for Krida Square:
The comparison showed in fig.07 is between the average values of circulating flow and entry capacity estimated for all the entry approaches combined at krida square for a week. The curves suggest that when the circulating flow increases the entry (approach) capacity decreases. The polynomial curves have significant R2 values. R2 value for Tanner’s capacity model is relatively different from the other two. The relation between observed entry capacities estimated by N.C.H.R.P. Report 572 capacity Model and H.C.M. Capacity Model at Krida sq. shows that N.C.H.R.P. Report 572 capacity Model gave the entry (approach) capacity relatively higher with approx. 5% difference.
Fig. 8: Relation between observed entry capacities.
Table – 2
Performance analysis results of M.S.C. Road entry (Krida Square) Roundabout based on estimated average values for a week of each parameter.
MORNING PERIOD
H.C.M. Model
N.C.H.R.P. Report 572
Model
TANNER’s CAPACITY MODEL
AFTERNOON PERIOD
H.C.M. Model
N.C.H.R.P. Report 572
Model
TANNER’s CAPACITY MODEL ENTRY CPACITY
(VEH./HR.) 2200 2182 2115
ENTRY CPACITY
(VEH./HR.) 2031 2037 1947
AVG. CONTROL
DELAY (VEH./S.) 2 2 2
AVG. CONTROL
DELAY (VEH./S.) 2 2 2
95TH QUEUE
LENGTH(VEH.) 4 4 4
95TH QUEUE
LENGTH (VEH.) 3 3 3
DEGREE OF
SATURATION 0.46 0.46 0.50
DEGREE OF
SATURATION 0.49 0.49 0.52
MORNING PERIOD
H.C.M. Model
N.C.H.R.P. Report 572
Model
TANNER’s CAPACITY MODEL
AFTERNOON PERIOD
H.C.M. Model
N.C.H.R.P. Report 572
Model
TANNER’s CAPACITY MODEL ENTRY CPACITY
(VEH./HR.) 1851 1859 1629
ENTRY CPACITY
(VEH./HR.) 1988 2015 1807
AVG. CONTROL
DELAY (VEH./S.) 2 2 2
AVG. CONTROL
DELAY (VEH./S.) 2 2 2
95TH QUEUE
LENGTH(VEH.) 3 3 3
95TH QUEUE
LENGTH (VEH.) 3 3 3
DEGREE OF
SATURATION 0.56 0.57 0.57
DEGREE OF
SATURATION 0.53 0.52 0.54
L.O.S. A A A L.O.S. A A A
The result shows that the entry approach is under saturation level and it is performing well. Table – 4
Performance analysis results of Tukdoji-Statue Road entry (Krida Square) Roundabout based on estimated average values for a week of each parameter.
MORNING PERIOD
H.C.M. Model
N.C.H.R.P. Report 572
Model
TANNER’s CAPACITY MODEL
AFTERNOON PERIOD
H.C.M. Model
N.C.H.R.P. Report 572
Model
TANNER’s CAPACITY MODEL ENTRY CPACITY
(VEH./HR.) 988 1010 660
ENTRY CPACITY
(VEH./HR.) 1482 1494 1325
AVG. CONTROL
DELAY (VEH./S.) 4 4 6
AVG. CONTROL
DELAY (VEH./S.) 2 2 3
95TH QUEUE
LENGTH(VEH.) 5 5 8
95TH QUEUE
LENGTH (VEH.) 3 3 4
DEGREE OF
SATURATION 0.63 0.63 0.72
DEGREE OF
SATURATION 0.51 0.51 0.54
L.O.S. A A A L.O.S. A A A
The result shows that the entry approach is under saturation level and it is performing well.
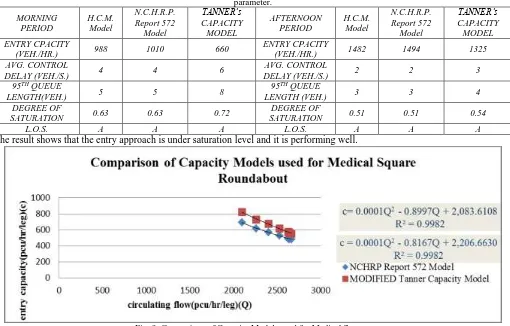
Fig. 9: Comparison of Capacity Models used for Medical Square.
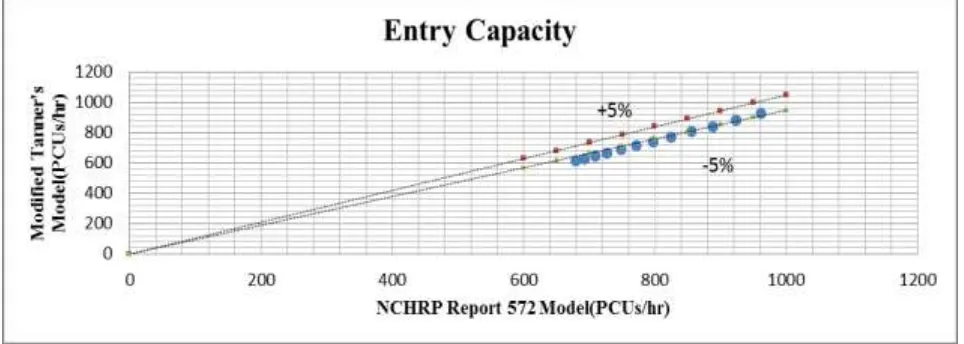
Fig. 10: Relation between observed entry capacities.
Table – 5
Performance analysis results of Hanuman Nagar Road Entry (Medical Square) Roundabout based on estimated average values for a week of each parameter.
MORNING PERIOD
N.C.H.R.P. Report 572
Model
MODIFIED TANNER’S CAPACITY MODEL
AFTERNOON PERIOD
N.C.H.R.P. Report 572
Model
MODIFIED TANNER’S CAPACITY MODEL ENTRY CPACITY
(PCUs../HR.) 635 557
ENTRY CPACITY
(PCUs../HR.) 913 818
AVG. CONTROL
DELAY (VEH./S.) 15 23
AVG. CONTROL
DELAY (VEH./S.) 9 12
95TH QUEUE
LENGTH(VEH.) 34 47
95TH QUEUE
LENGTH(VEH.) 16 22
DEGREE OF
SATURATION 0.92 0.95
DEGREE OF
SATURATION 0.85 0.89
L.O.S. B C L.O.S. A B
The result shows that the entry approach is over saturation level and it is working better in afternoon period than in mourning period.
Table – 6
Performance analysis results of Medical Hospital Road Entry (Medical Square) Roundabout based on estimated average values for a week of each parameter.
MORNING PERIOD
N.C.H.R.P. Report 572
Model
MODIFIED TANNER’S CAPACITY MODEL
AFTERNOON PERIOD
N.C.H.R.P. Report 572
Model
MODIFIED TANNER’S CAPACITY MODEL ENTRY CPACITY
(PCUs../HR.) 94 164
ENTRY CPACITY
(PCUs../HR.) 189 349
AVG. CONTROL
DELAY (VEH./S.) 54 57
AVG. CONTROL
DELAY (VEH./S.) 44 39
95TH QUEUE
LENGTH(VEH.) 71 74
95TH QUEUE
LENGTH(VEH.) 60 55
DEGREE OF
SATURATION 0.99 1
DEGREE OF
SATURATION 0.98 0.97
L.O.S. E E L.O.S. D D
The result shows that the entry approach is over saturation level and it is not working in good condition because of higher delays. Table – 7
Performance analysis results of Rambagh Road Entry (Medical Square) Roundabout based on estimated average values for a week of each parameter.
MORNING PERIOD
N.C.H.R.P. Report 572
Model
MODIFIED TANNER’S CAPACITY MODEL
AFTERNOON PERIOD
N.C.H.R.P. Report 572
Model
MODIFIED TANNER’S CAPACITY MODEL ENTRY CPACITY
(PCUs../HR.) 241 203
ENTRY CPACITY
DEGREE OF
SATURATION 0.96 0.97
DEGREE OF
SATURATION 0.94 0.95
L.O.S. D D L.O.S. C C
The result shows that the entry approach is over saturation level and it is not working in good condition because of higher delays but it is working better in afternoon period than in morning period.
Table – 8
Performance analysis results of Bus-Stand Road Entry (Medical Square) Roundabout based on estimated average values for a week of each parameter. MORNING PERIOD N.C.H.R.P. Report 572 Model MODIFIED TANNER’S CAPACITY MODEL AFTERNOON PERIOD N.C.H.R.P. Report 572 Model MODIFIED TANNER’S CAPACITY MODEL ENTRY CPACITY
(PCUs../HR.) 781 736
ENTRY CPACITY
(PCUs../HR.) 864 845
AVG. CONTROL
DELAY (VEH./S.) 9 11
AVG. CONTROL
DELAY (VEH./S.) 8 9
95TH QUEUE
LENGTH(VEH.) 11 13
95TH QUEUE
LENGTH(VEH.) 10 11
DEGREE OF
SATURATION 0.77 0.80
DEGREE OF
SATURATION 0.75 0.78
L.O.S. A B L.O.S. A A
The result shows that the entry approach is under saturation level and it is working in good condition because of lesser delays. Table – 9
Performance analysis results of Unthkhana Road Entry (Medical Square) Roundabout based on estimated average values for a week of each parameter. MORNING PERIOD N.C.H.R.P. Report 572 Model MODIFIED TANNER’S CAPACITY MODEL AFTERNOON PERIOD N.C.H.R.P. Report 572 Model MODIFIED TANNER’S CAPACITY MODEL ENTRY CPACITY
(PCUs../HR.) 895 1673
ENTRY CPACITY
(PCUs../HR.) 857 1607
AVG. CONTROL
DELAY (VEH./S.) 8 4
AVG. CONTROL
DELAY (VEH./S.) 8 5
95TH QUEUE
LENGTH(VEH.) 15 9
95TH QUEUE
LENGTH(VEH.) 14 9
DEGREE OF
SATURATION 0.83 0.74
DEGREE OF
SATURATION 0.82 0.74
L.O.S. A A L.O.S. A A
The result shows that the entry approach is under saturation level and it is working in good condition because of lesser delays. Table – 10
Performance analysis results of Petrol Pump Road Entry (Medical Square) Roundabout based on estimated average values for a week of each parameter. MORNING PERIOD N.C.H.R.P. Report 572 Model MODIFIED TANNER’S CAPACITY MODEL AFTERNOON PERIOD N.C.H.R.P. Report 572 Model MODIFIED TANNER’S CAPACITY MODEL ENTRY CPACITY
(PCUs../HR.) 617 547
ENTRY CPACITY
(PCUs../HR.) 614 547
AVG. CONTROL
DELAY (VEH./S.) 13 17
AVG. CONTROL
DELAY (VEH./S.) 13 16
95TH QUEUE
LENGTH(VEH.) 24 29
95TH QUEUE
LENGTH(VEH.) 16 20
DEGREE OF
SATURATION 0.87 0.90
DEGREE OF
SATURATION 0.84 0.87
L.O.S. B B L.O.S. B B
The result shows that the entry approach is over saturation level but it is working better in afternoon period than in morning period.
V. CONCLUSION & FUTURE SCOPE
REPORT 572 based model estimated entry capacity of Medical square roundabout approaches having 1 lane entry relatively higher than that of modified Tanner’s Model.
This performance analysis can help traffic regulatory agencies to be aware of the present operational conditions of both the roundabouts. Various methods used to estimate the entry capacity in this study should be used more in Indian conditions to check their applicability and suitability. These methods are generally used for 4 leg intersections, more studies need to done on the roundabouts having different geometric features such as Medical square having different entry approaches in terms of entry lanes.
REFERENCES
[1] IRC:65-1976;"Recommended practice for traffic rotaries". Indian Road Congress, New Delhi(India).
[2] Wu. N. (1997); "An Universal Formula For Calculating Capacity at Roundabout', Arbeitsblaetter of Institute for Traffic Engineering. No.13, Ruhr-University Bochum, March 1997.
[3] Federal Highway Administration (2000); "Roundabout: An Informational Guide"FHWA-RD-00-67, Department of Transportation. Washington, DC. [4] Serhan Tanyel et.al. ASCE (2005);”Determining the capacity of single-lane roundabouts in Izmir,Turkey”.
[5] NCHRP (2007) Report 572;”Roundabouts in the United States”.
[6] Serhan Tanyel et.al. ASCE (2007);”Applicability of various capacity models for singles-lane roundabouts in Izmir, Turkey”. [7] Rui-jun Guo et.al. IEEE (2009);”The iterative calculation of full capacity of roundabouts”.
[8] Osama A. Abaza et.al. IEEE (2009);”Comparative Analysis of Multilane Roundabout Capacity-Case Study”. [9] Ruijun Guo et. al. IEEE(2010);”Estimating critical gap of roundabouts by different methods”.
[10] Guiffre O. et. al. ELSEVIER (2012);”Turbo-roundabout vs. Roundabouts performance level”. [11] Ruijun Guo et. al. IEEE (2011);”A study on delay of single lane roundabout”.
[12] Dr. L.R. Kadiyali (2012);”Traffic Engineering and Transportation Engineering”. [13] Weiqi Wang et.al. ELSEVIER (2012);”Research on Capacity of Roundabouts in Beijing”.
[14] Xiaobo Qu et.al. ASCE (2014);”Estimation of entry capacity for single-lane modern roundabouts:case study in Queensland, Australia”. [15] Mitesh kumar N Damor et.al. IJETAE (2014);”An evaluation of capacity of roundabout: a case study of Anjali Roundabout at Ahmadabad”. [16] Taylor W.P. Lochrane et.al ASCE (2014);”Determination of Mini-Roundabout Capacity in the United States”.