Enhanced Clustering Technique for Search
Engine Results using K-Algorithm
Dr. M. Manikantan N. Jayakanthan
Assistant Professor (SRG) Assistant Professor (SRG) Department of Computer Applications Department of Computer Applications Kumaraguru College of Technology, Coimbatore Kumaraguru College of Technology, Coimbatore
Abstract
The web is the imperial component in human life. The usage of the websites increases in present scenario. The search engines are vital element to find essential information on the internet through web queries. The volume of the search queries also increases to serve the different need of the end users. So this paper proposed a novel approach to classify search queries based on its indented results. An enhanced K-means clustering algorithm based tool is developed to address this need. The tool is tested in real time and the result shows the efficiency the proposed approach.
Keywords: Clustering algorithm, k-means algorithm, search engine optimization, semantic web and web query optimization
________________________________________________________________________________________________________
I. INTRODUCTION
The World Wide Web (www) has become a vital tool in many people’s daily lives by providing solutions from various web resources. Nearly 70 percent of searchers use optimized web queries in search engines of the Internet. The major search engines receive hundreds of thousands of web sites results per query and present page wise results in response to these query. Our research objective is to classify a large set of web results from a web search engine automatically into separate clusters. To accomplish this task, a framework was developed by encoding the characteristics of the informational, navigational, and transactional queries that identifies from the automatic classifier using the proposed k-algorithm for clustering [4] [12]. For the implementation purpose, the algorithm is divided into three portions of a web search engine transaction log [1].
II. EXISTING SEARCH MODELS
2.1 Boolean model: The Boolean search model is for information retrieval, one of the earliest and simplest retrieval methods of using the exact notation of finding the relevant web documents to a user query. Words arecombined with Boolean operators like AND, OR, NOT, while search is retrieving the more relevant documents. Ex: car AND maintenances are the words in search on a Boolean engine that causes the search by documents uses this words are valid input. But relevant document like automobile are not returned. Major issue of this type of search falls to a prey of two problems: synonymy and polysemy. Synonymy-multiple words with same meaning do not return keywords not in original query. Polysemy - it can cause a search of many documents that are irrelevant to the user actually intended.
2.2 Vector space model: It transforms textual data into numeric vectors and matrices and then employs matrix analysis to discover key features and connections in the document collection. It will overcome the problems of synonymy and polysemy by using the advance latent semantic indexing (LSI). LSI processes the engine query and will return car relevant documents related semantically. It has two benefits. 1. Relevance scoring: It places a number between relevant documents from 0 to 1 that partially match the relevant document for query. 2. Relevance feedback: The group documents are retrieved through degree of relevancy.
2.3 Probabilistic model: It attempts to estimate the probability that the user will find a particular document relevantly. Retrieved documents are ranked by their odds of relevance and the ratio of probability that the document is relevant to the query divided by document not relevant to the query. It can accommodate prior preferences of tailoring search results to the user query by this model.
2.4 Meta search model: Meta search engine consist of three basic models. It sends the user query to various search domains and transfers the result in unified model. It includes subject specific search domain, which helps to search within particular discipline.
2.5 Comparing search engine models: The two most common ratings used to differentiate the various search techniques are precision and recall for performance measures. Precision: It is the ratio between the number of relevant documents retrieved and the total number of documents retrieved. Recall: It is the ratio between the number of relevant documents retrieved and the total number of relevant documents in the collection.
code like their title length, number of keywords, URL length and number of back links, in links .Based on these parameters clusters are made to derive the conclusion. A well-known technique for clustering is based on K-means, in which the data is partitioned into K clusters known as cluster centers after which it can enable users to find the information to the point providing user interaction with the search output. According to incomplete statistics, the number of Internet users in China in 2008 reached 200.Million people, 89% of those Internet users mainly use the Internet to obtain information. Information of which 88.8% will make use of Internet search engines search information and only 11% use it for E-Mail. Web search engines have become an important part. With the rapid growth of web pages, it is very tough for users to find the relevant [9].
III. IMPLEMENTATION
The overall clustering process:
1) Choose k cluster centers and initialize them to randomly defined points inside the dataset.
2) Optimize the dataset by assigning each sample to its closest prototype using their Euclidean distance. 3) Update the centroids (prototypes) by computing the average of all the samples associated with that prototype.
4) If the convergence criterion is not met return to step 2. The usual convergence Criterion is where the decrease in the objective function is less than a threshold limit. Many clustering analysis algorithm are available of which the most well-known is the K-means algorithm which is based on division? K-Means clustering is a popular algorithm to find the clusters in a dataset by iterative computations. It has the advantage of all simple in the implementation and finding at least local optimal clustering. K-Means algorithm is employed to find the clustering in dataset. Clustering can enable users to find the relevant documents more easily. This paper aims to investigate the websites that are in top in one cluster and other sites in second cluster and for top ranking, we need URL, back-links, in-links, length of title are required.
Clustering Dataset
It is based on k-means” that it is closely related to a number of other clustering and location problems which include the Euclidean k-medians to minimize the sum of distances to the nearest center, and the geometric k-center problem and aims to minimize the maximum distance from every point to its closest center. K-Means clustering is a very popular algorithm to find the clusters in a dataset by Iterative computations. It has the advantage of simple implementation and finding at least local optimal clustering. K-Means algorithm is employed to find the clustering in dataset. K-Means algorithm is employed to find the clustering in dataset. The algorithm is composed of the following steps [10][11].
1) Initialize k cluster centers to be seed points. (These centers can be randomly Produced or use other ways to generate). 2) For each sample, find the nearest cluster center; put the sample in this cluster and recompute center of the altered cluster
(Repeat n times).
3) Exam all samples again and put each one in the cluster identified with the nearest center (don’t recomputes any cluster centers). If members of each cluster haven’t been changed, stop. If changed, go to step 2.User identification: a user code that the Dogpile server automatically assigned in order to identify a particular computer.
Cookie: an anonymous cookie that the Dogplie server automatically assigns in order to identify unique users on a specific computer. Time of day: the recorded time as measured in hours, minutes, and seconds by the Dogpile server. Query terms: the exact terms of the query as entered by a specific user. Source: the type of content collection the user is searching in (e.g. web, images, audio, or video). Web is the default source.
The 4,056,374 records of the flat ASCII transaction log file were imported into a relational database and a unique identifier was generated for each record. The fields of “Time of day”, “User identification”, “Cookie”, and “Query” were used to locate the initial query of a session and then recreate the series of actions in the session. There is no definitive way to identify agent submissions, but we used a similar approach to that used in prior work by having an upper cut-off on queries (Silverstein et al., 1999). We used 100 queries as the cut-off. The approach does not guarantee that all agent sessions were removed.
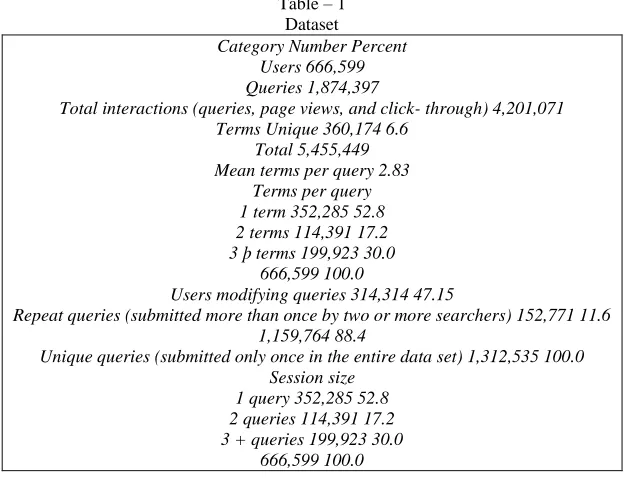
In order to minimize skewing the results by result list viewing, we collapsed the search using user identification, cookie, and query. This eliminated the duplicates viewing of result. In addition, all records with null queries were removed. After this pre-processing of the transaction log, the database contained 1,874,397 queries from 666,599 users (identified by unique IP address and cookie) containing 5,455,449 total terms with 4,201,071 total interactions. The interactions included submitting a query, viewing a search engine results page or clicking on a URL. Table I provides the overall statistics for the dataset. We calculated three additional attributes for each record:
1) Query length: the number of terms contained in a particular query.
2) Results page: a number representing the search engine results page (SERP) Viewed (blank is first page, 1 is second page, etc.) during a given interaction user intent of web queries 569.
Table – 1 Dataset
Category Number Percent Users 666,599 Queries 1,874,397
Total interactions (queries, page views, and click- through) 4,201,071 Terms Unique 360,174 6.6
Total 5,455,449 Mean terms per query 2.83
Terms per query 1 term 352,285 52.8 2 terms 114,391 17.2 3 þ terms 199,923 30.0
666,599 100.0
Users modifying queries 314,314 47.15
Repeat queries (submitted more than once by two or more searchers) 152,771 11.6 1,159,764 88.4
Unique queries (submitted only once in the entire data set) 1,312,535 100.0 Session size
1 query 352,285 52.8 2 queries 114,391 17.2 3 + queries 199,923 30.0
666,599 100.0 IV. K-ALGORITHM ANALYSIS
In this section we describe the K-algorithm the main reason for having many clustering methods suggest dividing the clustering methods into two main groups: hierarchical and partitioning methods. An empirical study of K-means, SA, TS, and GA was presented by Al-Sultan and Khan (1996). TS, GA and SA were judged comparable in terms of solution quality, and all were better than K-means. However, the K-means method is the most efficient in terms of execution time; other schemes took more time (by a factor of 500 to 2500) to partition a data set of size 60 into 5 different clusters. [3]
Input: S (instance set), K (number of cluster) Output: clusters
1) Initialize K cluster centers.
2) while termination condition is not satisfied do 3) Assign instances to the closest cluster center. 4) Update cluster centers based on the assignment. 5) end while
K-means algorithm performed on a sample size of m instances, each characterized By N attributes, is: O (T ¤ K ¤ m ¤ N).
The K-means algorithm may be viewed as a degenerate EM algorithm, in which: p (k=x) = (1 k = argmaxk f^p (k=x) g0 Otherwise assigning instances to clusters in the K-means may be considered as the E-step: computing new cluster centers may be regarded as the M-step.
The commonly used Euclidean distance between two objects is achieved
When g = 2. Given g = 1, the sum of absolute paraxial distances (Manhattan metric) is obtained, and with g=1 one gets the greatest of the paraxial distances (Chebychev metric).
Input: S (instance set), K (number of clusters), T0 (initial temperature), Tf
(Final temperature), c (temperature reducing constant) Output: clusters
1) Randomly select p0 which is a K-partition of S. Compute the squared error value E (p0). 2) while T0 > Tf do
3) Select a neighbor p1 of the last partition p0. 4) if E (p1) > E (p0) then
5) p0 Ã p1 with a probability that depends on T0 6) else
7) p0 Ã p1
Working with Weka on Dataset for query clustering:
Open Weka, and then click on right side option –explorer, then Open data file under preprocess option which is in CSV format. As we choose the explorer option it will appear as shown in the screen shot in fig 1. Open the file option tab now click on view open file and choose the data set. Weka provides filters to accomplish all of these preprocessing tasks, they are not necessary for clustering in Weka. This is because Weka ‘Simple K Means’ algorithm automatically handles a mixture of categorical and numerical attributes. This algorithm automatically normalizes numerical attributes when a distance computation is done .This gives all the attributes that are present in the dataset. We can choose any one which we want to include or select all. Open csv format [5][6].
Fig. 1: Open a CSV file.
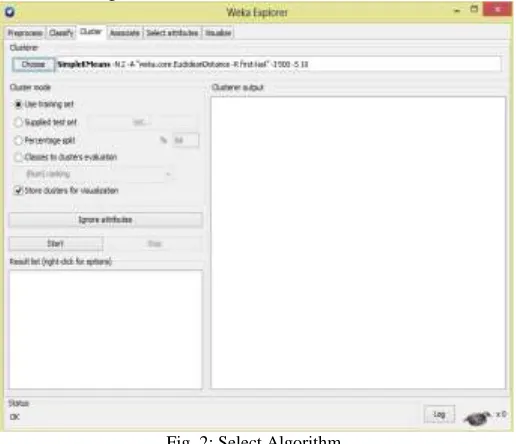
After this, click on cluster tab and click on choose button on left side and select Clustering algorithm which we want to apply, we select simple k means which is shown in fig 2. [7]
Fig. 2: Select Algorithm.
Next, click on the text box to the right of the "Choose" button to get the pop-up window as shown in Fig 3, for editing the clustering parameter. In the pop-up window, enter 4 as the number of clusters.
Fig. 3: Choose Attributes.
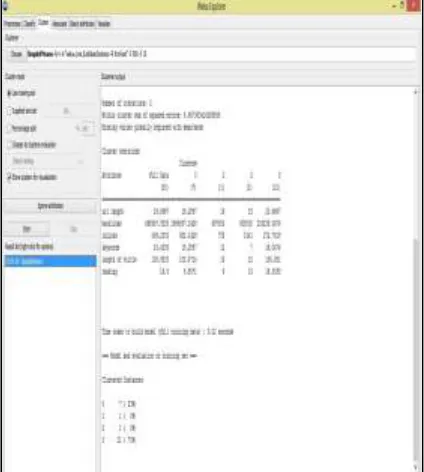
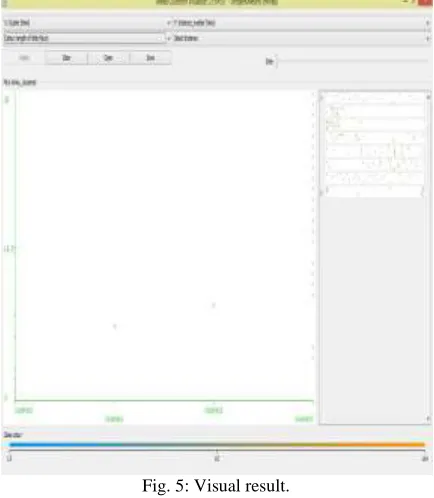
Once the options have been specified, run the clustering algorithm. Make sure that in the "Cluster Mode" panel, the "Use training set" option is selected, and then click "Start”. If user wants to view the results of clustering in a separate window then right click the result set in “Result List” panel. This result window will show the centroid of each cluster as well as statistics on the number and percentage of instances assigned to different clusters. Cluster centroids are the mean vectors for each cluster (so, each dimension value in the centroid represents the mean value for that dimension in the cluster). Thus, centroids can be used to characterize the cluster. The result shows that in cluster 0 there are 7 websites that have URL length 18 characters long, back- links 1965857, in-links 682, keywords 15 characters long and length of title 108 and in cluster 1 there is 1 website that has URL length 19characters long, back-links 69700, in-links 733, keywords 12 characters long and length of title 19 and in cluster 2 there are 1 websites that have URL length 15 characters long, back-links 605000, in-links 1041, keywords 7 characters long and length of title 15 and in cluster 3 there are 21 websites that have URL length 20 characters long, back-links 233239, in-links 272, keywords 16 characters long and length of title 106 as shown in fig 4. Another way of understanding the characteristics of each cluster is through Visualization. This can be done by right-clicking the result set on the left "Result list panel and selecting Visualize cluster assignments”. This pops up the visualization window as shown in Fig 5.
In this, choose the cluster number and any of the other attributes for each of the three different dimensions available (x-axis, y-axis, and color). Different combinations of choices will result in a visual rendering of different relationships within each cluster.
Fig. 5: Visual result.
In the above example, choose the cluster number as the x-axis, the instance number (Assigned by Weka) as the y-axis, and the "length of title" attribute as the color dimension. This will result in a visualization of the distribution of length of title in two clusters.
Results Discussion:
We implemented the k-mean data mining technique in three different-sized portions (e.g. 300, 700, and 1,000) of the data set in academic domain. On each occasion, a different number of Random queries were chosen for the run. For each run, 75 percent of each dataset was used as training data to estimate the model and the remaining 25 percent was used as test data. We ran three different datasets to provide robustness to our results. The 400 query dataset was used and check if the k-means model was correct or not, especially to see if the flow adhered to expectations Error percentages were calculated using both the training data and the test data. For the test data, there was no iteration within the algorithm and the final position of the centroids obtained from the training data was used for the test data to calculate the percentage accuracy or agreement between the two data subsets. The data set was classified manually, although snippets of code were utilized to label similar queries.[1].
Various types of user queries are processed into the academic domain and categorized the final results in Table 2. The query processing time and the number of clustering groups are the two main factors to evaluate the efficiency of this technique. Based on the result, this technique is more effective and efficient for online data clustering techniques.
Table - 2
Cluster result for the user query in academic domain
User Query No. of Web Sites Used
No. of Clusters for K-Mean Algorithm
Processing Time for K-Mean Algorithm (Seconds)
Best Polytechnics 100 6 28
Best R&D Research centers 200 7 32
Best schools 400 5 39
Best Universities 600 8 44
Best Engineering Colleges 800 9 48
Best B-Schools 1000 6 51
V. CONCLUSION
algorithm used previously. The k-means clustering approach to classifying user intent explored in this research has opened up important venues for implementing automatic user intent classification and has considerable potential for future research.
ACKNOWLEDGEMENT
We assured that the article is original, written by stated author/s, has not been published before and it will not be submitted anywhere else for publication prior to acceptance/rejection by Gazette Tehnički vjesnik/Technical (TV/TG), contains no unlawful statements, does not infringe the rights of others, and that any necessary written permissions to quote from other sources have been obtained by the author/s.
REFERENCES
[1] Ashish Kathuria, Bernard J. Jansen, Carolyn Hafernik and Amanda Spink, ‘Classifying the user intent of web queries using k-means clustering’, Internet Research, 2010.
[2] Amy N. Langville & Carl D. Meyer, ‘Google's Page Rank and Beyond: The Science of Search Engine Rankings’, 2006. [3] Oded Maimon and Lior Rokach, ‘Data mining and Knowledge discovery handbook’, Tel-Aviv University, Israel, 2005.
[4] Minky Jindal and Nisha Kharb,‘K-means Clustering Technique on Search Engine Dataset using Data Mining Tool’, in International Journal of Information and Computation Technology, 2013.
[5] http://maya.cs.depaul.edu/classes/ect584/weka/k-means.html. [6] http://www.cs.ccsu.edu/~markov/weka-tutorial.pdf.
[7] http://www.iasri.res.in/ebook/win_school_aa/notes/WEKA.pdf. [8] http://www.bvicam.ac.in/news/INDIA.Com.
[9] Wang Jun and OuYang Zheng-Zheng, ‘The Research of K- Means Clustering Algorithm Based on Association Rules’, In proceeding International Conference on Challenges in Environmental Science and Computer Engineering, 2010.
[10] S.Kantabutra, ‘Efficient Representation of Cluster Structure in Large Data Sets’, Ph.D. Thesis, Tufts University, Medford, September 2001.
[11] R. Kannan, S. Vempala and Adrian Vetta, ‘On Clusterings Good, Bad, and Spectral’ In Proc. of the 41st Foundations of Computer Science, Redondo Beach, 2005.