DOI:10.21276/ijprhs.2018. 2018. 02.08
Harish Padhet al. CODEN (USA)-IJPRUR, e-ISSN: 2348-6465
Original Article
Formulation Development and Optimization of
Efavirenz Loaded SLNs and NLCs using
Plackett-Burman Design and its Statistical Elucidation
Neha Mishra
1, 2, Manju Mishra
3, Harish Padh
1, 2, *1
Department of Pharmaceutics, B. V. Patel Pharmaceutical Education and Research Development (PERD) Centre, Thaltej, Ahmedabad, Gujarat, 380054, India.
2
Sardar Patel University, Vallabh Vidyanagar, Anand, Gujarat 388120, India.
3
National Institute of Pharmaceutical Education and Research, Opposite Air Force Station, Palaj, Gandhinagar, Gujarat 382355, India.
A R T I C L E I N F O A B S T R A C T
______
1. INTRODUCTION
Efavirenz (dideoxyinosine, ddI) is a selective non-nucleoside reverse transcriptase inhibitor (NNRTI). It is a synthetic purine derivative and approved specifically for the treatment of HIV-1 infections as part of a three drug-regimen for multi-drug combination therapy (CART). Its chief pharmacokinetic parameters include a half-life of 52 - 76 h
International Journal of Pharma Research and Health Sciences
Available online at
www.pharmahealthsciences.net
Received: 22 Feb 2018 Accepted: 13 Mar 2018
Efavirenz is water insoluble and a selective non-nucleoside reverse transcriptase inhibitor drug. Preformulation study of drug including solubility, LogP, screening of lipids, surfactants and cosurfactants was done using conventional methods. Further size reduction of solid lipid nanoparticles (SLN) and nanostructerd lipid carrier (NLC) was brought about by using High pressure homogenization (HPH). For optimization of formulation a hybrid design of experiments (DoE) was utilized comprising of a low-resolution screening design (2 level Plackett-Burman) and a higher resolution (3 level factorial) design. To further delineate the findings of ANOVA and Kruskal-Wallis test (2 level design), a post-hoc test (3 level design) was performed. Plackett-Burman design was successful in identifying via regression analysis that liquid lipid Miglyol, GMS (p = 0.039), surfactants and pressure during HPH cycles had the main effect on particle size. The findings suggested that presence of surfactant in both internal and external phases, 5 cycles of HPH and 900 bar pressure were the most significant levels for the main input factors. NLC for F-2 (GMS:TG: Miglyol - 1:2.5:0.01), with avg. size 105.3 nm, pdI 0.293, EE 37%, TDC 45% and LD 25% was concluded as the optimized formulation and was in-line with the values predicted by the optimization software.
Key Words: Efavirenz, Solid lipid nanoparticles (SLN) and nanostructerd lipid carrier (NLC), Drug delivery.
Corresponding author * Dr. Harish Padh Ex-Vice Chancellor,
Sardar Patel University, Vallabh Vidyanagar, Anand, Gujarat 388120, India
(single dose)1, protein binding of 99.95%, a peak plasma conc. in 4.5 h, plasma conc (steady-state) in 6-10 days2and CSF-plasma ratio 0.69%. It is highly lipophilic with logP of 4.6, weakly acidic with a pKa of 10-12.52 and is practically insoluble in water (≤ 10 µg/ml). EFZ is a BCS Class II drug (low soluble and high permeable drug). EFZ also undergoes extensive first pass metabolism and bears an unpalatable taste. A lot of efforts are directed towards increasing its oral bioavailability 3, which is low (40 - 45%) owing to slow inherent dissolution (gastric). One such means is drug delivery utilizing lipids.4, 5
Lipids facilitate the formation of colloidal species within the intestine that maintain the otherwise poorly water-soluble drugs in solution and thus assist in their absorption. These species result from the intra luminal processing of the lipids in the intestine (via digestion and dispersion) prior to absorption. Lipids avoid drug accumulation into non specific tissues and influence the drug absorption pathway. In addition, lipids can delay gastric transit and enhance passive intestinal permeability. Lipids and lipid excipients have also been suggested to improve drug absorption through mitigation of presystemic drug metabolism associated with gut membrane-bound cytochrome P-450 enzyme or via inhibition of the P-glycoprotein efflux transporter. The present work elaborates formulation of Efavirenz loaded solid lipid nanoparticles (SLNs) and nano-structured lipid carriers (NLCs) 6 using Plackett-Burman design and its statistical interpretation.
2. MATERIAL AND METHODS 2.1 Materials7
Efavirenz were received from Ranbaxy Laboratories Ltd. (Gurgaon, India). Lipids utilized were Gelucire 44/14 [EP lauroyl macrogol 32 glycerides] from Gattefosse SAS (France)8(gift sample), Imwitor 900 (F) P9, 10and Dynasan 114 (Dyn114)10, 11from Chika Pvt. Ltd. (Mumbai), Myglyol 810N from Sasol (Germany, GmbH). Disodium hydrogen orthophosphate (anhydrous purified), Isopropyl Myristate, Propylene glycol AR (prop 1, 2 - diol), Benzene extra pure and Tween 80 LR (polyethylene glycol sorbitan) 12 used were from SDFCl, sd fine chem. Ltd. (Bombay). Methanol (ExcelR) and Chloroform SQ used were from Qualigens, Fisher Scientific. Hexane AR and potassium dihydrogen phosphate LR were from Rankem, RFCL Ltd. (New Delhi). Pleuronic F127 used was from Sigma Aldrich and PEG 400 was from Spectrochem Pvt. Ltd. (Bombay). Water used was distilled water and double distilled of MilliQ grade. All other chemicals were pharmacopoeial or analytical reagent grade chemicals.
2.2 Methods
2.2.1 Analytical Method Development and Validation[13,14]
Simple, sensitive and specific spectrophotometric method was developed and validated for Efavirenz (EFZ) in CH3OH,
CHCl3, DCM and 1% SLS for the determination of drug.
The method was validated for parameters like Linearity,
Precision, Sensitivity, Robustness, Limit of Detection (LOD) and Limit of Quantification (LOQ).
2.2.2 Preformulation15, 16
A. Solubility studies
Equilibrium solubility of Efavirenz (EFZ) was determined in distilled water. An excess amount of the drug was shaken in separate flasks with distilled water (10 ml) and different stabilizers (1% w/v) like polyethylene glycol, gelucire 44/14[8]and polysorbate80 using mechanical Rotatest shaker (R100 Tw Luckham, England) at room temperature (25±2°C) for 24 h. The samples were centrifuged (Hettich Zentrifugen Universal 320 R centrifuge) at 3000 rpm for 20 min and supernatant was filtered using Millipore syringe filters (0.22 µm), extracted with CHCl3 and analyzed on UV
spectrophotometer. For estimation of EFZ solubility in liquid lipids, similar procedure was repeated.15-16
B. Partition Coefficient Determination17-19
Shake flask method is ideally recommended for drugs with logP greater than or around 4.For EFZ (logP = 4.6), organic
[benzene, chloroform and isopropyl myristate] and aqueous
phase [phosphate buffer at pH = 7.4 (33°C)] both 20 ml each were chosen for experimental set up, shaken on REMI water bath shaker (37°C) for 15 hrs. till they get saturated with each other. Drug(4 gms)was added to the flask and then centrifuged for 20 min at 3000 rpm for estimating drug content.
C. FTIR Spectroscopy
An IR Affinity -1 (Shimadzu, Japan) was used for authentication of monoglyceride and triglyceride mixture using infrared spectrophotometry.
About 1-2 mg of sample was mixed with dry potassium bromide (KBr) and the samples were examined at transmission mode with resolution of 4 cm-1 over wave number range of 4000 to 400 cm-1. The instrument was operated under dry air purge and the scans were collected at scanning speed of 2 mm/sec. These spectra were compared with the freshly prepared sample mixtures and any apparent changes were recorded.
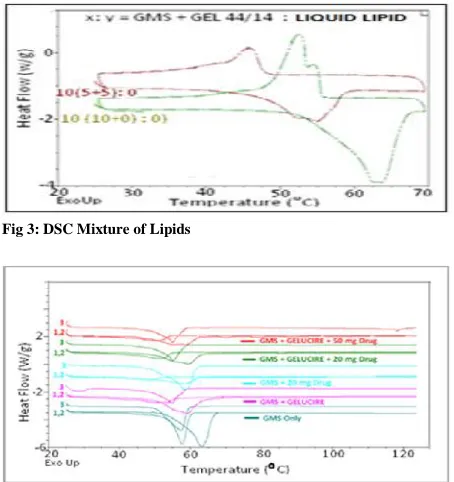
D. Differential Scanning Calorimetry20
Differential Scanning Calorimetry (DSC) was employed to reveal the thermal behaviours of blending 2 lipids viz. monoglyceride (solid lipid GMS) and triglyceride mixture (semi-solid Gelucire 44/14) with drug EFZ. The thermal events for 3 heating and cooling cycles before and after tempering were recorded. Different levels of EFZ (2, 20 and 50 mg) were incorporated so as to gain insight about the maximum drug loading that could be obtained into the lipids. These characteristics were compared with the native spectra of the raw materials, lipids and API.
Analysis was performed under nitrogen purge (50 ml/min). The samples were accurately weighed (2 mg) and analyzed into 20 µl T zero hermetic pans (standard) and an empty pan was used as reference. Data were evaluated from the peak areas and DSC parameters, such as temperature onset, maximum peak and enthalpy were calculated using the inbuilt advantage DSC Q20 V24.10 Build 122 software (TA Instruments, USA).
2.3 Formulation
A. Hot High Pressure Homogenization21, 22
Lipids (Solid lipid Dynasan 114 or GMS, semisolid lipid -Gelucire 44/14 and liquid lipid - Miglyol; 80°C) were melted on a hot plate and EFZ (25 mg) was added into the mix. The hot molten lipid phase was added into an aqueous surfactant solution of (6.7% w/v) P80 at same temperature, and an emulsion was prepared using a high-speed homogenizer (PT 1600 E, kinematics) for 10 min. at 15000 rpm. It was immediately poured in bulk chilled water (4°C) to produce nanoparticles. The dispersion was then passed through a high pressure homogenizer (HPH) [GEA Niro Soavi Panda (Italy)] for further size reduction at a pressure ranging till 1000bar upto 40-45 cycles. A water bath adjusted to 18°C was used to control the cooling rate (12 hrs) and SLN solidification.
B. Particle Size determination23
The nanodispersion obtained after HPH was diluted 10 times, upto 2 ml with MilliQ water (to prevent back-scattering effect) vortexed (CM 101 cyclomixer, REMI) and sonicated (UCB-30, Spectralab bath sonicator) for 7 min. in a water bath. The average diameter and polydispersity index (pdI) of SLN were measured on Zetasizer Nano ZS90 (Malvern, UK) using photon correlation spectroscopy (PCS). The measurements were obtained at an angle of 173°C at 25°C.
C. Stability studies24
A set of these formulations blank and drug loaded each were characterized for avg. size and PDI after a storage of 6 months and compared with the results immediately after fabrication. Simultaneously, drug–excipients compatibility studies were also undertaken to ascertain the likelihood of interaction.
D. Plackett-Burman Design and Optimization25, 26
To optimize the formulation process using HPH, a total of 12 formulations with different proportion and degree of 11 factors at 2-levels were investigated using Plackett-Burman design (semi-orthogonal). To conclude the main variables affecting formulation characteristic of average particle size and PDI, analysis of variance (ANOVA, 95% confidence level) was conducted. Polynomial equations were generated for these variables and lack of fit was tested. The data were treated using Design Expert 8 software. Table 1 lists the coded factors and their corresponding two levels for Plackett-Burman design, and Table 2 shows the formulations prepared with the responses or critical process parameters
(CPPs). Table 3 and 4 list the modified 11 factor 3 level coded design for the post-hoc test.
To visually detect outliers, half-normal plots are constructed. The half-normal plot is a graphical tool used to help identify which experiment factors have significant effects on the response.
E. Statistical analysis29
The Plackett-Burman design was further modified into 11 factors with 3 levels each and analyzed using one-way ANOVA followed by post-hoc Tukey HSD test. Post-hoc test was used for pair-wise comparison of the individual factor-levels (α = 0.1) in-order to find out the most significant of 3 sub-levels (SPSS17).
If and when the assumptions of one-way ANOVA are not met, a nonparametric (distribution free) Kruskal-Wallis testis utilized to determine the variable’s influence. Both the Kruskal-Wallis test and one-way ANOVA assess for significant differences on a continuous dependent variable by a categorical independent variable (with two or more groups). Once a significant effect is found, post-hoc tests are run to confirm where the differences occur between groups. One such test is Tukey’s HSD (Honestly significance difference) test.
In the design and analysis of experiments, post hoc analysis (from Latin post hoc, "after this") consists of looking at the data—after the experiment has concluded— for patterns that were not specified a priori. In practice, post hoc analyses are usually concerned with finding patterns and/or relationships between subgroups of sampled populations that would otherwise remain undetected and undiscovered were a scientific community to rely strictly upon a priori statistical methods. Post hoc tests—also known as a posteriori tests—greatly expand the range and capability of methods that can be applied in exploratory research. Post hoc analysis is an important procedure without which multivariate hypothesis testing would greatly suffer, rendering the chances of discovering false positives unacceptably high. Post-hoc tests thus pinpoint to annotate the findings of multivariate annova and are useful to perform additional comparisons of subsets of the group means.
3. RESULTS AND DISCUSSION
3.1 Analytical Method Development And Validation14, 15
3.2 Preformulation 3.21 Solubility
All stabilizers improved the solubility (s) of EFZ. Gelucire (s1= 1.39 mg/ml) acts as surface active agents and increases
solubility of poorly soluble drugs via micellization. Appropriate surface modification by PEGylated triglycerides of Gelucire[30]is helpful in improving the circulation life of the dosage form. PEG (s2= 14.17 µ g/ml) is known to be a
cosolvent that displaces air from drugs surface and serves as wetting agent. P80 (s3= 5.48 µ g/ml) is a hydrophilic
surfactant. It solubilizes the drug by reducing contact angle and interfacial tension. It is also known to inhibit drug expulsion by intracellular efflux transporters.
3.22 Partition Coefficient Determination18, 19
For a binary system of aqueous and organic phases, the experimental LogP(exp.) values estimated for partitioning of efavirenz were lower than the LogP(lit.) reported in literature. The LogP(exp) was calculated to be 1.36 for Benzene-Phosphate buffer system (a) and 1.12 for IPM (isopropylmyristate)-Phosphate buffer system (b). The LogP (lit.) value is 3.68-4.6.The LogP(lit.) is the estimation in-case of biological membranes or 1 - octanol (organic phase).
3.23 FTIR Spectroscopy
Most of the bands of raw lipids are retained in FTIR spectra for mixture of GMS and Gelucire 44/14. [Fig 2]Although there is slight deflection in peak position with narrowing or broadening of peaks in comparison to the native spectra of GMS. The prominent bands in the mixture include 3543.23, O-H (H-bonded, broad) str, 2937.59, CH3, CH2& CH
(alkanes) (str), 2662.36, (H-bonded acids) overlap CH, COOH and derivatives, O-H (sharp) str, 1749.44 C=O (esters) str, 1641.42 C=C str Ar-C, 1471.69 CH2& CH3
deformation (bend), 1396.46 O-H (bend, in-plane), 1197.79 C-O (str) and 769.60 O-H (bend, out of plane). The bands for native lipids are depicted in Table 6.
3.24 DSC Characterization19-20, 31
Imwitor 900P is Glyceryl monostearate (GMS), a mixture of glyceryl esters of fatty acids.It is composed of glyceryl monostearate (65%), glyceryl monopalmitate (30%) and glyceryl monomyristate (5%). It is reported that the polymorphic GMS exists in four crystal forms. Rapid cooling of melted GMS yields the α-form, which is successively transformed to the β-form (stable) via the β' -form (metastable) under ambient conditions.
The heating endotherm of GMS-only suggests the presence of stable β polymorph predominantly with only a minor deflection (broad peak). [Fig3] [Table 7] The DSC cooling curve for GMS only (10(10+0):0], clearly displays the crystallization of 2 polymorphs. These are supposedly the metastable β’ and unstable α form. This is suggestive of phase transition in the original lipid during heating. However, when the solid lipid GMS is substituted with semisolid Gelucire, the heating endotherm is obtained at a lower temperature than the GMS only heating curve and at the same position as that of GMS-only cooling curve. The
cooling curve of Gelucire substituted GMS shifts further backwards indicating the presence of sub-α form.
The first heating curve revealed a melting point at around 63.28˚C, corresponding to the melting point of β-form of GMS. The frozen GMS was heated again (second cycle) in the DSC, and the melting point was reduced from 63.28˚C to 57.70˚C which corresponds to the α-form. The addition of Gelucire 44/14 to consolidate the solid matrix did not affect the melting points of GMS during first heating [Table 7] because of the un-even mixing of solid GMS and semi-solid waxy Gelucire 44/14; however, the freezing points during cooling (48.05˚C to 42.56˚C) and the melting points of GMS during the second heating (57.70˚C to 51.51˚C) were decreased significantly. Here the semi-solid Gelucire has fully impregnated the gaps and crevices of solid lipid and diluted its matrix integrity32, 33. The third cycle of heating after 1h of tempering led to slight increase in melting temp. (58.76˚C - GMS only and 54.84˚C- GMS + Gel44/14) compared to second heating cycle but still less than the first cycle.
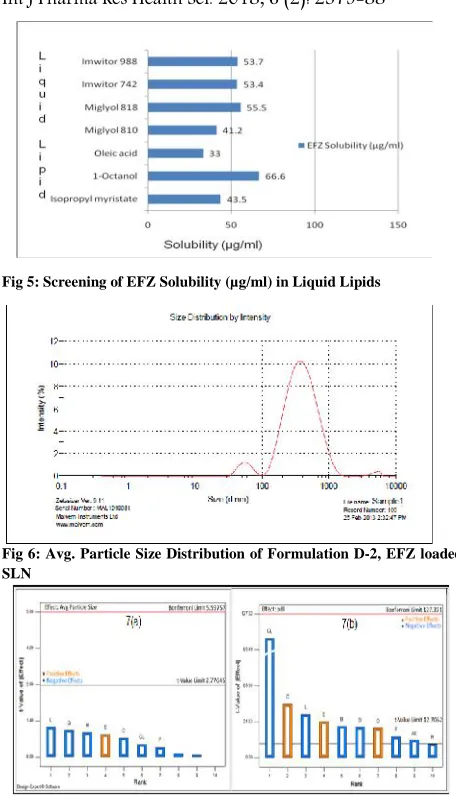
Different levels of EFZ were incorporated (2, 20 & 50 mg) in the binary mixtures contributed to 0.4%, 4.7% and 11.1% w/w.[Fig4] [Table 7] The effect of loading of drug (20 mg EFZ) into GMS alone had a great impact on the first two heating cycles (58.61˚C and 48.54˚C) in which the melting points were depressed further below the original values. When drug (20 mg) is introduced into the GMS (solid lipid) and Gelucire 44/14 (semi-solid lipid) mixture, there is no significant change observed in comparison to GMS and Gelucire mixture. This suggests that drug is solubilizing in Gelucire in the matrix and not solid lipid.34-36Also, that here drug exerts no influence; only addition of Gelucire has marked effect. Increasing drug loading (50 mg) has only a slight effect on melting and enthalpy values. The enthalpy values for the first two cycles are also higher than the mixture with GMS and drug only and no Gelucire. This indicates that drug has a greater impact on solid lipid when present alone than when present along-with Gelucire. The enthalpy values for the third heating cycle are lower for drug + Gelucire combinations than drug alone (76.86˚C and 79.22˚C vs. 150.9˚C) indicating greater and longer solubility of the drug with diminished expulsion and hence greater stability. Thus, the binary mix of GMS and Gelucire is favorable for higher drug loading into lipid formulation. 3.26 Liquid Lipid Screening27, 28
3.3 Formulation Development
3.31 Formulation using High Pressure Homogenization (HPH)23, 24
A set of twelve formulations D1-D12 were fabricated using high pressure homogenization for the drug EFZ. [Table 1 & 2] Two types of solid lipids (matrix) were used in this method viz. a monoglyceride GMS (Imwitor) and a triglyceride Dynasan 114. It was seen that formulations with a single lipid were not consistent in size and pdI and thus apparently a blend of both the lipids looked good for SLNs with avg. size around 250 nm and pdI near 0.100.Use of semi-solid Gelucire eased emulsification and imparted stability. For NLCs GMS alone gave a satisfactory output with size around 200 nm and pdI of 0.200. Miglyol proved to be a better liquid lipid than mineral oil. Incorporation of P80 as surfactant improved the pdI although the results were more prominent for Dynasan than GMS.
3.32 Formulation Stability23, 37
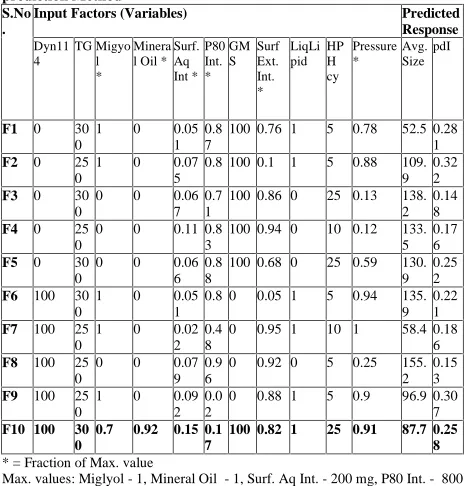
The drug loaded SLN formulations retained their size for nearly 6 months with 280.3 nm and a pdI of 0.201 from 0.136 (Day0). [Fig 6][Table 8]
It was confirmed that the presence of excipients does affect the UV absorption of the active ingredient (drug). The influence is clearly depicted in the calibration plots constructed.[Fig 1]
3.33 Plackett-Burman Design and Optimization25, 37-39
The basic polynomial equation for the designed mathematical model is:
Y = b0 + b1a+ b2b + b3c + b4d + b5e + b6f + b7g + b8h + b9ij + b10kl
where,Y represents the measured response while level of independent factors are symbolized as a to l. b1to b10are the
coefficients of factors respectively. The value of b0 is the
intercept which represents the arithmetic mean of design outcomes. The values of intercept and coefficient values were deduced according to the software algorithm. Positive coefficients show a direct and favorable relationship with the response and negative ones depict an inverse effect.
The regression equation (p ≤ 0.05) for Plackett-Burman design of EFZ loaded SLNs 40 and NLCs41[Table1 & 2] using DesignExpert8 is as follows:
Avg. particle size = + 175.65 - 22.76 * Miglyol + 35.36 * Surf Aq Int - 16.54 * P80 Int. - 27.27 * GMS - 45.75 * Surf Ext. Int. - 35.61 * Pressure - 15.44 * Miglyol * Pressure But the model is not significant for particle size with F = 0.76 and R2= 67.1%.
pdI = + 0.49 - 0.067 * TG + 0.10 * Miglyol - 0.058 * Mineral Oil + 0.11 * Surf Aq Int. - 0.046 * P80 Int. + 0.057 * GMS - 0.031 * Surf Ext Int - 0.068 * Pressure - 0.026 * Dyn114 * Surf Aq Int - 0.19 * Miglyol * Pressure
The model is significant for pdI with p-value = 0.013, F = 3635.43 and adjusted R2= 99.7%.
3.34 Statistical Analysis29
Adequate precision (signal to noise ratio) for the Plackett-Burman (low-resolution) design is found to be 4.34 (avg.
size) and 229.3 (pdI) which are both desirable. It is defined as a signal to noise ratio or S/N ratio greater than 4. Subsequently, the obtained ratio shows an adequate signal. From the polynomial equations generated, although pressure and liquid lipid Miglyol were significant input factors but HPH cycle did not seem to be important in formulation. Pareto charts [Fig 7(a & b)]show that Miglyol and GMS have a positive effect on pdI whereas surfactant in internal aqueous phase (SurfAqInt) has a positive effect on both avg. size and pdI. For avg. size the model has insignificant lack of fit. %CV was 35.45 for avg. size and 0.93 for pdI. There is a 40% probability for both size to be below 200 nm and pdI to be less than 0.3 using the HPH method. [Fig 8 (a & b)]Since the number of observations was less, ANOVA could not define the model efficiently taking all the factors together. Further influence of each independent variable was tested individually against the outcomes avg. particle size and PDI using the non parametric Kruskal-Wallis test with 95% confidence level (Minitab14).
Kruskal-Wallis test cleared the ANOVA bias (low R2) and found the lipids (Dyn114, TG, GMS) (p = 0.069), Liq Lipid (p = 0.089) and HPH cycle (p = 0.089) as the crucial variables for size. A blend of GMS-Gelucire, liquid lipid Miglyol, Surfactants and Pressure were the key variables for pdI (p-value = 0.013, F = 3635.43 and adjusted R2= 99.7%). For a modified 5 factor 3 level (high-resolution) design, post-hoc Tukey HSD analysis was conducted. [Table 3 & 4]As a result, Surf IPEI (internal phase, P80, external-internal phase) was found to be significant for avg. particle size. HPHcy and Pressure were found to be significant for pdI. For avg. particle size, surfactant in both the internal and external phase was the most favourable (p = 0.078) sub-level, followed by surfactant in the internal phase (p = 0.084) and P80 alone. For pdI, 5 HPH cycles were more significant than 20 (p = 0.086) and 45 cycles (p = 0.059) and 900 bar pressure was more significant than 250 bar (p = 0.037) and 600 bar (p = 0.052).
The number of cycles has not had a remarkable effect on particle size of SLNs when milled at a constant pressure of 250 bar. For NLCs formulation, HPH doesn’t seem to play an effective role beyond 5 cycles in size reduction.
These findings are further corroborated in half normal plots. [Fig 9 (a & b)] A half-normal plot is a graphical tool to discern active contributors from inert ones in a factorial experiment. It compares the relative strength of various effects in the experiment. In such a illustration, the points comprising factors with small and/or insignificant effects on the response will describe (roughly) a straight line on the plot whereas the points for factors with a 'large' and significant effects will visually fall off of the straight line. A red line through the insignificant factors helps to graphically delineate the difference between significant and insignificant factors.
on avg. particle size whereas Pressure, Surf ExtInt, GMS90, Miglyol, polysorbate80 and triglyceride TG exercise a negative role [Fig 9(a)].Since a small size is desirable, the factors with negative influence are good. The interaction of pressure and Miglyol also diminishes size reasonably. Similarly, a low pdI is required for content uniformity. Thus, Miglyol and SurfAqInt have positive influence on pdI and pressure, triglyceride, mineral oil, P80Int and SurfExt Int have a negative influence [Fig 9(b)].The interaction of Dyn114 and Surf Aq Int also decreases pdI, which is beneficial. These findings are in good agreement with one-way ANOVA and post-hoc tests.
3.35 Optimized Formulation25-26, 37-39
A locus of points was imagined from the boundaries of influence covered by the Plackett-Burman design. All formulations derived from this area would possess the intended features and this method is termed as optimization. A set of ten optimized formulations viz. F1-F10 along-with their predicted responses for avg. size and pdI were generated using the point prediction function of Design Expert (DX8, StatEase) and assayed further for drug loading (LD), total drug content (TDC) and percent drug entrapment efficiency (%EE). [Table 9]
In this process, the target value of avg. particle size was kept below 200 nm and a pdI below 0.35. Keeping this in view, the best formulations were picked from the output after several permutation-combinations of the input variables. In composition, migyol, mineral oil, SurfAqInt, P80, SurfExtInt. and Pressure were expressed as fraction of their maximum values. It can be inferred from the shortlisted formulations that presence of liquid lipid leads to smaller particle size. Hence, NLCs would be a better bargain than SLNs. GMS was more favoured over Dyn114 for NLC constitution, that too at low HPH cycles. Miglyol was preferred over Mineral oil as inferred from the results of low resolution design. It was also ascertained that both internal and external surfactants are necessary for the desired output and longer HPH circulation (25 cycles) worked considerably good at low pressures to give favorable characteristics. Of the ten optimized formulations envisioned; F-2, NLC with Miglyol was found to contain the maximum drug with %EE of 37%, TDC of 45% and LD of 25%. The predicted avg. size 109.9 nm and pdI 0.322 were fairly close to the experimental values of 105.3 nm and pdI of 0.293. [Table9]
4. CONCLUSION
Efavirenz was formulated as SLN and NLCs. Preformulation studies of Solublity, FTIR, LogP, DSC and stability encouraged its packaging into lipid nanoparticles. Plackett-Burman design was successful in identifying that (Dyn114, TG, GMS), LiqLipid and HPH cycle were the main factors for average particle size and GMS-Gelucire, liquid lipid Miglyol, Surfactants and Pressure were the main factors for pdI. Kruskal-Wallis test overcame the shortcomings of multivariate ANOVA and paved way for deliberation of the
sublevels. Thus, surfactant both in the internal and external phase, 5 HPH cycles and 900 bar Pressure were the most significant levels for the main factors as determined by Tukey HSD test. NLC F-2 was deduced to be the best of all point-prediction optimized formulations with max. Drug loading and predicted outcomes of avg. particle size and pdI close-to the actual ones.
List of Figures
Fig 1: Drug - Excipient Compatibility Studies in CHCl3
Fig 2: FTIR Spectrum of Solid Lipid, Semi- solid Lipid and their Mixture
Fig 3: DSC Mixture of Lipids
Fig 5: Screening of EFZ Solubility (µg/ml) in Liquid Lipids
Fig 6: Avg. Particle Size Distribution of Formulation D-2, EFZ loaded SLN
Fig 7(a & b): Probability Plot for Avg. Particle size (a) and pdI (b) of SLN-NLC using HPH
Fig 8 (a & b): Probability Plot for Avg. Particle size and pdI of SLN-NLC using HPH
Fig 9(a & b): Half Normal Probability Plot for Plackett-Burman Design depicting avg. particle size and pdI
Table 1: The coded input variables of the Plackett-Burman design
No. Factor Name Level
High Low
1 Solid Lipid - Dynasan 114 200 0
2 Triglyceride - TG 400 200
3 Solid Lipid - Glycerylmonostearate - GMS200 0
4 Miglyol 50 0
5 Mineral Oil 50 0
6 Surfactant in Aqueous Internal Phase 1 (Yes) 0 (No)
7 Polysorbate 80 Internal 800 0
8 Surfactant in both External + Internal Phase
1 (Yes) 0 (No)
9 Liquid Lipid 1 (Yes) -1 (No)
10 HPH cycles 5 45
11 Pressure (bar) 250 (Yes) 900 (No)
Table 2: The EFZ - SLN & NLC formulations prepared via HPH with responses or critical process parameters (CPPs)
Ru n
A: B: C: D: E: F: G: H: J: K: L: Avg . Size
pdI
Dyn 114
TG Migly ol
Miner al Oil
SurfAqI nt
P80I nt
GMS9 0
SurfExtI nt
LiqLipi d
HP H cy
P (bar )
D1 0 200 50 0 0 0 200 0 1 5 250 203. 6
0.19 2
D2 200 400 0 0 0 0 0 0 -1 45 250 268 0.13 6
D3 0 200 0 50 0 0 200 0 1 5 250 213. 3
0.21 6
D4 200 400 0 0 1 800 0 1 -1 45 250 216. 2
0.25 8
D5 0 200 50 0 0 0 200 0 1 5 900 101. 5
0.40 3
D6 200 400 0 0 1 0 0 0 -1 45 250 343. 5
0.41 1
D7 0 200 0 50 0 0 200 0 1 5 900 177. 9
0.45 5
D8 200 400 0 0 1 0 0 1 -1 45 250 252 0.35
D9 0 200 0 0 1 800 200 1 -1 45 250 167. 1
0.55 8
D1 0
0 200 0 0 0 0 200 0 -1 45 250 315. 6
0.33
D1 1
0 200 0 0 0 0 0 0 -1 45 250 280. 3
0.21 9
D1 2
0 200 0 0 0 0 200 0 -1 45 250 123. 1
0.33 5
Table 3: Coded Factors with three levels
Table 4: Modified 11 Factors with 3 level each design for Tukey HSD Analysis
S.No. GelDynGM MigMin SurfIPEI HPHcy Pressure Avg. Size
PDI
1 1 1 0 5 250 203.6 0.19
2 -1 0 0 45 250 268 0.14
3 1 -1 0 5 250 213.3 0.22
4 -1 0 1 45 250 216.2 0.26
5 1 1 0 5 600 101.5 0.4
6 -1 0 -1 45 250 343.5 0.41
7 1 -1 0 5 900 177.9 0.46
S.N. Factors Composition Coded Levels (Real Values)
-1 0 +1
1 DynGelGM Dynasan, Gelucire 44/14, GMS
-1, 0, 1 Dyn114 Gel GM
2 MigMin Migyol, MineralOil 1, 0, -1 Mig 0 Min 3 SurfIPEI Surf- IntPhase, P80,
ExtPhase
-1, 0, +1 SurfInt P80 SurfExt
4 HPHcy HPH cycle 5, 20, 45 5 20 45
5 Pressure P (bar) 250, 600, 900
8 -1 0 -1 45 250 252 0.35
9 1 0 1 45 250 167.1 0.56
10 1 0 0 45 250 315.6 0.33
11 0 0 -1 45 250 280.3 0.22
12 1 0 0 45 250 123.1 0.34
13 1 1 -1 20 600 237.5 0.49
14 1 -1 -1 20 600 354.1 0.81
15 1 -1 -1 20 900 218.9 0.47
16 0 1 1 5 600 180 0.35
17 0 -1 1 20 900 248 0.39
Table 5: Analytical Method Development And Validation: Optical Characteristics of Efavirenz (EFZ)
Drug Solventλmax
(nm)
range*Y*=mx+cR2* ε* s* m* c* LOD*LOQ*
EFZ CH3OH246.8
20-Apr0.0531x-0.0191
0.99921.62 x 104
1.95 x 10
-2
0.053 0.02 0.323 0.979
EFZ CHCl3 251.3 24-Jun 0.0284x+
0.0648
0.99611.06 x 104
2.99 x 10 -2
0.028 0.065 1.408 4.27
EFZ 1% SLS
245.9 12-Feb 0.0618x-0.0384
0.99671.72 x 104
1.84 x 10 -2
0.062 0.038 0.73 2.21
*Beer law of limit (µg/ml) as range Sandell’s sensitivity (s)
(µg/cm2
-0.001 absorbance units) as s Correlation coefficient as R2
Limits of quantitation as LOQ Molar extinction coefficient
(lit.mole-1
.cm-1
) as ε Slope as m
Limits of detection as LOD Regression Equation as Y*=mx+c; c= conc. (µg/ml), Y = absorbance Intercept as c
Table 6: Identification of Functional Groups of native Lipids in FTIR Components Functional groups and wave number (cm-1
) Gelucire 44/14 2922, 2879(C-H str), 1741(C=O str), 1355,
1280, 1172, 1114(C-O str), 1467(C-H vib), 1117(C-O str)
GMS 3310.95(O-H str), 2919.39(C-H str), 1650.90(C=O str), 1062.82, 1047.39(C-O-C str), 719 (cis RCH=CHR),
Table 7: DSC Thermograms For Solid And Liquid Lipid Combinations
S. No .
[Code] Composition - mg Onset Temp Meltin g Peak Peak Width ∆H J/g
[Solid + Semi-solid Lipid(GMS+Gel44/14):Li q lipid]
HEATING CYCLE (MELTING) - Forward 1 [10(10+0):0
]
[400(400+0):0] 48.58˚C 63.62˚C 15.04˚C186.6˚C
2 [10(5+5):0] [400(200+200):0] 35.87˚C 54.95˚C 19.08˚C92.96˚C
COOLING CYCLE (RECRYSTALLIZATION) - Backward
1 [10(10+0):0 ]
[400(400+0):0] 56 52.48 3.52 114.7
2 [10(5+5):0] [400(200+200):0] 49.66 45.83 3.83 56.65
Table 8: Stability study via zeta size determination of SLN*D-2 Formulation D Avg. Size (nm) pdI kcps
(Day 0)
*D-2 (Blank) 267.9 nm 0.148 252.9
*D-2 (Loaded) 268.9 nm 0.13 191.6
(After 10 mths)
*D-2 (Blank) 247.8 0.209 338.8
*D-2 (EFZ Loaded) 302.8 [Fig 6] 0.293 270.1
*Composition SLN D-2 [Dyn114:TG (1:2), 45 HPH cycles]
Table 9: Predicted Responses for Optimized formulations via Point prediction Method
S.No .
Input Factors (Variables) Predicted Response Dyn11 4 TG Migyo l * Minera l Oil *
Surf. Aq Int * P80 Int. * GM S Surf Ext. Int. * LiqLi pid HP H cy Pressure * Avg. Size pdI
F1 0 30 0
1 0 0.05
1 0.8 7
100 0.76 1 5 0.78 52.5 0.28 1 F2 0 25
0
1 0 0.07
5
0.8 100 0.1 1 5 0.88 109. 9
0.32 2 F3 0 30
0
0 0 0.06
7 0.7 1
100 0.86 0 25 0.13 138. 2
0.14 8 F4 0 25
0
0 0 0.11 0.8 3
100 0.94 0 10 0.12 133. 5
0.17 6 F5 0 30
0
0 0 0.06
6 0.8 8
100 0.68 0 25 0.59 130. 9
0.25 2 F6 100 30
0
1 0 0.05
1
0.8 0 0.05 1 5 0.94 135. 9
0.22 1 F7 100 25
0
1 0 0.02
2 0.4 8
0 0.95 1 10 1 58.4 0.18 6 F8 100 25
0
0 0 0.07
9 0.9 6
0 0.92 0 5 0.25 155. 2
0.15 3 F9 100 25
0
1 0 0.09
2 0.0 2
0 0.88 1 5 0.9 96.9 0.30 7 F10 100 30
0
0.7 0.92 0.15 0.1 7
100 0.82 1 25 0.91 87.7 0.25 8 * = Fraction of Max. value
Max. values: Miglyol - 1, Mineral Oil - 1, Surf. Aq Int. - 200 mg, P80 Int. - 800 mg, Pressure - 900 mg
5. ACKNOWLEDGEMENTS
The author wish to acknowledge CSIR (EMR-I), New Delhi, India for supporting this research work through senior
research fellowship SRF (2012)(Ref. No.
09/832(0013)/2012-EMR-I. I also acknowledge the generous gift sample of API Efavirenz from Ranbaxy Laboratories Ltd. (Gurgaon, India) and excipient Gelucire 44/14 from M/S Gattefosse SAS (France).
6. REFERENCES
1. https://www.drugbank.ca/drugd/DB00625 accessed on 17th feb 2018.
2. http://www.antimicrobe.org/drugpopup/efavirenz.htm accessed on 17th feb 2018.
3. Moazen E et al: Enhancement of oral bioavailability of pentoxyfylline by solid lipid nanoparticles. J. Lip. Res. 2010; 20(2): 115-123.
4. Trevaskis NL et al: Lipid-based delivery systems and intestinal lymphatic drug transport. Advanced Drug Delivery Reviews 2008; 60: 702–716.
5. Fricker G et al: Phospholipids and lipid-based formulations in oral drug delivery. Pharmaceutical Research 2010; 27(8): 1469-1486.
6. Vyas TK et al: Nanoparticulate drug carriers for delivery of HIV/AIDS therapy to viral reservoir sites. Expert Opinion on Drug Delivery 2006; 3(5).
7. Yener G et al: Importance of solid lipid nanoparticles (SLN) in various administration routes and future. Int. J. Nanomed 2007; 2(3): 289-300 .
9.
http://www.pharmainfo.net/reviews/gelucires-pharmaceutical-applications accessed on 17th feb 2018. 10. http://www.warnergraham.com/images/Imwitor900P90
0K960K.pdf accessed on 17th feb 2018.
11. http://lipidbank.jp/cgibin/detail.cgi?id=WWA2201 accessed on 17th feb 2018.
12. http://www.warnergraham.com/images/DynasanProdInf o.pdf accessed on 17th feb 2018.
13. Magdassi S et al: Chapter-18 Applications of Surfactants in Pharmaceutical Dosage Forms. Handbook of Detergents: Part E: Applications, Taylor and Francis Group, LLC 2009.
14. Kamlesh D3 N et al: Spectrophotometric Estimation of Efavirenz in Formulation and Biological Fluid. Int. J. Res. Pharm. Sci. 2010; 23: 402-406.
15. OECD, Paris, 1981, Test Guideline 107, Decision of the Council C(81) 30 final. [Official Journal of European Communities, Dir 92/69/EEC (O.J. L383 A)]
16. Pardeike J et al: Development of an Itraconazole-loaded nanostructured lipid carrier (NLC) formulation for pulmonary application. Int. J. Pharm 2011; 1:10. 17. Akhtar Naseem et al: Self-Nanoemulsifying lipid carrier
system for enhancement oral bioavailability of Etoposide by P-glycoprotein modulation: In vitro cell line and in vivo pharmacokinetic investigation. J. Biomed. Nanotechnol. 2013; 9: 1-14.
18. Mostafavi SA et al: Comparison of automated continuous flow method with shake- flask method in determining partition coefficients of bidentate hydroxypyridinone ligands. DARU 2003; 1-3.
19. Martinez F et al: Thermodynamics of partitioning and solvation of ketoprofen in someorganic solvent/buffer and liposome systems. Brazilian Journal of Pharmaaceutical Sciences 2006; 23: 602-604.
20. Almeida EDP: Preparation and characterization of chloroaluminum phthalocyanine-loaded solid lipid nanoparticles by thermal analysis and powder X-ray diffraction techniques. J. Therm. Anal. Calorim. 2012; 108:191-196.
21. Mäder K et al: Solid lipid nanoparticles: production, characterization and applications. Adv. Drug. Deliv. Rev 2001; 47 (2-3): 165–196.
22. Walker RB et al: Evaluation of the in vitro differential protein adsorption patterns of didanosine-loaded nanostructured lipid carriers (NLCs) for potential targeting to the brain. Journal of Liposome Research, 1-10 (2011)
23. Keck CM et al: Preservation of Nanostructure lipid carriers. European Journal of Pharmaceutics and Biopharmaceutics 2010; 2: 12.
24. Mueller RH et al: Lipid nanocarriers for dermal delivery of lutein: Preparation, characterization, stability and performance. International Journal of Pharmaceutics, 2011; 45: 267-275.
25. Talegaonkar S et al: A logical approach to optimize the nanostructured lipid carrier system of irinotecan: efficient hybrid design methodology, Nanotechnology 2013; 24:1.
26. Martins S et al: Multivariate design for the evaluation of lipid and surfactant composition effect for optimization of lipid nanoparticles. Eur. J. Pharm. Sci 2012; 45; 613-624.
27. Gohla S H et al: Characterisation of novel SLN carrier system based on binary mixtures of liquid and solid lipids. Int. J. Pharm. 2000; 199(2); 167.
28. Egito EST et al: Development of oil-in-water microemulsions for the oral delivery of amphotericin B. Int. J. Pharm 2013; 454: 641-648.
29. Brown AM et al: A new software for carrying out one-way ANOVA post hoc tests. Computer Methods and Programs in Biomedicine 2005; 79: 89-95.
30. Keck CM et al: Polyhydroxy surfactants for the formulation of lipid nanoparticles (SLN and NLC): Effects on size, physical stability and particle matrix structure. International Journal of Pharmaceutics 2011; 163-172.
31. Murthy RSR et al: Etoposide-Loaded Nanoparticles Made from Glyceride Lipids: Formulation, Characterization, in Vitro Drug Release, and Stability Evaluation. AAPS PharmSciTech 2005; E158-166 32. Guerrero DQ et al: Preparation and characterization of
solid lipid nanoparticles containing cyclosporine by the emulsification-diffusion method. Int J Nanomed. 2010; 5: 611-620.
33. Paradkar AR et al: Study on Mechanism for Amorphous Drug Stabilization Using Gelucire 50/13. Chem. Pharm. Bull 2009; 57(9): 937–942.
34. Prabhakar V et al: Solubility enhancement and physicochemical characterization of carvedilol solid dispersion with Gelucire 50/13. Arch. Pharm. Res. 2011; 34(1): 51-57.
35. Paradkar A et al: Preparation and Characterization of Etoricoxib Solid Dispersions Using Lipid Carriers by Spray Drying Technique. AAPS PharmSciTech, Article 2005; 50: 6(3), E405-412.
36. Marchetti JM et al: Solid Dispersions of Ursolic Acid in Gelucire 50/13: a Strategy to Enhance Drug Release and Trypanocidal Activity. AAPS PharmSciTech, 2012; 13(4), 1436-1445.
37. Kim Jo et al: Effect of formulation variables on the particle size and drug encapsulation of Imatinib-loaded Solid lipid nanoparticles, AAPS PharmSciTech (2015) 38. Dorkoosh FA et al: Development of acid-resistant
alginate/trimethyl chitosan nanoparticles containing cationic β-cyclodextrin polymers for Insulin oral delivery, AAPS PharmSciTech 2015; 16(4): 952-62. 39. Sawant K et al: A QbD concept in Lipid based
screening design and optimization using response surface methodology, J Nanomed Nanotech 2017; 8: 3 40. Attama AA. et al: Lipid nanoparticulate drug delivery
systems: a revolution in dosage form design and development. Chapter- 5.
41. Mohanta GP et al: Design and evaluation of miconazole nitrate loaded nanostructured (NLC) for improving the antifungal therapy. J. App. Pharm. Sci 2013; 3(01): 046-054.
Conflict of Interest: None