Page 1 www.ijiras.com | Email: [email protected]
Relationship Between Non Performing Loans And Financial
Performance Of The Banking Sector: A Case Of Equity Bank
Kenneth Kipyego Toroitich
PhD Student, Jomo Kenyatta University of Agriculture and Technology, Eldoret-Kenya
Dr. Omwono, Gedion A.
Lecturer, Catholic University of Eastern Africa
I. INTRODUCTION A. BACKGROUND TO THE PROBLEM
A strong financial system is very important for a country to flourish. The deterioration of bank‟s loan portfolio has been the centre of episodes of costly banking system distress and economic crises in both developing and advanced economies such the Unites States of America (USA). It‟s devastating effects, as well at its origination from a sharp increase of Mortgage loan defaults in the USA, underscore the linkages between financial and macro economic shocks and have renewed interest in the relationship between Credit market frictions and the risk of financial stability (Mwanza & Nkusu,2011).
The economic progress of a nation and development of banking is invariably interrelated. The Banking sector is an
indispensable financial service sector supporting development plans through channelizing funds for productive purpose, intermediating flow of funds from surplus to deficit units and supporting financial and economic policies of government. The importance of bank‟s stability in a developing economy is noteworthy as any distress affects the development plans (Rajaraman & Vasishtha, 2002) thereby the economic progress (Thiagarajan, et al, 2011).In 2009, asset quality in emerging markets also deteriorated and the growth rate of NPL was at around 40% somewhat lower than in the advanced economies where average NPL ratios increased in 2009 by around 60% (European Central Bank Report, 2013).
In Germany, while some of the bank‟s have achieved significant reductions in their levels of NPLs and loan 90 days past due, they have been achieved at (what appears to be) a slower pace that what we are seeing at either the UK or US. Indeed one compares, German deleveraging rate to Lloyds
Abstract: This study aimed at examining the relationship between non-performing loans and the Financial Performance of Equity Bank (K) ltd, Eldoret Town. The study adopted a correlation research design. This study employed census in selecting the respondents. Both primary and secondary data were as a source of information and questionnaire was used as the main instrument, while Secondary data was extracted from the Bank’s financial reports for the period ending 31st December each year to establish the trend of the NPLs, from year 2008-2014. Content analysis was employed to analyze the qualitative data collected while a descriptive method was used to analyze quantitative data. The data was processed using SPSS 21 and the processed data was presented in tables, graphs and explanation given in prose. The findings found that when the non-performing loans increased, the performances of equity bank branches were affected negatively. This is shown in the regression line where PAR has a negative coefficient. It means that when the PAR increases, EAT decreases significantly, relationship between operating loan book, and financial performance of Equity bank in Eldoret town. The study recommends that the credit department staff should have higher loan targets as this contributes significantly to the profits of the bank. The study further recommends that the non-performing loans should be kept at minimum. This can be done by ensuring that the credit officers understand their duties and obligation clearly. The credit staff should be trained on how to monitor loans to ensure that defaults are kept at a minimum.
Page 2 www.ijiras.com | Email: [email protected] Banking Group where GBP 4.1 billion of non-core
commercial real estate exposure was shed in the first three months of 2012) completed GBP 5.6billion in loan-run offs, GBP 2.4 billion in property disposals, enforcements and restructurings and GBP 3.4 billion in allocated provisions against impaired loans, quickly becomes apparent that German Bank‟s are slower at deleveraging NPLs than other major markets (Source: Capital IQ, 2012). Due to Asian Financial Crisis, Growth and innovation in both Malaysia and Singapore are constrained by bank‟s whose capital has been eroded by the accumulation of NPLs (Karim, 2001).
Additionally, Commercial banks play a pivotal role in the economy in the intermediation process by mobilizing deposits from surplus units to deficit units. The surplus is channelled to deficit units through lending. Lending is the main activity of commercial banks in Kenya. However, banks in Kenya have had a high rate of loan default from the borrowers which have caused significant losses to the banks. This is because commercial banks have varied credit information and credit history about their borrowers and the credit seekers have taken this shortfall to get many loans from these banks which increases their rate of default because they might fail to service back all the loans. This study will therefore be guided by questions that sought to; find out on; How does the trend of NPls affect the financial performance of EQBL, What factors account for NPLs in EQBL and what is the effect of loan management on the financial performance of EQBL. Secondary data was collected from published financial statements of EQBL between years 2008 to 2014 to demonstrate how the subsequent trend of NPLs influence the financial performance of EQBL. While qualitative data was collected from the respondents by use of structured closed ended questionnaires, to answer the Effects of loan management on financial performance of EQBL and factors that account for NPLs in EQBL. The researcher will adopt a case study research design method.
South African Economy is closely integrated into the world economy due to trade and financial Linkages. (Olena H., 2010), described South African Bank‟s as “Owing to a high level of capitalization, the South African Banking Sector is resilient to severe economic shocks”. Furthermore other comparison of NPLs can be evidenced between countries. The ratios between 2001 and 2002 were 33 in Kenya, 24 in Zimbabwe, 16.81 in Philippines, 11 in Nigeria, 7.7 in Taiwan and 3 in South Africa (Waweru & Kalani, 2009).
Kenya has in the recent times expanded its financial sectors in the country and in the Eastern region. By African standards and in comparison the other East African economies, Kenya‟s banking sector has for many years been credited for its size and diversification. Unlike most other countries in the region, Kenya has a variety of financial institutions and markets - banks, insurance companies, and stock and bond markets - that provide an array of financial products. In contrast, emerging economies like Tanzania, Capital Markets are not well developed (Richard, 2008). Firms in Tanzania on one hand are complaining about lack of credits and the stringent requirements set by banks, while banks on the other hand have suffered large losses on bad loans(Richard, 2008).The average loan loss in studied CBs was at 24.9%.Also,in Uganda, Financial stability
report June(Bank of Uganda, 2013) depicted that NPLs as a share of total loan fell to 4% in June 2013.During the period ended June 30, 2013, the Kenyan banking sector comprised 43 commercial banks, 1 mortgage finance company, 6 deposit taking microfinance institutions, 2 credit reference bureaus, 5 representative offices and 115 foreign exchange bureaus (CBK 2013).
An increase in NPLs seems to be taking toll on Bank profits with some financial institutions posting flat profits. This is partly explained by higher interest rates regime and political uncertainty in the country. While the CBK maintained its benchmark lending rate to commercial banks at 8.5 percent in January 2015 to spur households and business spending, the average lending rate still swings at around 17 percent. Recently , On July 2015 the CBK Monetary Policy Committee (MPC) reviewed the CBK Lending rate up to 11.5 percent from 10 percent in June same year. Similarly, the MPC have revised the KBRR from 8.54 percent to 9.87 percent with effect from July 7, 2015. (Business Daily newspaper, Wednesday, 15th July 2015).
It is worth to note that in practice, all licensed financial institutions are required to monitor and review their portfolio of credit and risk assets at least once every quarter on a regular basis. Assets are classified into four grades of risk: (i) standard; (ii) sub-standard; (iii) doubtful; and (iv) loss. Assets in risk grades (ii) to (iv) are considered non performing and therefore no income may be accrued on them.
B. STATEMENT OF THE PROBLEM
Ideally, NPLs are facilities on which the borrower is not making interest payments or repaying any principal for a period more than 90 days. At what point the loan is classified as non-performing by the bank, and when it becomes bad debt, depends on local regulations. Banks normally set aside money to cover potential losses on loans (loan loss provisions) and write off bad debt in the profit and loss account. In some countries, banks that have accumulated too many NPLs are able to sell them at a discount-to specially established asset management companies (AMCs), which attempt to recover at least some of the money owed (IMF Banking Report, 2013).
Currently in Kenya, all commercial bank‟s gross NPLs increased by 14.1 percent in year 2013 to Ksh 61.6 billion in December 2014. The ratio of gross NPLs to gross loans increased from 4.5 percent in December 2013 to 5.0 percent in December 2014. The increase in NPLs levels was mainly attributable to the spill over effects of the high interest rates regime in 2011 and 2012 respectively. Similarly, the quality of assets, measured as a proportion of net non-performing loans to gross loans declined from 1.5 percent to 2.0 percent over the same period (According to Banking sector report ,2014).
Page 3 www.ijiras.com | Email: [email protected] institutions with their attendant repercussions on the economy
as a whole. Kane & Rice (2001) stated that at the peak of the financial crisis in Benin, 80% of total bank loans portfolio which was about 17% of GDP was nonperforming in the late twentieth century.
In Kenya, the lure of maximizing profitability has been alleged to increase credit risk and the potential for non-performing loans. The aforementioned loans negate profitability of financial institutions and as such the initial object of maximizing profitability by employing relaxed conditions when awarding credit facilities defeats the very goals of financial institutions according to (Wangai D.K. 2012). He found that the findings and the recommendations thereof, will enable financial institutions particularly MFIs to formulate and implement more appropriate strategies to mitigate NPLs in order to enhance their financial performance.
In another study done by Nasieku (2014) while investigating factors that affect the non performing loans at the Commercial Bank of Africa (CBA), Kenya, found that the prevailing economic conditions were the major economic factors affecting the levels of NPLs. Additionally, on the Bank‟s specific factors affecting NPLs, were the ownership as a major cause as compared to poor loan monitoring or follow up. The study also found that, the effective risk assessment as considered as a major remedial strategy for dealing with NPLs. Certainly bad loans can lead to the collapse of banks which have huge balances of these nonperforming loans if measures are not taken to minimize the problem. This study determined the relationship between non-performing loans and Financial Performance of the Banking sector at Equity Bank Ltd Eldoret branches. When loans become delinquent, it has serious negative effect on the health and operations of the CBs. One of the reasons is that, in line with the CBK regulations, the lending institution has to make provision and charges for credit losses (bad debt/ impairment) which ultimately reduce the profit level.
C. RESEARCH QUESTIONS
This study was guided by the following research questions; How does the trend of nonperforming loans affect Financial
Performance of EQBL?
What factors account for Nonperforming loans in EQBL? What is the effect of loan management on the financial
performance of EQBL?
D. THIS STUDY WAS GUIDED BY THE FOLLOWING RESEARCH HYPOTHESES
H0.there is a relationship between non-performing loans and financial performance of equity bank Eldoret town
H1 there is no relationship between non-performing loans and financial performance of Equity bank Eldoret town.
E. SIGNIFICANCE OF THE STUDY
The information obtained served as a useful guide to EQBL and other banks in crafting credit policy and implementation of effective credit risk management during appraisal process. This study will help credit analysts to look
beyond quantitative data i.e. quality account statement but to additionally incorporate other aspects of character based appraisal in their lending process to mitigate on loan defaults. Borrowers will be empowered by understanding the consequences of defaulting on loans, for example adverse listing on Credit Reference Bureau (CRB), penalty interest rates among others. To the general public and policy makers, the study will act as a useful reference point in reviewing policies governing specific sectors. For example, government policy‟s on taxation on banks among others.
F. THEORETICAL FRAMEWORK MORAL HAZARD THEORY
The history of moral hazard appreciates that unobservable behaviour by insured persons, and others participating in contingent contracts, is an interesting and important subject for economist, as put forward by Arrow (1970) and Pauly (1968). Neither of the authors showed how to model these situations formally, nor suggested any worthwhile propositions. They agreed that insured persons who fully exploit their contracts, expressed in terms of observable behaviour, thereby reduce the efficiency of the economy. Pauly adopted the startling position that such “rational economic behaviour” cannot be morally perfidious; Arrow, more reasonably, emphasized its disadvantages.
The moral hazard problem implies that a borrower has the incentive to default unless there are consequences for his future applications for credit. This result from the difficulty lenders have in assessing the level of wealth borrowers will have accumulated by the date on which the debt must be repaid, and not at the moment of application. If lenders cannot assess the borrowers‟ wealth, the latter will be tempted to default on the borrowing. Forestalling this, lenders will increase rates, leading eventually to the breakdown of the market Alary & Goller (2001). Adverse selection and moral hazards have led to significant accumulation of nonperforming loans in banks (Bester, 1994; Bofondi & Gobbi, 2003).
II. LITERATURE REVIEW A. REVIEW OF THEORIES
a. THEORY OF ASYMMETRIC INFORMATION
Page 4 www.ijiras.com | Email: [email protected] about the same specific item to be transacted is therefore in a
position of making either right or wrong decision concerning the transaction. This theory is relevant to the study as it depicts the information gaps that exist between parties in a financial transaction.
b. AGENCY THEORY
This theory elaborates the relationship in which one party (the principal) delegates work to another (agent), who performs that work on behalf of the principal (Pandley (2010) and Eisenhardt, (1984). Agency theory was pioneered by Scholars Stephen Ross and Barry Mitnick. They argued that behaviour never occurs as it is preferred by the principal because it does not pay to make it perfect. But society creates institutions that attend to these imperfections, managing or buffering them, adapting to them, or becoming chronically distorted by them. The theory is concerned with resolving two problems that occur in agency relationships when Managers can maximize their salaries/perks at the cost of the shareholders. The first agency problem arise when the desire or goals of the principal and agent conflict and that it is difficult or expensive for the principal to verify what the agent is actually doing. The problem is that the principal cannot verify that the agent as behaved in a manner he wants. The two parties may have different attitudes towards risk. The problem is that the principal and agent may prefer different actions because of the different risk preferences. This theory is useful to the study because the managers must act in the best interest of the Shareholders when making loan and credit decisions respectively. Since Outstanding Loan Book (OLB) and loan growth forms the highest key performance indicator (KPI) in the credit sector which forms the basis for performance evaluation criteria. In this regard, managers may be tempted to grant risk loans to achieve this KPI.
Pauly adopted the startling position that such “rational economic behaviour” cannot be morally perfidious; Arrow, more reasonably, emphasized its disadvantages.
The moral hazard problem implies that a borrower has the incentive to default unless there are consequences for his future applications for credit. This result from the difficulty lenders have in assessing the level of wealth borrowers will have accumulated by the date on which the debt must be repaid, and not at the moment of application. If lenders cannot assess the borrowers‟ wealth, the latter will be tempted to default on the borrowing. Forestalling this, lenders will increase rates, leading eventually to the breakdown of the market, Alary and Goller (2001). Adverse selection and moral hazards have led to significant accumulation of nonperforming loans in banks (Bester, 1994; Bofondi & Gobbi, 2003).
B. CRITICISM OF THE THEORIES
The problem with agency theory arises when the desire or goals of the principal and agent conflict and that it is difficult or expensive for the principal to verify what the agent is actually doing. The problem is that the principal cannot verify that the agent as behaved in a manner he wants. The two parties may have different attitudes towards risk. The
problem is that the principal and agent may prefer different actions because of the different risk preferences. The problem arises where the two parties have different interests and asymmetric information (the agent having more information), such that the principal cannot directly ensure that the agent is always acting in its (the principal's) best interests, particularly when activities that are useful to the principal are costly to the agent, and where elements of what the agent does are costly for the principal to observe.
III. RESEARCH DESIGN AND METHODOLOGY A. RESEARCH DESIGN
This study adopted the use of correlation design. A correlation research design is useful to researchers who are interested in determining to what degree two variables are related, however, correlation research “does not “prove” a relationship; rather, it indicates an association between two or more variables” (Creswell, 2008). When a correlation research design is appropriate for a study, the correlation study aims at examining the relationship between non-performing loans and financial performance at Equity bank Eldoret town. Additionally, this method enabled the researcher to infer the finding s to a larger population with high level of accuracy. In this case, the larger population will be other Equity bank branches.
B. TARGET POPULATION
The target population comprised of credit team, working in different junior and managerial levels employed at Equity Bank (K) Ltd at Eldoret branches involved in all time appraisal and lending who are 52 in number. This population was selected since the people in the branches are the ones involved in the day to day lending business for the company and thus are well conversant with the subject matter of the study.
C. DESCRIPTION OF RESEARCH INSTRUMENTS The researcher used both secondary and primary data. A document analysis guide was used for secondary data collection. The document analysis served as an instrument that the researcher used to direct in specific selection of information from the studied financial statements that is relevant to the study, data was extracted from the annual published financial reports of the Bank for the period ending 31st December each year from 2008 to 2014 to establish the trend of the NPL‟s, whereas primary data was obtained by the use of structured closed ended Questionnaires.
D. VALIDITY AND RELIABILITY
Page 5 www.ijiras.com | Email: [email protected] respondents since the number required for pre-tests should not
to be too large.
E. DESCRIPTION OF DATA ANALYSIS PROCEDURES Content analysis was performed based on information from the published financial information of EQBL. Before processing the responses, the filled questionnaires were edited for consistency and completeness. The collected data was then coded to enable the responses to be grouped into various categories. Data for this study was both quantitative and qualitative hence both content and descriptive analysis techniques were used. Content analysis was employed to analyze the qualitative data collected while a descriptive method was used to analyze quantitative data. The data was processed using Statistical Package for Social Sciences version 21 and the processed data was presented in tables, graphs and explanation given.
IV. RESULTS A. RESPONSE RATE
From the onset, the study sought to mail questionnaires to fifty two respondents within EQBL branches Lending departments in Eldoret town. However, out of the fifty two questionnaires, only fifty were returned, hence this means some of targeted respondents were unable to give feedback. This is because they cited reasons that they had very demanding tasks that could not necessitate them to respond in good time. The response rate therefore translates to approximately over 96% of the target population. This notwithstanding, the feedback that was derived fulfilled the objectives of the study and ultimately attempt to solve the statement of the problem.
a. DEMOGRAPHIC CHARACTERISTICS OF RESPONDENTS
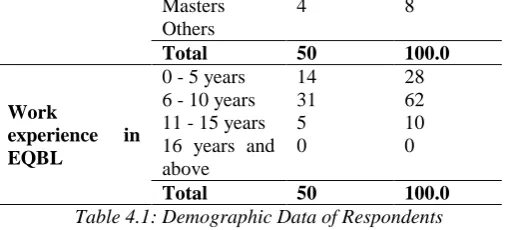
The background information that was sought was Gender, Age, Level of Education and Working experience. A total of 50 respondents filled the questionnaire, and the responses were summarized in Table 4.1
Variable Category Frequenc y
Percent
Gender
Male 34 68
Female 16 32
Total 50 100.0
Age bracket
27 years and below
8 16
28 - 37 years 32 64
38 - 47 yrs 9 18
48 years and above
1 2
Total 50 100.0
Level of Education
Certificate 1 2
Diploma 18 36
Bachelors Degree
22 5
44 10
Masters
Others
4 8
Total 50 100.0
Work
experience in EQBL
0 - 5 years 14 28
6 - 10 years 31 62
11 - 15 years 5 10
16 years and above
0 0
Total 50 100.0
Table 4.1: Demographic Data of Respondents Among the respondents who participated in this study32% were female and 68% were male. The data on Table 4.1 shows that 64% of the respondents were aged between 28-37 years and this may imply that the staffs at EQBL are extremely youthful. Additionally, only one respondent representing 2% of the total sample is aged over 48 years. Regarding the level of Education, only 2% had certificate qualifications 44% had bachelors‟ degree qualifications and 10% had a master‟s degree as indicated in Table 4.1. This may indicate that the staffs at the credit department are learned and thus they understand the implication of non-performing loans on the financial performance of EQBL.
Data on Table 4.1 shows that 62% of the respondents possess a working experience of between 6-10 years. This adequately explains that they can fully understand the trends in NPLs and causes that lead to NPLs hence they can contributed valuable support on this study. Only a small portion of the respondents i.e. 28% possess less than 5 years in experience. However, none of the respondent had worked for over 16 years as depicted in the same table.
Factor Frequency Percent
Poor Loan Monitoring 30 60
Poor Appraisals 16 32
Diversification of Funds 14 27
Lack of reliable Market Information on Borrowers
8 15
High Interest Rates 4 2
Table 4.3: Factors Accounting for Non-performing Loans in EQBL
The most ranked factor contributed to non performing loans was Poor Loan Monitoring (60%).The second significant factor was weak loan portfolio management especially weak credit analysis (appraisals) at the application stage (32%), borrowers poor management of funds (27%), lack of reliable market information on borrowers were ranked at (15%), this may be attributed to mandatory sharing of borrower/customer information by financial institutions through the Credit Reference Bureau (CRB). Lastly, high interest rates were considered as the moderate factor causing NPLs at (2%). This may be due to the fact that if banks review interest rates upwards, in practice they do not raise the effective instalment but they lengthen the term of the loan, so as not to affect the customers‟ cash flow and repayment ability as the industry regulator (CBK) recommends. It may be concluded therefore that, factors internal to CBs were major causes of NPLs.
Factor Frequency Percent
Page 6 www.ijiras.com | Email: [email protected] Quality Loan Book
Maintenance
31 62
Collateral Documentation 29 58
Relationship Management 19 38
Compliance with internal policies
13 26
Table 4.4: Loan Management Factors that Influence the Financial Performance of EQBL
The Loan management factors considered to positively influence the financial performance of EQBL Eldoret Branches were, all factors mentioned on the Table 4.3 (82%). This means therefore that the respondents opined that for financial performance to be improved, the quality of loan book is important factor (62%), proper documentation of collateral such as the bank taking first legal charge in securities and timely perfection, was considered as an important factor that can serve as a fall back for the bank when default arises (58%). Other important factors therefore included, credit staff being facilitated to visit customers regularly and keep touch/ relationship management (38%), as well as complying with internal policies and procedures at (26%) was considered an important attribute for the bank to observe. It can be concluded therefore that reducing NPLs and strengthening credit can be attributed to the credit analysts obeying a series of set policies and procedures and also by ensuring that customer care/ relationship management is a key tool to building quality relations.
Factor Frequency Percent
Profitability 50 100
Loans 46 92
Customers 40 80
Deposits 50 50
Fixed assets 15 30
Table 4.5: Main Indicator (s) of the Financial Performance of EQBL
All respondents mentioned Profitability (100%) as the main indicator of measuring the financial performance, followed by Loans at (92%), Customer base was also rated as one of the main major indicator (80%). Deposits being one of the major source of bank liabilities and this are because customers may come to withdraw their funds at short or no notice, depending on client‟s account type was also rated at (50%). Finally, fixed assets such as branch networks were rated the lowest (30%) among the other four factors, this may be so because, in practice most banks lease their business premises and thus it may not be a major indicator of financial performance.
Figure 4.1: Growth in Loan portfolio
From figure 4.1, it can be noted that there was a progressive growth in the loan portfolio over the years. The year 2009 has a slight drop from 581 million to 400 million, and the growth in loan increased with each year.
Figure 4.2: Growth in Branch Profits
From the figure 4.2 above, profits declined in the year 2010, but continued to grow thereafter.
Figure 4.3: Portfolios at Risk Curve (PAR CURVE) The portfolio at risk had a continued decline from the year 2008 to 2012 but rose in 2013 and 2014.
b. DESCRIPTIVE STATISTICS
EAT OLB PAR
N Valid 7 7 7
Missing 0 0 0
Mean 71.2857 746.7143 61.5714
Std. Deviation 23.03414 221.90667 18.10025
Minimum 32.00 400.00 32.00
Page 7 www.ijiras.com | Email: [email protected] Table 4.5: Descriptive Statistics
Earnings after tax had a minimum of 32M and a maximum of 100M over the seven year period. Outstanding Loan Book over the seven year period had a minimum of 400M and a maximum of 1014M, while the portfolio at risk had a minimum of 32M and a maximum of 81M. Earnings after tax had a mean of 71.29M and standard deviations of 23.03M, while outstanding loan book had a mean of 746.71M and a standard deviation of 221.9M. The portfolio at risk had a mean of 61.57M and a standard deviation of 18.10M.
c. CORRELATION ANALYSIS
The study determined the relationship between non performing loans and financial performance of the banking sector in Kenya by use of correlation analysis to measure the strength between the variables in this study.
d. TEST OF HYPOTHESIS
The study sought to test the following hypothesis: H0.there is a relationship between non-performing loans and financial performance of equity bank Eldoret town
H1 there is no relationship between non-performing loans and financial performance of Equity bank Eldoret town.
The relationship between non performing loans and financial performance was as shown in the table below.
EAT OLB PAR
EAT
Pearson Correlation
1 .773* -.746
Sig. (2-tailed) .041 .054
N 7 7 7
OLB
Pearson Correlation
.773* 1 -.573
Sig. (2-tailed) .041 .179
N 7 7 7
PAR
Pearson Correlation
-.746 -.573 1
Sig. (2-tailed) .054 .179
N 7 7 7
Table 4.6: Correlations
From the results of table 4.6 it showed that, there is a significant positive correlation between operating loan book and earnings after tax of 0.773. There is a significant negative correlation between portfolio at risk and earnings after tax of -0.413.
e. REGRESSION ANALYSIS
Model R R Square Adjusted R Square
Std. Error
of the
Estimate
1 .857a .734 .602 14.53678
a. Predictors: (Constant), PAR, OLB Table 4.7: Model Summary
From the model summary the results show that 73.4% variation was explained by the variables under
the study. This means that the regression model used is a good predictor. Similarly, the correlation between the variables was found to be R=0.857 which implies the variables contributed 85.7% on the relationship between the independent and the dependent variables.
Model Unstandardized Coefficients
Stan dardi zed Coeff icient s
t Sig.
B Std.
Error
Beta
1
(Cons tant)
66.711 43.811 1.5 23
.202
OLB .053 .033 .515 1.6 37
.177
PAR
-.574 .400 .451 -1.4 34
.225
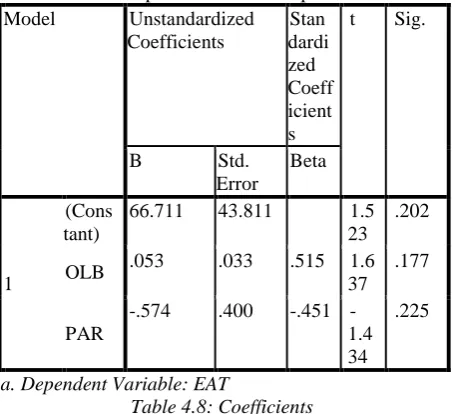
a. Dependent Variable: EAT
Table 4.8: Coefficients
The regression model that was obtained from the results of the analysis is:
EAT = 66.711 + 0.053 OLB- 0.574PAR
The regression model in table means that a one unit change in the OLB leads to an increase of 0.053 in the earnings after tax of the Equity bank Eldoret. Similarly, a one unit change in PAR leads to a decrease of 0.574 in EAT of Equity bank Eldoret town.
B. DISCUSSION
Out of the fifty two questionnaires distributed to the respondents, only fifty were returned. This accounted for 96.15% response rate and was sufficient to fulfil the objectives of the study and ultimately attempt to solve the statement of the problem.
The model summary the results indicate that 73.4% variation was explained by the variables under the study. This means that the regression model used is a good predictor. Similarly, the correlation between the variables was found to be R=0.857 which implies the variables contributed 85.7% on the relationship between the independent and the dependent variables.
There is a significant positive correlation between operating loan book and earnings after tax of 0.773. This means that a slight change in the in the operating loan book will lead to a significant change in the earnings after tax of the Equity bank limited. Also there is a significant negative correlation between portfolio at risk and earnings after tax of -0.413. It means that a slight change in the PAR, will lead to a significant negative change in the EAT of equity bank.
Page 8 www.ijiras.com | Email: [email protected] financial performance of MFBs in Nakuru town. The credit
risk negated the MFBs‟ financial performance. It was deduced that, increase in credit risk would significantly reduce the MFBs‟ financial performance. Wambua Benard Muasya conducted a study of the impact of the non-performing loans on the performance of banking sector in Kenya, and the findings confirms that nonperforming loans do affect Commercial bank‟s Performance in Kenya. Further analysis of individual commercial banks with more than Kshs 25 billion worth of asset indicated while the impacts are negative the magnitude of nonperforming loans to both interest income and profitability are not adverse, this actually concurs with the findings of this study.
a. INTERPRETATIONS OF THE FINDINGS
The research sought to determine the relationship between non-performing loans and financial performance of the banking sector: a case of Equity Bank Eldoret town. The correlation matrix for the two variables shows that there are good correlations between individual independent variables and commercial banks financial performance as measured by EAT. However, only the correlation coefficient between PAR and financial performance indicators was negative. There was a strong negative correlation between PAR as an independent variable and financial performance indicators of EAT. There was a strong positive correlation between OLB as independent variables and financial performance indicators of EAT. That is, increase in the operating loan book would yield a big positive result on EAT.
V. SUMMERY A. SUMMARY
Financial institutions (FIs) are very important in any economy as they mobilize savings for productive investments and facilitating capital flows to various sectors in the economy, thus, stimulating investments and increase productivity. This study aimed at shading light on the relationship between non-performing loans and the financial performance of Equity Bank (K) ltd. The study was guided by the following research questions; how does the trend of nonperforming loans affect financial performance of EQBL? What factors account for nonperforming loans in EQBL? What is the effect of loan management on the financial performance of EQBL?
This study adopted the use of correlation design. A correlation research design is useful to researchers who are interested in determining to what degree two variables are related, however, correlation research “does not “prove” a relationship; rather, it indicates an association between two or more variables” (Creswell, 2008). When a correlation research design is appropriate for a study, the correlation study aims at examining the relationship between non-performing loans and financial performance at Equity bank Eldoret town. Additionally, this method enabled the researcher to infer the finding s to a larger population with high level of accuracy. In
this case, the larger population will be other Equity bank branches.
The study adopted both primary and secondary data as a source of information, questionnaire were used as the main instrument, while Secondary data was extracted from the annual published financial reports of the Bank for the period ending 31st December each year to establish the trend of the NPLs. Document analysis guide was used to extract the relevant information that answered the research questions from the published financial statements for seven year period (2008-2014).
The data was analysed and the data presented in tables and graphs and explanation were given for each. The study found that there was a significant positive relationship between OLB and EAT, and a significant negative correlation between PAR and EAT.
a. CONCLUSIONS (BASED ON THE FINDINGS)
The findings found that when the non-performing loans increased, the performances of equity bank branches were affected negatively. This is shown in the regression line where PAR has a negative coefficient. It means that when the PAR increases, EAT decreases significantly.
The findings found that the most ranked factor that contributed to non performing loans was Poor Loan Monitoring (60%).The second significant factor was weak loan portfolio management especially weak credit analysis (appraisals) at the application stage (32%), borrowers poor management of funds (27%), lack of reliable market information on borrowers were ranked at (15%), this may be attributed to mandatory sharing of borrower/customer information by financial institutions through the Credit Reference Bureau (CRB). Lastly, high interest rates were considered as the moderate factor causing NPLs at (2%). This may be due to the fact that if banks review interest rates upwards, in practice they do not raise the effective instalment but they lengthen the term of the loan, so as not to affect the customers‟ cash flow and repayment ability as the industry regulator (CBK) recommends. It may be concluded therefore that, factors internal to CBs were major causes of NPLs. B. RECOMMENDATIONS
Based on the findings and conclusion of the study, it was found that there was a positive correlation relationship between operating loan book, and financial performance of Equity bank in Eldoret town. The study recommends that the credit department staff should have higher loan targets as this contributes significantly to the profits of the bank.
Page 9 www.ijiras.com | Email: [email protected] C. SUGGESTIONS FOR FURTHER RESEARCH
The study recommends further research to look into the following;
How does the trend of non-performing loans affect financial performance of Commercial Banks in Kenya? What is the effect of loan management factors on the financial performance of Commercial Banks in Kenya?
REFERENCES
[1] Ahmed, JU. (2010).An Empirical Estimation of Loan Recovery and Asset Quality of Commercial Banks; The NEHU Journal, Vol.8 (1).
[2] Akerlof G.A. (1970). The Market for “Lemons”: Quality Uncertainty and the Market Mechanism; the Quarterly Journal of Economics 84(3).
[3] Alary, D. & C. Goller (2001). „Strategic default and penalties on the credit market with potential judgement errors‟, EUI working paper.
[4] Auronen L (2003). Asymmetric Information: Theory and Applications. Paper presented in the Seminar of Strategy and International Business as Helsinki University of Technology, May 21st 2003.
[5] Allan & Olomi, D.R (2003). Why SMEs Have Limited Access to Bank Loans. University of Dar es Salaam Entrepreneurship Centre.
[6] Barron, J.M., & Staten, M.E., (2008). The Emergence of Captive Finance Companies and Risk Segmentation in Loan Markets: Theory and Evidence. Journal of Money Credit and Banking. 40, 173-192.
[7] Bester, H (1994). The Role of Collateral in a model of Debt Renegotiation. Journal of Money, Credit and Banking 26 (1), 72-86.
[8] Bishnu Kumar A. (2006) Nonperforming Loans in the Banking Sector of Bangladesh: Realities and Challenges [9] Barry, M.M. (2006) Origin of the Theory of Agency. An
Account by One of the Theory‟s Originators.
[10] Business Daily, (Wednesday July 15, 2015) Borrowers to feel pinch as CBK raises Lending Rates.
[11] Central Bank of Kenya, (1997). „A Guide to Wise Management of Loans from the Banking Institutions‟. Nairobi, Kenya.
[12] Central Bank of Kenya, (2001). „Bank Supervision Annual Report 2000. Nairobi, Kenya.
[13] Central Bank of Kenya‟, (2007). Bank Supervision Annual Report 2006. Nairobi, Kenya.
[14] Central Bank of Kenya, (2008). Basel II implementation Survey Results. Nairobi, Kenya.
[15] Central Bank of Kenya, (2009). Bank Supervision Annual Report 2008. Nairobi, Kenya.
[16] Central Bank of Kenya, (2010). Bank Supervision Annual Report 2009. Nairobi, Kenya.
[17] Chand, S., (2002). Financial Sector Development and Economic Growth in Pacific Island Countries. Pacific Economic Bulletin, 17(1), 117-133.
[18] Creswell, J. (2008). Educational research: Planning, conducting, and evaluating quantitative and qualitative research. New Jersey: Pearson: Merrill Prentice Hall.
[19]Creswell, J. (2011). Research design: Qualitative,
quantitative, and mixed method approaches. (5th Ed.). Thousand Oaks: Sage Publications Ltd.
[20] Fernandez de L.,Jorge, M. & Saurina, J (2000). „Credit Growth , Problem Loans and Credit Risk Provisioning in Spain‟. http.//www.bde.es/informes/be/docs/dt0018.pdf (7/10) Equity Bank Limited Website, 23rd January, 2015: www.equitygroup.co.ke.
[21] Everlyne, R „Factors that Cause Non Performing Loans in Commercial Banks in Tanzania and Strategies to Resolve Them‟. Journal of Management Policy and Practice Vol. 12 97) 2011.
[22] Gadise Gezu(2014) Determinants of nonperforming loans: empirical study in case of commercial banks in Ethiopia
[23] Klein, Daniel B. (1992).“Promise Keeping in the Great Society: A Model of Credit Information Sharing”, Economics and Politics, vol. 4, no. 2, 117-136.
[24] Kothari C.R. (2004). „Research Methodology, Methods and Techniques‟. New Delhi New Age International publishers.
[25] Leland, H. E. Pyle, D. H. (1977). “Informational asymmetries, financial structure, and financial intermediation”, The Journal of Finance 32, 371-387. [26] Mirrlees, J.A. (1999) „The Theory of Moral Hazard and
Unobservable Behaviour‟. Trinity College, Cambridge. [27] Mc Meamin J. (1999). „Financial Management An
introduction‟. New Jersey Prentice Hall
[28] Nene James(2012) the relationship between the level of non-performing loans and the financial performance of commercial banks in Kenya.
[29] Ngechu. M. (2004). Understanding the research process and methods. An introduction to research methods. Acts Press, Nairobi.
[30] N, Nasieku (2014) Factors Affecting non performing loans: A case study of Commercial Bank of Africa (CBA) Kenya.
[31] Oloo O. (2003). Challenges facing Kenya's Banking Sector. In Market Intelligence. The Business and Finance Journal, Annual Special Edition.
[32] Oloo O. (2001). „A Comprehensive, Analysis of Banking of Kenyas' Banking Sector‟. In Market Intelligence. The Business and Finance Journal: Annual Special Edition. [33] Oloo, M. (2007). „Banking Survey Kenya. Nairobi‟ Think
Business Limited.
[34] Ongore V. O & G.K.( 2013) „Determinants of Financial Performance of Commercial Banks in Kenya‟.
[35] Padilla, A.J. & Pagano, M., (2000). "Endogenous Communication among Lenders and Entrepreneurial Incentives," Papers 9407
[36] Padilla, A. Jorge & Marco Pagano (1996). Sharing Default Information as a Borrower Discipline Device, Industry Study Program Discussion Paper No. 73, Boston University, October.
Page 10 www.ijiras.com | Email: [email protected] [38] Pagano, Marco & Tullio Jappelli (1993). Information
Sharing in Credit Markets, The Journal of Finance 43(5), December, 1693-1718.
[39] Roland B, K &A. P.(2013) Non-Performing loans what matters in addition to the economic cycle?
[40] Rouse C. N. (1989). Bankers‟ Lending Techniques, Chartered Institute of Bankers Publication.
[41] Suvita Jha& Xiaofeng Hui(2012) „ A comparison of financial performance of commercial banks‟: A case study of Nepal
[42] Ugirase. J. M (2013) „the effect of credit risk management on the financial performance of commercial banks in Rwanda.‟
[43] Wambua, B.M (2008) „the impact of non-performing loans on the performance of the banking sector in Kenya‟.
[44] Wangai, D. K (2012) „Impact of Non-Performing Loans on Financial Performance of Microfinance Banks in Kenya‟: A Survey of Microfinance Banks in Nakuru Town