R E S E A R C H
Open Access
Database application model and its service
for drug discovery in Model-driven architecture
Noriko Etani
Correspondence:
[email protected] Graduate School of Medicine, Kyoto University/CREST, Japan Science and Technology Agency. 36-1 Yoshida-honmachi, Sakyo-ku, 6068501 Kyoto, Japan
Abstract
Big data application has many data resources and data. In the first stage of software engineering, a service overview or a system overview cannot be seen. In this paper, we propose that two processes of “Big data analytics” and “Implementation of data modeling” should be collaborated with Model-driven architecture (MDA). Data modeling with those two process in MDA should be repeated fast in order to verify the data model and to find a new data resource for a service. Our first research goal of big data application is to predict side effect of drug which is one of screening methods in drug discovery. This prediction model is constructed with data mining methods at the intersection of statistics, machine learning and database system. Moreover, a new service for drug discovery by new uses for old drugs can be found in data modeling and developed. We demonstrate that the prediction model and the data model for drug discovery are implemented as a prototype system to verify those models and their practicality.
Keywords: PLS regression analysis, Discriminant analysis, Support vector machine, Prediction model, Drug side effect, Drug discovery, Model-driven architecture (MDA)
Introduction
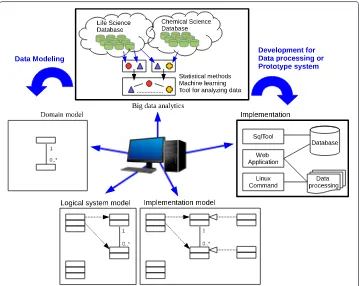
The key properties of big data are characterized as volume, velocity, variety, veracity, and value [1]. The value (business value) is crucial to offer services for business. To enhance the value, the veracity, which is about data understandability, is useful for people’s deci-sion making. Here, the “veracity” of big data properties is an important issue to develop an application for drug discovery because all of the clinical data is not offered and the data in drug discovery is sparse. Moreover, in the first stage of software engineering, a ser-vice overview or a system overview cannot be seen because big data application has many data resources and data. Therefore, we propose that two processes of “Big data analytics” and “Implementation of data modeling” should be collaborated with Model-driven archi-tecture (MDA) [2] in order to repeat data modeling fast and find a new service shown in Fig. 1. MDA by the Object Management Group (OMG) is a software design approach for the development of software systems. This architecture has three layers for abstraction of data modeling because software solutions can be automatically derived from mod-els by “technology independence”. “Domain model” is modeling the actual existence of a domain. It is called “Computation Independent Model (CIM)”. “Logical system model” is modeling a service with domain model, in which the components of a system interact with
Fig. 1Illustration of the proposed software development process in MDA for big data application. Domain model, logical system model, and implementation model are three layers for abstraction of data modeling in MDA. Big data analytics to discover new services and implementation to evaluate an application model should be collaborated with MDA
each other. It is called “Platform Independent Model (PIM)” “Implementation model” is modeling a specified system which logical system model can work with a specified tech-nology and platform, which examples are Linux, Web application and SQL database. It is called “Platform Specific Model (PSM)”. Those 5 processes are encapsulated and operated in parallel.
In this paper, we develop database application model and its service for side effect pre-diction of drug, which is our first research goal of big data application, and for drug discovery, which finds new uses for old drugs, introducing the proposed software devel-opment process in MDA into our research process. Drug side effect prediction is one of screening methods in drug discovery. The drug candidates can be ranked by this prediction.
The following sections of the paper are organized as follows: the “Background and lit-erature review” section will describe background of drug discovery and related works of side effect prediction and gene-drug discovery. The “Research design and methodology” section will outline the approach taken by the proposed research of side effect prediction and drug discovery. The performance of the proposed system will be demonstrated in the “Results and discussion” section. Finally, the “Conclusions” section will describe a direction for future.
Background and literature review
as drug re-positioning in order to minimize cost and a development period for efficiency [3]. One reason is complex biological processes of most human diseases which the ’one-drug-one-gene’ approach is not effective to treat [4]. In addition, the official report on the side effects of prescription drugs that have increased dramatically over the past decade. In 2011, U.S. Food and Drug Administration (FDA) has received about 500,000 reports of health hazards and the death related to medical products per year [5]. In considering the safety of the drug, the prediction of side effect in drug discovery is an important issue for drug screening. Then, the personalized medicine is expected to develop new drugs and treatments, and to avoid side effect using Single Nucleotide Polymorphism (SNP) which will contribute to identifying genes related to the diseases [6]. More than one SNP are in a gene. Here, previous works on potential side effect prediction of drug candidates and drug discovery with SNPs using Big Data are reviewed.
The research work to predict the side effects of drugs is done by the relationship between chemical and target protein. Yamanishi et al. [7] proposed a kernel regression model as computational model. This method predicted a potential side effect profiles based on the chemical structures and the information on the target protein. This method ranked first one of the side effects of 41.7 % (275 drugs) in 658 drugs, and ranked a cor-rect side effect among the top five scoring for 70.0 % (461 drugs) in 658 drugs. Kuhn et al. [8] focused on similarities in the side effects of drugs. The clinical data on chemical and protein were collected. And by combining drug-target protein and drug-side effect relations, overrepresented target protein-side effect pars are identified. 732 of 1428 side effects were predicted to be mainly caused by individual proteins. 137 of 732 side effects were proved by pharmacological or phenotypic existing data. From the results of these studies, classification and regression characteristics of the side effect are found. However, these studies will fall into a lack of an overall service-based solution because all data for the side effect prediction are not always prepared. Although the above-mentioned 2 studies focused on potential side effect, we focus not only on side effect, but also on its incidence. Therefore, we propose the comprehensive prediction model of drug side effect and its incidence using the data mining approach at the intersection of statics, machine learn-ing and database system considerlearn-ing classification and regression characteristics of the side effect. And the gene information of target protein and the chemical (drug) - protein interaction are considered in this paper.
As for gene-drug discovery, Riken developed a method of gene-drug discovery for rheumatoid arthritis [9]. Genome-wide association study discovered 101 disease genes of rheumatoid arthritis from SNPs. A new method proved that 101 disease genes were connected with target proteins of the existing rheumatoid arthritis drugs through protein-protein interaction network [10]. Moreover, it indicated that the existing drugs for other diseases were connected to disease genes of rheumatoid arthritis, and that those existing drugs were possible drug candidates for new uses of rheumatoid arthritis. So, we consid-ered this results in the clue of drug discovery, and propose database application model to discover the new drug candidates by new uses of the old drugs.
Research design and methodology
Data resources
• KEGG: a database resource of biological system [11]. Human diseases, disease genes, drugs and ATC code [12] are extracted.
• JSNP: a repository of Japanese SNP data [13–15]. Diseases, associated SNPs, and disease genes are extracted.
• STITCH 4.0: a database of protein-chemical interactions [16]. Confidence score of chemical (drug) - protein interaction is extracted.
• SIDER 2: a side effect resource to capture phenotypic effects of drugs [17, 18]. Chemical (drug), ATC code, drug side effect, and its incidence are extracted.
• PubChem: a database of chemical molecules [19]. Chemical ID according to drug number in the KEGG database is extracted.
Data features
Drug
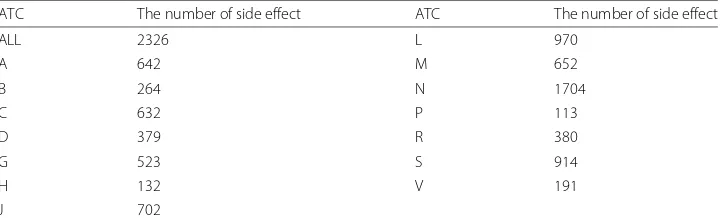
In drug discovery, drug candidates are selected by the interaction with target proteins including disease genes of human organ or system. So, the properties of drug are char-acterized as biological, anatomical, genetic, and clinical features. Pinpoint data in each feature is selected. Confidence score of chemical (drug) - protein interaction as biologi-cal feature, the first level of ATC code as anatomibiologi-cal feature, Gene ID of disease gene as genetic feature, and side effect and its incidence as clinical feature are utilized. As for ATC code, the Anatomical Therapeutic Chemical (ATC) Classification System uses it, which is controlled by the World Health Organization Collaborating Center for Drug Statistics Methodology, to classify drugs into five different groups according to the organ or system on which they act and their therapeutic and chemical characteristics [12, 20]. Here, the first level, that is the anatomical main group according to the organ or system which drugs act, is utilized. It consists of one letter. There are 14 anatomical groups as follows: (A) Ali-mentary tract and metabolism, (B) Blood and blood forming organs, (C) Cardiovascular system, (D) Dermatologicals, (G) Genito urinary system and sex hormones, (H) Sys-temic hormonal preparations, excluding sex hormones and insulins, (J) Antiinfectives for systemic use, (L) Antineoplastic and immunomodulating agents, (M) Musculo-skeletal system, (N) Nervous system, (P) Antiparasitic products, insecticides and repellents, (R) Respiratory system, (S) Sensory organs, and (V) Various.
There are 334 drugs which show their incidences of more than 0.1 % in the SIDER 2 database. The number of the side effect which is extracted from the SIDER 2 database is 2326. The highest scores for these 334 drugs as biological feature are extracted from the STITCH 4.0 database. 76 drugs among 334 drugs have the disease genes in the KEGG database. The number of the gene which is extracted from the KEGG database is 335.
Gene
2385 disease genes, in which 801 genes have the drugs, are extracted from the KEGG database. 11490 SNPs and 6513 genes, whose diseases are also nominated in the KEGG database, are extracted from the JSNP database.
Disease
Prediction model
Side effect prediction
The first level of ATC code in 334 drugs and Gene ID of the disease gene in 76 drugs can classify the side effects. As for ATC code, Table 1 shows the number of the side effect which is classified by the first level of ATC code. For example, “(L) Anti-neoplastic and immunomodulating agents” of ATC code can find 970 side effects which are including the typical symptoms of leukemia, lymphopenia and thrombocytopenia. As for the disease gene, side effects can be derived from the drug which is interacted with the disease gene. For example, the “HLA-DQA1” gene, which provides instructions for making a protein that plays a critical role in the immune system, can find 130 side effects extracted from the drugs of propanolol, simvastatine, dipyridamole and azathioprine which have it as the disease gene.
Incidence prediction
As for clustering method, discriminant analysis using regression formula is utilized to classify the data with 2 classes. In Table 2, “SCORE”, “ATC”, and “Gene ID” in pin-point data are the explanatory variables. The response variable is “Incidence”. All of those explanatory variables are not always prepared because the data is sparse. So, 7 dataset patterns of pinpoint data are prepared to be able to predict side effect incidence even if some of those explanatory variables are missing. A mark on Table 2 indicates the existing pinpoint data.
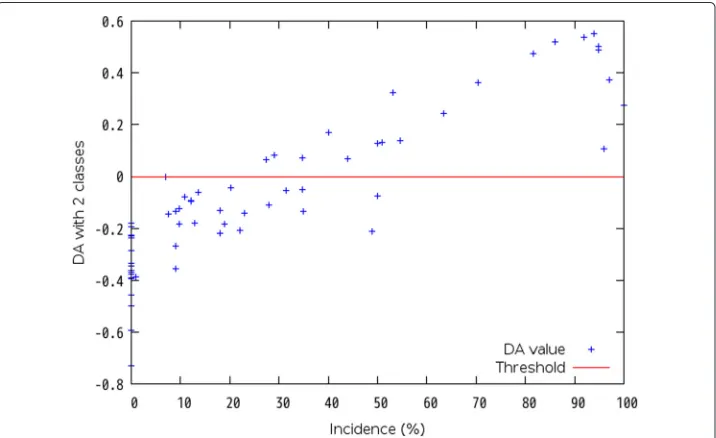
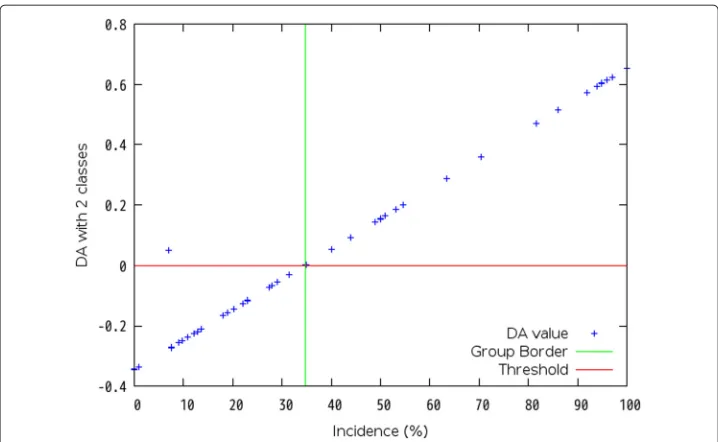
Firstly, each dataset is analyzed with regression analysis of a statistical method. Sec-ondly, discriminant analysis (DA) sets a discriminant criterion from the results by the regression analysis, and classifies the group by the criterion. Linear discriminant formula calculates a value which can classify the group. Then, each DA value is divided into the positive group or the negative group. In the regression analysis, single regression analysis in case of one explanatory variable is available, and partial least squares (PLS) regression analysis in case of more than one explanatory variable is available because a problem of multicollinearity may be occurred and it is difficult to decide the group border when one explanatory variable has correlation with another explanatory variable. When DA using multiple regression analysis is executed in a case of Dataset No. 4 shown in Table 2, Fig. 2 shows that it is difficult to decide the group boundary because there is variability around the threshold which value is “0”. Instead of multiple regression analysis, PLS regression analysis is introduced. As a result, Fig. 3 shows that it is easy to decide the group boundary at 34.7 %.
Table 1The number of side effect classified by the first level of ATC code
ATC The number of side effect ATC The number of side effect
ALL 2326 L 970
A 642 M 652
B 264 N 1704
C 632 P 113
D 379 R 380
G 523 S 914
H 132 V 191
J 702
Table 2Dataset of pinpoint data in Drug properties
Dataset No. SCORE ATC Gene ID Incidence Items
1 ◦ ◦ ◦ 358
2 ◦ ◦ 262
3 ◦ ◦ 214
4 ◦ ◦ ◦ ◦ 469
5 ◦ ◦ ◦ 334
6 ◦ ◦ ◦ 469
7 ◦ ◦ 334
“Dataset No.” indicates 7 dataset patterns with pinpoint data of each drug property. “SCORE” indicates confidence score of chemical (drug) - protein (disease gene) interaction as biological feature. “ATC” indicates the first level of ATC code as anatomical feature. “Gene ID” indicates Gene ID of disease gene as gene feature. “Incidence” indicates side effect incidence as clinical feature. “Items” indicates the number of the data in each dataset
This model is described as follows: An example formula of PLS regression model in Dataset No. 4 shown in Table 2 can be represented as
y=a1∗SCORE+a2∗ACT+a3∗Gene ID+b (1)
whereyis predicted value,a1is coefficient of explanation variable SCORE,a2is coeffi-cient of explanation variable ATC,a3is coefficient of explanation variable Gene ID andb is intercept. A formula of PLS-DA can be represented as
f(x)=y−y. (2)
yis observed value. Discrimination rule is as follows: Iff(x)≥0 Thensgnf(x)=1 and Iff(x) < 0 Thensgnf(x)= −1. Finally, each data is analyzed with DA and classified with 2 classes until one group in one class cannot be classified. As a result, Table 3 shows the clustering. And it indicates that the clustering is available with almost 100 % correct rate.
Fig. 3Discriminant Analysis with 2 classes by PLS regression formula in Dataset No. 4. This shows a result of the first grouping of the data in Dataset No. 4 shown in Table 2 by discriminant analysis with 2 classed using PLS regression formula. The threshold value is “0” to classify DA values with a positive class or a negative class. 34.7 % can be a group boundary for clustering
As for prediction method, Support Vector Machine (SVM) is supervised learning models with associated learning algorithms that analyze data and recognize patterns. A training algorithm of SVM learns the rules and creates the learning model. SVM takes a set of input data and predicts with the learning model. LibSVM Version 3.18 [21] for a machine learning library is available. The example model in Dataset No. 4 shown in Table 2 is described as follows: When there arensamples of Dataset No. 4, input space can be represented as
X=(SCORE1,ATC1,GeneID1),· · ·,(SCOREn,ATCn,GeneIDn). (3)
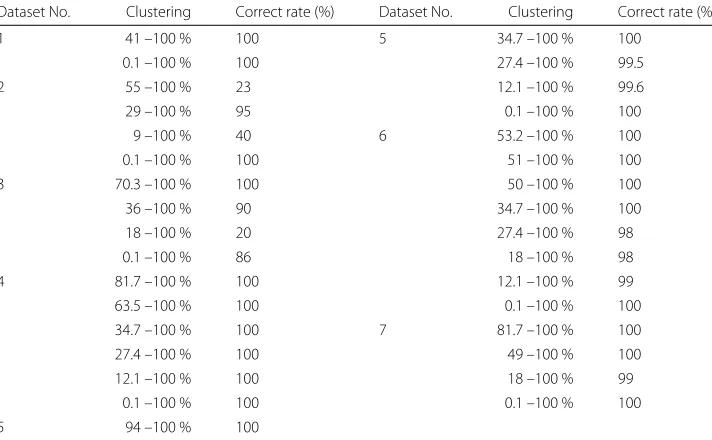
Table 3Evaluation of clustering
Dataset No. Clustering Correct rate (%) Dataset No. Clustering Correct rate (%)
1 41 –100 % 99 5 34.7 –100 % 100
2 55 –100 % 96 27.4 –100 % 100
29 –100 % 100 12.1 –100 % 100
9 –100 % 100 6 53.2 –100 % 95
3 70.3 –100 % 100 51 –100 % 100
36 –100 % 99 50 –100 % 100
18 –100 % 100 34.7 –100 % 100
4 81.7 –100 % 100 27.4 –100 % 100
63.5 –100 % 100 18 –100 % 100
34.7 –100 % 100 12.1 –100 % 100
27.4 –100 % 100 7 81.7 –100 % 100
12.1 –100 % 100 49 –100 % 100
5 94 –100 % 100 18 –100 % 100
Output domain can be represented asY = {1,−1}. A formula of class classification can be represented asf(x)=<w·x>+bwherewis weight vector, andbis bias. Classifica-tion rule is as follows: Iff(x)≥0 Thensgn[f(x)]=1 (positive class) and Iff(x) <0 Then sgn[f(x)]= −1 (negative class). Table 4 shows evaluation of each learning model for pre-diction by SVM. It indicates that the prepre-diction models are available with almost 100 % correct rate.
As for prediction procedure, firstly, new dataset is classified into one dataset pattern shown in Table 2. Secondly, in descending order of the clustering, SVM will response true or false to predict the lower value of the prediction interval. In a case of Dataset No. 2 shown in Table 2, there are 3 intervals shown in Table 3. When a parameter of SVM is the lower value of “55” and SVM responses false, the parameter is changed to the next interval’s lower value of “29”. When SVM responses true in this parameter, it is decided that side effect incidence will be from 29 % to 100 % in the approximated interval. When SVM responses false with the last parameter of “9”, it is decided that side effect incidence will be from 0.1 % to 100 % in the approximated interval.
Data modeling
Data modeling for side effect prediction is done, and its model is implemented to verify its service. After that, the data concerning gene is collected from the KEGG database and the JSNP database. In addition to side effect prediction, new services for drug discovery are found in data modeling. Here, the result of modeling database application in each model is described.
Domain model
Figure 4 shows a static view of the objects in an application for side effect prediction and drug discovery. There are 6 domain objects and their relations. 6 domain objects consists
Table 4Evaluation of learning model
Dataset No. Clustering Correct rate (%) Dataset No. Clustering Correct rate (%)
1 41 –100 % 100 5 34.7 –100 % 100
0.1 –100 % 100 27.4 –100 % 99.5
2 55 –100 % 23 12.1 –100 % 99.6
29 –100 % 95 0.1 –100 % 100
9 –100 % 40 6 53.2 –100 % 100
0.1 –100 % 100 51 –100 % 100
3 70.3 –100 % 100 50 –100 % 100
36 –100 % 90 34.7 –100 % 100
18 –100 % 20 27.4 –100 % 98
0.1 –100 % 86 18 –100 % 98
4 81.7 –100 % 100 12.1 –100 % 99
63.5 –100 % 100 0.1 –100 % 100
34.7 –100 % 100 7 81.7 –100 % 100
27.4 –100 % 100 49 –100 % 100
12.1 –100 % 100 18 –100 % 99
0.1 –100 % 100 0.1 –100 % 100
5 94 –100 % 100
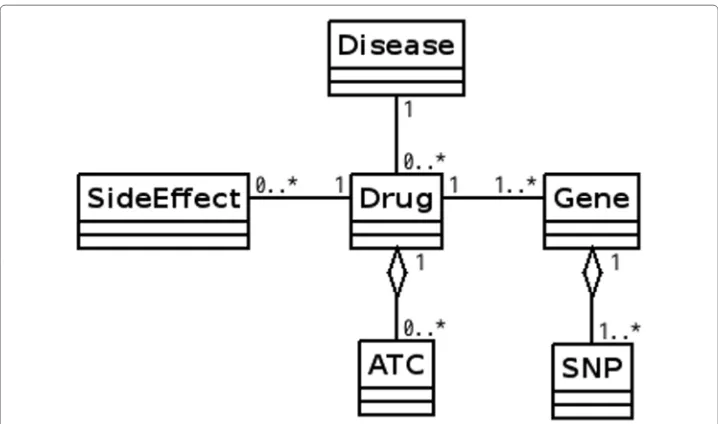
Fig. 4Domain model. There are 6 domain objects. There are 3 association links among aDrugobject, aGene object, aDiseaseobject and aSideEffectobject. There are 2 aggregation links between aDrugobject and an ATCobject, and between aGene object and aSNPobject. The notation 0..* in the diagram means “zero to many”. And the notation 1..* in the diagram means “one to many”
of aDrug object, an ATC object, aGene object, aSNP object, a Diseaseobject and a SideEffectobject.
Association indicates any logical connection or relationship between objects. There are 3 association links among aDrugobject, aGeneobject, aDiseaseobject and aSideEffect object. One disease contains zero to many drugs. One drug contains zero to many side effects. And one drug contains one to many genes.
Aggregation indicates the formation of a particular object as a result of one object built as a collection. In aggregation, the contained objects are not strongly dependent on the life cycle of the container. There are 2 aggregation links between aDrug object and an ATC object, and between a Gene object and a SNP object. A Drug object is made up of none or more ATC codes. And aGene object is made up of one or more SNPs.
Logical system model
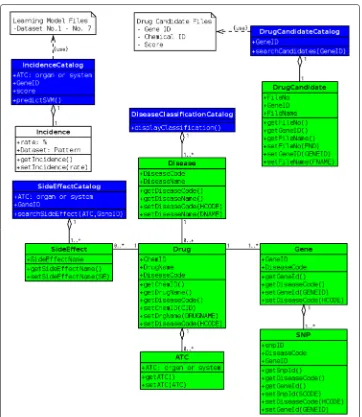
Figure 5 shows a static view of the objects and classes that make up the design and analysis space. There are 7 domain objects. ADrugCandidateobject is added to 6 domain objects shown in Fig. 4. They are persistent objects and saved in a database. AIncidenceobject is temporary object which is not saved anywhere.
Fig. 5Logical system model. There are 7 domain objects as persistent objects, which diagrams are green, and one object as temporal object, which diagram is white. For the class model, 4 new classes for services, which diagrams are blue, are modeled. And each attributes and each behavior are described in each object and class
In class design, the class model expresses both the persistent state and the behavior of the system. The state (attributes) are encapsulated in a class, and manipulated to offer services by a class (behaviors). Each attributes and each behaviors are modeled in each class and object.
Implementation model
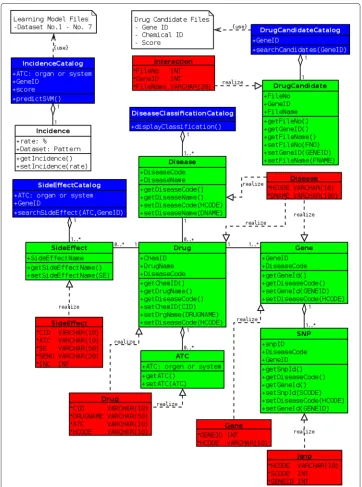
Fig. 6Implementation model. There are 6 tables of database, which diagrams are red. They realize 6 objects by object-relational mapping
“Jsnp” table. ASideEffectobject is realized by “SideEffect” table. ADrugCandidateobject is realized by “Interaction” table.
Implementation
System overview
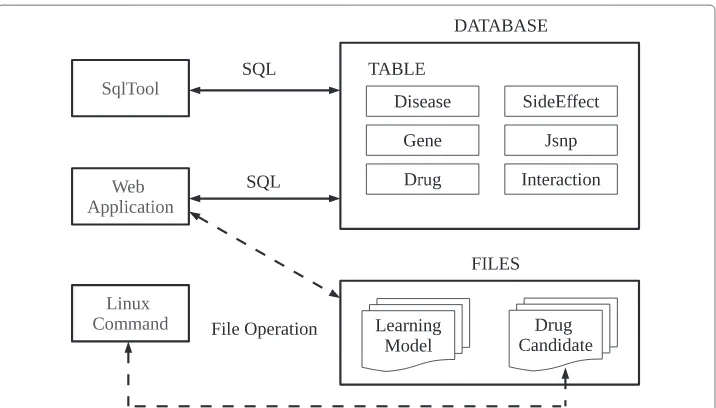
Fig. 7System overview. Implementation model shown in Fig. 6 is realized in the database application. This system consists of a database with 6 tables and two file groups. There are 3 ways of “SqlTool”, “Web Application” and “Linux Command” to access this system
One file group of “Drug Candidate” is also accessed with Linux command. It is freely accessed to search for new interaction pairs by Gene ID and chemicalID. Using this database, the clustering is created by statistical regression analysis and discriminant anal-ysis, and SVM creates the learning model with the clustering. When the data is input in incidence prediction, its incidence is calculated with those learning model files using SVM.
Software overview
Table 5 shows software development environment. As for Web application, open source is adopted. In order to develop a prototype system to evaluate the models, the domain object of Book Management System (bcat) [22], which is free-ware, is utilized. As a prototype system, Tomcat server can be connected to web browser by port 8080 in the development environment of Java2SE.
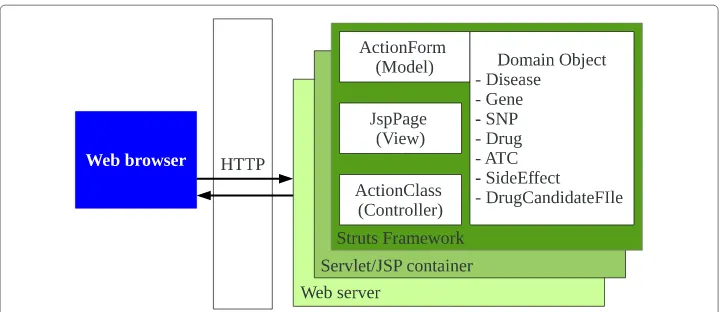
Figure 8 shows software overview for Web application. Web server and Servlet/Jsp container are working by Tomcat. Struts framework can work on Servlet/Jsp container.
Table 5Software development environment. Open source and free ware are publicly available
Open Source OS: Linux Fedora 20 IDE: Eclipse 4.3.2 (KEPLER)
Java: 1.7.0_55
Application Framework: Struts 1.3.10
Web container/HTTP/Web server: Tomcat 7.0.53 Database: HSQLDB 2.3.2
Machine learning library: LibSVM 3.18
Free ware
Fig. 8Software overview for Web Application. The Hypertext Transfer Protocol (HTTP) is an application-level protocol to connect web browser with web application on Tomcat server. ActionForm for model, JspPage for view, and ActionClass for controller to operate 7 domain objects are consisted in software for web application
The prototype System with Struts framework are integrated by three components of ActionForm, ActionClass, and JspPage to operate 7 domain objects.
Application
Side effect Prediction There are two services of side effect prediction and incidence pre-diction for Web application. Figure 9 shows operation screens for side effect prepre-diction. When the input data is received, side effects are classified by the input data and shows its result. Figure 10 shows operation screens for incidence prediction. When one dataset of 3 input items is received from input form, its incidence is calculated by LibSVM using class Runtime. Those 3 input items correspond to the explanatory variables of “SCORE”, “ATC”, and “Gene ID” shown in Table 2, and Equation 3. After that, the result of calculation is displayed.
Drug Discovery by new uses for old drugs There are two approaches. The first approach is to discover drug candidates in new chemicals (drugs)-proteins (disease genes) interactions. ADrugCandidateCatalogobject shown in Fig. 6 offers a service to search new chemicals (drugs)-proteins (disease genes) interactions by disease gene. Moreover, when a file group of “Drug Candidate” are directly operated by Linux commands, inter-active other genes can be searched by the drugs which are combined with disease genes. The second approach is to discover drug candidates in the disease group related by dis-ease genes and SNPs. Using SqlTool, disdis-eases can be grouped with the common SNP and gene. Diseases which has no drugs can find the drug candidates when other diseases in the same group have the drugs.
Results and discussion
Side effect prediction
The accuracy in the proposed Web application is evaluated using 9 drugs, which are not nominated in the SIDER 2 database and extracted from the side effect list of “The Internet Drug Index” [23].
Fig. 9Operation screen for side effect prediction. The left screen shows an input form for side effect prediction. The right screen displays the result which side effects are classified by 2 input items
cannot be predicted are as follows: 6 side effects are not nominated in this database; 7 side effects are not be classified although they are nominated in this database.
As for incidence prediction, there are 335 items to be predicted in side effect incidence. They are predicted according to each dataset shown in Table 2. Table 6 shows that 99.7 % of 335 items in Dataset No. 1 gets the approximated intervals of incidence, and that 0.3 % of them gets the higher intervals in the prediction. It will conclude that the gene informa-tion is useful for incidence predicinforma-tion, and that the score as biological feature to extract regression characteristics of side effect contributes to predicting side effect incidence.
Thus, the proposed model can predict the approximation of side effect and its incidence. This is an important result of the prediction model. When clinical data of drugs are not prepared for drug screening, pinpoint data which shows drug properties are available for predicting side effect by the proposed model.
Drug discovery by new uses for old drugs
Fig. 10 Operation screen for incidence prediction. The left shows an input form for side effect incidence. The right screen displays the result which side effect incidence is calculated with 3 input items by LibSVM
new combinations by excluding Gene IDs nominated in the first result from Gene IDs nominated in the second result.
As a result, 32 new drug candidates of old drugs can be found. Among them, three drug candidates for three genes which has no drugs in the KEGG database and one drug candidate for one gene which has some drugs in the KEGG database are discovered as a therapeutic agent. The former three new drug candidates are “hydroxyurea” for NBN gene of primary immunodeficiency or congenital disorder of DNA repair systems, “probucol” for COG1 gene of inherited metabolic disease, and “pyridoxine” for SLC25A38 gene of
Table 6Performance of incidence prediction
Dataset No. Approximated interval Higher interval
1 99.7 % 0.3 %
2 97 % 3 %
3 11 % 89 %
4 98 % 2 %
5 76 % 24 %
6 71 % 29 %
7 44 % 56 %
hematologic disease. The latter one drug is “IMIQUIMOD” for TLR9 gene of immune system disease.
In the second approach of discovering drug candidates in the disease group related by disease genes and SNPs, the number of disease which can discover the new drug candidate is evaluated. The procedure of extracting diseases which can discover new drug candidate is as follows: first, to extract diseases which have the common SNPs or disease gene from two tables of “Gene” and “Jsnp”; second, when some diseases have the common SNP or disease gene, those diseases are related with each other and grouped with the grouping tool developed in Java.
As a result, 717 diseases in which 174 diseases have the drugs are classified into 187 groups. 93 groups have no drugs. 94 groups have some diseases which have some drugs. Then, 328 disease can discover the new drug candidates by the disease group.
Conclusion
This paper describes database application model and its service for drug discovery introducing our proposed software development process in MDA into our research pro-cess. The issue of veracity can be solved when pinpoint data are selected from drug properties in big data analytics with domain model. The datasets of pinpoint data are designed to predict side effect and its incidence even if some of pinpoint data are missing. The proposed prediction model of side effect and its incidence can attain almost 100 % accuracy in its performance. In addition to our first research goal of side effect predic-tion in drug discovery, we can discover 2 new services for drug discovery by new uses for old drugs in logical system model with big data analytics. The veracity can be strength-ened based on the number of disease gene directly interacted to chemicals (drugs) and the number of the disease gene and SNPs contributing to human disease. So far, it can be concluded that the reputation of data modeling with data analytics and implementation can strengthen the “veracity” of big data.
Our approach of software development process in MDA will be useful for devel-oping a big data application and a new service by “veracity” and “value” of big data because MDA provides an approach for deriving value from models and architecture. Our proposal will contribute to the personalized drug discovery with drug screening of side effect prediction in the personalized medicine although our proposed system is comprehensive.
Competing interests
The author declare that she has no competing interests.
Authors’ contributions
NE designed the study, developed the models, implemented the system, performed the analysis and evaluation and wrote the manuscript. And NE read and approved the final manuscript.
Acknowledgments
This work was supported by Japan Science and Technology Agency in a CREST research program entitled “Advanced Application Technologies to Boost Big Data Utilization for Multiple-Field Scientific Discovery and Social Problem Solving”.
Received: 28 May 2015 Accepted: 23 July 2015
References
1. Suresh J (2014) Bird’s eye view on “big data management”. In: Proceedings of 2014 Conference on IT in Business, Industry and Government (CSIBIG): 08-09 Mar 2014. IEEE: Madhya Pradesh Subsection, India. pp 1–5.
2. Model Driven Architecture (MDA): The MDA Guide Rev 2.0, OMG Document Ormsc/2014-06-01 (2014). http://www. omg.org/cgi-bin/doc?ormsc/14-06-01
3. Repurposing Drug (2015). http://www.ncats.nih.gov/research/reengineering/rescue-repurpose/rescue-repurpose. html
4. Zhao XM, Iskar M, Zeller G, Kuhn M, van Noort V, Bork P (2011) Prediction of drug combinations by integrating molecular and pharmacological data. PLOS Comput Biol 7(12):e1002323. doi:10.1371/journal.pcbi.1002323 5. Rising Reports of Bad Reactions to Drugs Mar 28 2011 (2011).
http://www.reuters.com/article/2011/03/28/us-rising-reports-badreactions-drugs-idUSTRE72R65Z20110328
6. Tailor-made Medical Treatment Program (2015). http://www.biobankjp.org/english/leaflet/about.html 7. Yamanishi Y, Pauwels E, Kotera M (2012) Drug side-effect prediction based on the integration of chemical and
biological spaces. J Chem Inf Model 52(12):3284–3292. doi:10.1021/ci2005548
8. Kuhn M, Al. Banchaabouchi M, Campillos M, Jensen L, Gross C, Gavin A, Bork P (2013) Systematic identification of proteins that elicit drug side effects. Mol Syst Biol. 9(663). doi:10.1038/msb.2013.10
9. Okada Y (2013) Genetics of rheumatoid arthritis contributes to biology and drug discovery. Nature 506(7488). doi:10.1038/nature12873
10. Rheumatoid Arthritis Research Shows the Potential of Large-scale Genetic Studies for Drug Discovery (2013). http:// www.riken.jp/en/pr/press/2013/20131226_1/
11. KEGG DISEASE (2014). http://www.genome.jp/kegg/disease/
12. Anatomical Therapeutic Chemical (ATC) Classification (2015). http://www.genome.jp/kegg-bin/get_htext?& extend=&htext=br08303.keg
13. Hirakawa M, Tanaka T, Hashimoto Y, Kuroda M, Takagi1 T, Nakamura Y (2002) Jsnp: a database of common gene variations in the japanese population. Nucleic Acids Res 30(1):158–162
14. Haga H, Yamada R, Ohnishi Y, Nakamura Y, Tanaka T (2002) Gene-based snp discovery as part of the japanese millennium genome project : identification of 190,562 genetic variations in the human genome. J Hum Genet 47(11):605–610
15. JSNP DATABASE (2015). http://snp.ims.u-tokyo.ac.jp/ 16. STITCH 4.0 (2014). http://stitch.embl.de/
17. Kuhn M, Campillos M, Letunic I, Jensen LJ, Bork P (2010) A side effect resource to capture phenotypic effects of drugs. Mol Syst Biol 6(343). doi:10.1038/msb.2009.98
18. SIDER 2 Side Effect Resource (2014). http://sideeffects.embl.de/ 19. PubChem (2014). http://pubchem.ncbi.nlm.nih.gov/#
20. Anatomical Therapeutic Chemical Classification System (2015). http://en.wikipedia.org/wiki/Anatomical_ Therapeutic_Chemical_Classification_System
21. LIBSVM A Library for Support Vector Machines (2014). https://www.csie.ntu.edu.tw/~cjlin/libsvm/ 22. Book Management System (bcat) (2004). http://bcat.fujiwaralab.net/download.html
23. The Internet Drug Index, RxList Inc (2015). http://www.rxlist.com/script/main/hp.asp
Submit your manuscript to a
journal and benefi t from:
7Convenient online submission 7Rigorous peer review
7Immediate publication on acceptance 7Open access: articles freely available online 7High visibility within the fi eld
7Retaining the copyright to your article