ABEPRO
DOI: 10.14488/BJOPM.2019.v16.n2.a15
EVALUATION OF TOTAL OIL AND GREASE WITH FLOW CONTROL FOR MATURE OIL
FIELDS IN THE CONTEXT OF INDUSTRY 4.0
ABSTRACT
Goal: Industry 4.0 enables the design of new models for process monitoring in which
sensors, analyzers, and controls are positioned at different points in the process. The goal of this work is to present the modeling and control of a three-phase production separator with hydrocyclones to treat produced water on an oil platform of mature fields.
Design / Methodology / Approach: The Methodology or approach used was to develop a
model for the primary separator that allows its operation by means of a controller (fuzzy and PI) to manipulate the flow of discarded water, acting indirectly in the oil-in-water measure.
Results: The results showed the consistency of the model for open loop simulations and
the effectiveness of the controllers to comply with the discarding requirements for the closed-loop simulations.
Limitations of the investigation: The limitation of the model and developed controllers
is that they are only applied to platforms where water production exceeds the separators discharge capacity and the exceeding water can be offloaded to another equipment or to another platform.
Practical implications: The main practical implications of this study are to maximize the
flow of discarded water on mature field platforms, which produces elevated amounts of water, to conform the total oil and grease to the local law regulations. Additionally, it also increases oil production, with a higher limit of water production.
Originality / Value: Compared to the previous authors, where the models of discarded
flow is a function of the water-oil interface, this work developed a model that allowed the flow of the discarded water to be a function of its quality.
Keywords: Industry 4.0; Primary oil processing; Produced water; Fuzzy control; PID
con-trol.
Juracy Leandro do Nascimento [email protected]
Petróleo Brasileiro S.A. - Petrobras, Macaé, Rio de Janeiro, Brazil.
Alessandro Copetti [email protected] Fluminense Federal University – UFF, Rio das Ostras, Rio de Janeiro, Brazil.
Luciano Bertini [email protected]
Fluminense Federal University – UFF, Rio das Ostras, Rio de Janeiro, Brazil.
Patrick Barbosa Moratori [email protected] Fluminense Federal University – UFF, Rio das Ostras, Rio de Janeiro, Brazil.
Mário Cesar Mello Massa de Campos
1. INTRODUCTION
Research in the area of oil and gas is noticeably scarce, since it is an area of specific processes whose managers are more closely linked to this industry than to the academy. In the area of Integrated Operations (IO), the work presented in Lima et al. (2015) stresses the importance of integrating people, processes, and technologies, to make faster deci-sion-making based on real-time data. In Castro et al. (2015), the importance of the integration between portfolio, proj-ects, production operations, and resource allocation is also addressed, adding value to an organization. Both papers are literature reviews that emphasize the importance of pro-duction optimization with real-time data and process auto-mation, which is the objective of this article. This research automates a task that until now was performed manually and with significant delays in decision-making, in the order of hours. In Martins et al. (2018), another review of the lit-erature is presented, integrating reliability concepts with Condition Based Maintenance and Prognostic Health Man-agement, applied in the prevention of blow-out in oil pro-duction wells. Improving control systems, which is the pur-pose of this paper, is as important as improving reliability, and is also a goal of the future integrated industry. This work applies the aforementioned concepts to optimize the treat-ment of oil on production platforms.
Oil is extracted from natural reservoirs in a multiphase form, containing oil, gas, and water. The platform that ob-tains this mixture will perform the method known as prima-ry oil processing.
Primary oil processing is the first separation step to which oil is subjected as soon as it reaches the surface. At this stage, the three phases are separated in the gravitational separa-tors. In addition, it is still necessary to treat the oily phase to reduce the emulsified water content and the salts dissolved therein so as to satisfy the minimum export requirements. The gaseous phase also needs to be treated to reduce the water (vapor) content and other contaminants so that it is sent to treatment terminals by means of a pipeline. In addi-tion to oil and gas, produced water also requires treatment for disposal at sea or reinjection (Brasil et al., 2014).
In the context of primary oil separation, produced water is the water from the well that reaches the sea surface and must be treated. Discarded water is the one that will be dis-posed into the sea after proper treatment. This work specifi-cally investigates the water–oil separation system, with a fo-cus on maximizing discarded water, since this is a necessary operation in mature oil fields.
The amount of produced water is aggravated during oil extraction. In order for oil production in the producing wells to not be reduced rapidly, it is crucial that water be
injected into the reservoir to maintain its pressure. This wa-ter, which is injected through injector wells, is eventually produced as a byproduct along with petroleum. Therefore, in mature fields, the production of water increases, which hinders the process and reduces the economic useful life of the field. In addition, as the oil industry has evolved and increased its production, requirements for water (TOG: to-tal oil and grease content) and oil export (BSW: basic sedi-ment and water) have become more restrictive (the TOG for water discard must be less than 29 ppm, according to Art. 5 of Resolution 393/07 of Brazilian National Environment Content (Conselho Nacional de Meio Ambiente – CONAMA) and the BSW for export must be less than 1% according to the Joint Resolution ANP / Inmetro no.1 of June 10, 2013), and the improvement of equipment and control strategies is required. Technologies for oil and water treatment, such as hydrocyclones, floats, and dual-polarity and dual-frequency tracers, have emerged. These technologies have introduced greater complexity into plants. Consequently, the area of process control has also evolved.
In this context, some authors have developed phenome-nological models based on mass and momentum balances that, together with population balances, made it possible for one to estimate the dispersion separation efficiencies, simulate the separation systems, and test the control strat-egies (Nunes, 2007). These models supported the develop-ment and optimization of control strategies. It is important to emphasize that the works of Nunes (2007), Filgueiras (2005), Silveira (2006), Ribeiro et al. (2016), and Backi et al. (2018), dealing with the modeling of production separators, consider the realization of interface control in the separa-tion chamber, where all available water is separated. The control that is performed is thus efficient; however, in many cases, it is not implemented for practical reasons, as will be explained below.
Brazilian Journal of Operations & Production Management Volume 16, Número 2, 2019, pp. 358-370
DOI: 10.14488/BJOPM.2019.v16.n2.a15
The objective of this work is to propose a controller for the water discharge rate that considers its quality, measured in terms of the TOG, and applies it to cases in which it is not possible to perform the water–oil interface control owing to the excess of produced water. The proposed controller aims to maximize the flow of discarded water while maintaining the requirements established by legislation. Accordingly, the strategy adopted consists of modeling the three-phase hor-izontal production separator, considering that only part of the free water that arrives in the production separator will be discarded.
In order to meet the proposed control strategy, two inno-vations will be applied, considering Industry 4.0. Firstly, the use of TOG meters is required. Early models of TOG meters displayed a number of operational problems. The advance-ment of technology, however, has enabled the creation of more robust sensors that allow the use of this control strat-egy. Second, to test the proposed controller, modifying the conventional models mentioned was mandatory.
This paper presents a simplified model of a primary pro-cessing unit and produced water treatment composed of a production separator and a battery of hydrocyclones. The production separator is modeled by modifying the model proposed by Nunes (2007) and Backi et al. (2018). Their ap-proach considered separators in which water-oil interface control and discharge flow were determined by the water– oil separation kinetics in the separator. Since this work pro-poses the use of a TOG controller instead of the interface control, it needs a model that would allow the flow of the discarded water be a function of its quality.
Additionally, two controllers will be tested for the quality of the discarded water, whose manipulated variable will be the discard rate. The controllers chosen were a convention-al proportionconvention-al integrconvention-al control (PI) and a fuzzy proportionconvention-al derivative control (fuzzy PD). Finally, both controllers will be compared considering the discharge flow and the setting of the quality parameters of fluids produced within the re-quirements permitted by law. The PI controller is the most common in the industry and is applied to slow processes. Furthermore, as the fuzzy controller can be designed to be-have according to the human deductive reasoning, it can take actions based on specialist knowledge.
The proposed solution develops a new approach for the control of oil-in-water concentrations in the processes of primary oil separation, based on an integrated view, made possible by industry 4.0. The application of these control-lers will lead to the maximization of discarded water flow in the production separators of mature field platforms. That will occur without overloading equipment downstream and while maintaining the requirements imposed by legislation; it can possibly provide oil production gains.
2. PRIMARY OIL PROCESSING
Oil is a naturally occurring blend. It consists predom-inantly of hydrocarbons and organic sulfur, nitrogenous, and oxygenated products. It is apparently a homogeneous substance; however, it contains a mixture of liquid and solid gases whose characteristics vary according to the producing field. Thus, petroleum, in its natural state and at room tem-perature, is a dispersion of gases and solids in a liquid phase and may be in the Newtonian or non-Newtonian state as a function of temperature (Farah, 2012).
Fluid streams from different wells that arrive through pro-duction manifolds to the surface, on land or on platforms, are not yet suitable for use or export. In addition to the oil and gas phases, an oil well usually produces water after a certain time of operation, either because it is initially pres-ent in the reservoir, or by its injection, in a process aimed at maintaining the reservoir pressure, i.e., the increase in oil recovery. Thus, it is essential that maritime or terrestrial fields be equipped with production facilities for the gas–oil– water separation (Kunert, 2007).
In marine fields, primary oil processing is usually per-formed on oil production platforms. Initially, primary sep-aration of the fluid streams produced is performed and, subsequently, the gas, oil, and water phases are individual-ly treated. The oil phase is used to reduce the emulsified water content and the salts dissolved therein; the gaseous phase is treated to reduce the content of water and other contaminants; the water phase is separated from the oil for disposal or reinjection into producing wells. This treatment during the production aims to satisfy the oil and gas export requirements as well as the requirements for the disposal of produced water (Brasil et al., 2014).
In order to satisfy legal requirements, oil production plat-forms rely on a processing plant that normally contains grav-itational separating vessels in series or in parallel and can have various configurations depending on the desired sep-aration quality or the characteristics of the fluids produced.
The water from the gravitational separators is sent to the water treatment plant. This unit may contain hydrocyclones and floats. Hydrocyclone is a static piece of equipment in a conical format with the function of reducing the oil content of water. Floats are vessels where microbubbles that aggre-gate the oily particles present in the water and carry them to the surface are produced.
Gravitational fluid separation
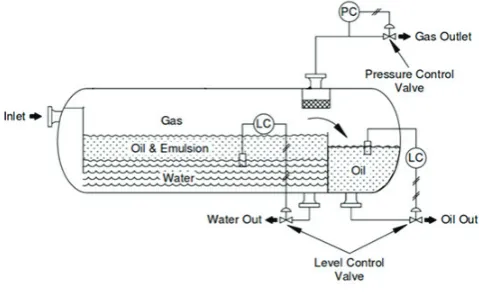
to the diff erence of density between the phases in a cylindri-cal pressure vessel (gravitati onal separator). The separators can segregate two or three phases, depending on whether it is desired to separate the free water, and can be horizon-tal or verti cal. In additi on to phase separati on, these vessels have the functi on of absorbing the oscillati ons in the pro-ducti on fl ow of the wells (Filgueiras, 2005). In this work, a horizontal three-phase producti on separator will be mod-eled (See Figure 1).
Figure 1. Three-phase horizontal separator Source: adapted from Arnold and Stewart (2008).
In the three-phase separators, there is a spillway that delimits the separati on zone of the oil chamber. In the sep-arati on chamber, there remain gas droplets, which, upon release, migrate to the gas phase. Further, as the aqueous phase is denser than the oil phase, it tends to move to the bott om of the separati on chamber, from where it is with-drawn. The oil migrates to the top of the separati on cham-ber and fl ows into the oil chamcham-ber, where it is also removed. The separati on chamber can rely on wave breaking baffl es, which are devices used to reduce the eff ect caused by the platf orm’s balance, or coalescing plates, which are parallel plates that promote the coalescence of the dispersed phases (Arnold and Stewart, 2008).
Notably, there must be suffi cient residence ti me in the vessel for the separati on of the water and oil phases to oc-cur. Thus, the equipment must be designed properly. The lower the fl ow, the longer the residence ti me is, and conse-quently, the greater the separati on is.
The design and dimensioning of this equipment is based on Stokes’ law, which calculates the terminal velocity of the dispersed phase droplets. This law is shown in Equati on 1.
, (1)
where
ρc: density of the aqueous phase;
ρd: density of the oil phase;
d: diameter of the dispersed phase droplets;
µc: viscosity of the conti nuous phase;
ν: terminal drop velocity of the dispersed phase in the conti -nuous phase.
From Equati on 1, it becomes observable that the greater the diff erence in density between oil and water, the larger the dispersed phase droplets. Alternati vely, the lower the viscosity of the conti nuous medium, the easier the separa-ti on in the three-phase gravitasepara-ti onal separator will be.
3. PROPOSED MODEL
Nunes (1994) developed a mathemati cal model of the three-phase separator. Their model achieves the separati on processes of water–oil and oil–water emulsions, consider-ing the thermodynamic phase equilibria and the interfer-ence of the vessel control. Nunes analyzed the performance of the separator through studies of the parameters of the controllers, the variati ons of the loads, and the geometry of the internal devices of the vessel. The work of Nunes (2007) presents a simplifi cati on of the model of Nunes (1994) by eliminati ng the need for the calculati on of thermodynamic equilibrium.
Filgueiras (2005) conti nued the work of Nunes (1994) and Nunes (2001). The three-phase separator model proposed by the author uses the Nunes (1994) model with some sim-plifi cati ons: the phase densiti es are the same, the thermal eff ects are neglected, the internal devices considered are parallel plates, and there is no liquid drag through the gas phase.
Yayla et al. (2017) developed a two-dimensional compu-tati onal fl uid dynamics model for coalescing plates to inves-ti gate the infl uence of the fl ow type and the shape of the plates on the separati on effi ciency.
Othman et al. (2018) make a theoreti cal and experimen-tal investi gati on of a horizonexperimen-tal pipe separator, presenti ng a model that considers mixture velocity and BSW in the sepa-rati on effi ciency calculati on.
Brazilian Journal of Operati ons & Producti on Management
Volume 16, Número 2, 2019, pp. 358-370 DOI: 10.14488/BJOPM.2019.v16.n2.a15
plus oil) and water as well as the gas pressure subject to in-put and outin-put dynamics. In additi on, algebraic equati ons that calculate simplifi ed droplet distributi ons for each con-ti nuous phase are introduced to determine the exchange of water and oil between the two conti nuous phases.
This work is based on the models proposed by Nunes (2007), Filgueiras (2005), and Backi et al. (2018). Adapta-ti ons were made in order to allow representaAdapta-ti on of the pro-ducti on separators whose discharge fl ow is limited by the quality of the discarded water and not by the water–oil sep-arati on kineti cs. Thus, if control of this interface is achieved, the fl ow of discarded water would be higher than the fl ow at which the treatment system can sati sfy legal requirements. Therefore, this model can only be applied to separators whose water–oil emulsion presents easy separati on and if the separated oil in the oil chamber has free water.
Figure 2 shows the system that will be modeled. This sys-tem will require an in-line TOG meter installed in the wa-ter outlet of the hydrocyclones. The control of TOG will be performed by controlling the fl ow of water discarded by the separator. The proposed controller will receive the TOG me-ter signal and act on the valve located downstream of the hydrocyclones—i.e., the controlled variable is the TOG in the hydrocyclones water outlet fl ow and the manipulated variable is the opening of the water discard valve. If the TOG shows a value above the setpoint, the water discard valve closes, increasing the residence ti me of the water in the
separator and reducing the TOG value to the setpoint. If the TOG is below the setpoint, the discharge valve opens, the fl ow rate is discarded, and the TOG increases.
A change adopted in this model was the esti mati on of the volume where the coarse water–oil separati on occurs, i.e., the volume where the complete separati on of the mixture has not yet occurred and which was not considered in the calculati on of the residence ti me of the producti on separa-tor’s water chamber (see Equati on 2).
, (2)
where
: emulsion volume in the separati on chamber;
: oil phase inlet fl ow rate;
: water phase inlet fl ow rate;
: separati on ti me of the oil–water mixture.
Equati on 3 shows the volume of the separati on cham-ber whereas equati ons 4 and 5 show the volumes of the oil chamber and the gas phase, respecti vely. These equati ons were developed from geometric relati ons.
, (3)
, (4)
The pressure variati on in the vessel is given by Equati on 8.
, (8)
where
: inlet gas fl ow rate;
: outlet gas fl ow rate;
: pressure.
Equati on 9 shows the variati on of the volume of water in the oil phase of the oil chamber.
, (9)
where
: water volume in the oil chamber.
The outlet fl ows of water, oil, and gas are defi ned by the opening and characteristi cs of the control valves. The cor-relati ons obtained in the Masoneilan valve manufacturer’s control valve designing handbook (2000) were used to cal-culate the valve fl ow rates. Equati ons 10, 11, and 12 express the outlet fl ows of water, oil, and gas, respecti vely.
, (10)
, (11)
, (12)
where
: maximum discharge coeffi cient of the gas valve;
: maximum discharge coeffi cient of the oil valve;
: maximum discharge coeffi cient of the water valve; , (5)
where
: volume of the separati on chamber;
: volume of the oil chamber;
: total volume of the separator;
: diameter of the separator;
: length of the separati on chamber;
: length of the oil chamber;
: height of the weir;
: height of liquid in the oil chamber.
The volume of the aqueous phase in the separati on chamber is calculated by obtaining the diff erence between the separati on chamber volume and the water–oil mixture volume, as shown in Equati on 6.
, (6)
where
: volume of water in the separati on chamber.
Equati ons 7 and 8 were developed through the mass bal-ance in the oil chamber and the space occupied by the gas. The variati on of the height in the oil chamber is given by Equati on 7.
, (7)
where
: inlet fl ow rate of the water phase;
: inlet fl ow rate of the oil phase;
: outlet fl ow rate of the separati on chamber;
Brazilian Journal of Operati ons & Producti on Management
Volume 16, Número 2, 2019, pp. 358-370 DOI: 10.14488/BJOPM.2019.v16.n2.a15
: viscosity of the conti nuous phase;
: opening fracti on of the oil valve;
: opening fracti on of the water valve;
: specifi c gravity of water;
: specifi c gravity of oil;
: specifi c gravity of gas;
: molecular weight of gas;
: pressure downstream of oil and water valves;
: pressure downstream of gas valve;
: gas constant;
: temperature;
: specifi c mass of oil;
: specifi c mass of water.
To esti mate the TOG of the stream of water leaving the producti on separator, an alternati ve model to the separa-ti on effi ciency model based on the phenomenological mod-eling presented by Nunes (2007) will be adopted. Nunes et al. (2010) used platf orm operati on data to generate an ex-perimental correlati on for TOG calculati on. Accordingly, they evaluated the TOG of the discarded water at three diff erent water interface oil heights in the separati on chamber and constructed a TOG curve × water residence ti me. This model was used in this study. Nunes et al. (2010) proposed Equa-ti on 13.
, (13)
where
TOGSG: TOG in the water outlet of the producti on separator;
TR: residence ti me of the aqueous phase, which is calculated using Equati on 14.
,(14)
For the calculati on of the separati on effi ciency in the hy-drocyclones, a correlati on developed by Nunes and Lima (2006) was used for a given hydrocyclone geometry and
drop diameter distributi on. This correlati on is shown in Equati on 15.
, (15)
where
A: 3619.6 – 1775039.5 • Wout;
b: 208.9;
Split: rati o between overfl ow and underfl ow in hydrocyclo-nes.
Aft er calculati ng the effi ciency, the TOG at the hydrocy-clone’s exit is calculated by using Equati on 16.
, (16)
where
TOGH: TOG in the hydrocyclones’ water outlet.
4. RESULTS
This secti on analyzes the results of the models for the separator and the hydrocyclones. Additi onally, the dynamic simulati on verifi ed the response of the proposed controllers to the variati ons in the the system’s inlet fl ows. The simu-lati ons were performed using MATLAB-Simulink version 2014a.
Production separator simulation
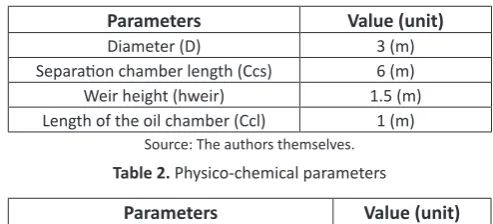
The data of fl ows and dimensions used in the simulati on are of typical real equipment. Tables 1 and 2 show the di-mensions of the separator and its physico-chemical param-eters, respecti vely.
Table 1. Dimensions of the separator
Parameters Value (unit)
Diameter (D) 3 (m)
Separati on chamber length (Ccs) 6 (m) Weir height (hweir) 1.5 (m) Length of the oil chamber (Ccl) 1 (m)
Source: The authors themselves. Table 2. Physico-chemical parameters
Temperature (T) 333.15 (K) Gas molar mass (MWg) 21 (kg/kmol) Specific mass of water (ρw) 999 (kg/m³) Specific mass of oil (ρl) 850 (kg/m³) Viscosity of water (µw) 0.001 (kg/(m/s))
Viscosity of oil (µl) 0.0171 (kg/(m/s)) Source: The authors themselves.
The oil inlet flow rate is considered to be equal to the water inlet flow rate, i.e., the input BSW is 50%. The TOG × residence time curve, generated from Equation 13, is shown in Figure 3.
700 600 500 400 300 200 100 0
4 4,5 5 5,5 6 6,5 7 7,5 8
TOG (ppm)
Residence �me (min)
TOG at produc�on separator output (TOGSG)
Figure 3. TOG at production separator output × residence time Source: The authors themselves
As previously mentioned, the residence time is a function of the aqueous phase volume in the separator and the wa-ter discharge rate. The aqueous phase volume is given by the volume of the (constant) separation chamber subtracted from the volume of the emulsified layer of the separation chamber which, in turn, is a function of the inlet flow rate, according to Equations 2, 6, and 14.
The TOG curve at the production separator output × dis-carded water flow rate for different raw input flow rate (Qi) values is shown in Figure 4.
As expected, the TOG of the separator water outlet in-creases with the increase at the discarded water flow rate and at the inlet flow rate in the separator.
900 800 700 600 500 400 300 200 100 0
0,4 0,5 0,6 0,7 0,8
TOG (ppm)
Discard Flow Rate (m³/s)
TOG at produc�on separator output (TOGSG)
Qi = 0,32 m³/s Qi = 0,24 m³/s Qi = 0,16 m³/s
Figure 4. TOG at the production separator output × water discharge rate
Source: The authors themselves.
Hydrocyclones simulation
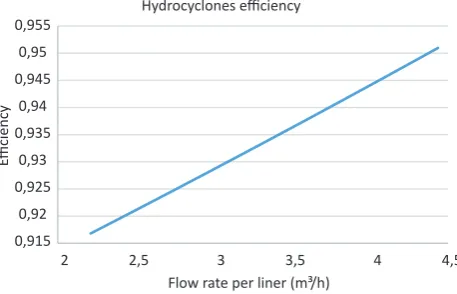
For the simulation of the hydrocyclones, it was necessary to define the number of liners (sections of conical tubes that compose the hydrocyclones) and the reject ratio. The num-ber of liners was defined in order to maintain the flow rate within the acceptable range for hydrocyclones (2–6 m³/h). The reject ratio was defined so that TOG presented sensitivi-ty to this change, with a discharge rate limited to the separa-tor model. The number of established liners was 65, and the reject ratio was 4.9%. If the reject ratio is assigned a value greater than 5%, the discharge rate would be larger and be-yond the range of the separator model. If it were assigned a lower value, the discharge rate would be lower, and the TOG variation would be less significant. Thus, an efficiency curve of the hydrocyclones with respect to the flow in each liner is drawn (see Figure 5).
0,955 0,95 0,945 0,94 0,935 0,93 0,925 0,92 0,915
2 2,5 3 3,5 4 4,5
Efficiency
Flow rate per liner (m³/h) Hydrocyclones efficiency
Brazilian Journal of Operations & Production Management Volume 16, Número 2, 2019, pp. 358-370
DOI: 10.14488/BJOPM.2019.v16.n2.a15
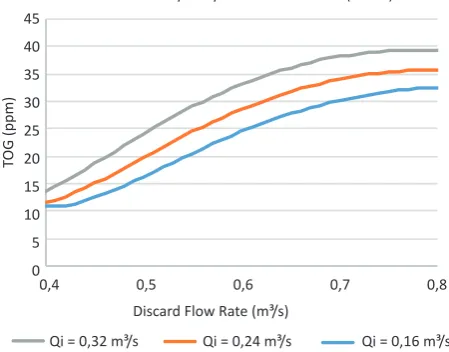
With the efficiency data of the hydrocyclones in relation to the flow rate per liner and TOG of the production sep-arator output in relation to the discharge flow rate, it was possible to construct a curve of TOG at the exit of the hydro-cyclones × discharge of water, which is shown in Figure 6.
45 40 35 30 25 20 15 10 5 0
TOG on the Hydrocyclone Water Outlet (TOGH)
0,4 0,5 0,6 0,7 0,8
TOG (ppm)
Discard Flow Rate (m³/s)
Qi = 0,32 m³/s Qi = 0,24 m³/s Qi = 0,16 m³/s
Figure 6. TOG at hydrocyclone output × discarded water flow Source: The authors themselves.
Dynamic simulation
This section shows the dynamic simulation developed to verify the actuation of the controllers against the variations in the inlet flows.
The proposed system model was implemented using an s-function in MATLAB, as was done in the works of Ribeiro (2012) and Silveira (2006). This choice is justified by the low-er difficulty of solving the difflow-erential equations (integration with time) offered by this method. The maximum interval for the integration was 10 s, as in the work of Filgueiras (2005), and the minimum interval was in accordance to the automatic mode.
Two controllers were tested to guarantee the quality of the discarded water and to operate with the maximum flow of water. The controllers chosen were a PI and a fuzzy PD.
In addition to the proposed TOG control of discarded wa-ter, there are two other controllers: a level controller in the oil chamber and a separator pressure controller. PI control-lers were adapted for both cases. Notably, the use of the PID controller is avoided for level and pressure, as the noise gen-erated at the pressure and level measurement when associ-ated with the derivative term of the controller can generate undesired actions.
The pressure setpoint adopted was 9 kgf/cm², the level setpoint was 1 m, and the TOG setpoint was 29 ppm. The initial conditions, controller parameters, and valve data used in the simulation are shown in Table 3.
Table 3. Parameters used for dynamic simulation
Parameter Value (unit)
Gas valve discharge coefficient (Cvmaxg) 400 Water valve discharge coefficient (Cvmaxw) 512.5 Liquid valve discharge coefficient (Cvmaxo) 1025 Level controller proportional gain 4
Level controller integral gain 0.15 rep/s Pressure controller proportional gain 4
Pressure controller integral gain 0.1 rep/s Initial value of the level controller integrator
term 0.2
Initial value of the pressure controller
integra-tor term 0.228
Initial liquid height in oil chamber 1 (m) Initial pressure in the production separator 9 (kgf/cm³)
Initial BSW of the oil chamber 13.6 (%)
Level meter range 1 m
Pressure gauge range 20 (kgf/cm³) Source: The authors themselves.
Two experiments were performed to test the controllers. The first involved applying a step perturbation by doubling the inlet flow of the system, and the second consisted of ap-plying a sinusoidal disturbance. In both cases, the input BSW was maintained at 50%. In the scenario of the application of the step perturbation, the gross inlet flow was initially 0.16 m³/s and reached 0.32 m³/s in 100 s. The simulation was performed up to 250 s. In the sinusoidal disturbance sce-nario, the amplitude was equal to 0.08 m³/s, the period was 180 s, and the average value was 0.24 m³/s. The disturbance started after 100 s of simulation and the total simulation time was 640 s. A dead time of 1 s was established between the controller output signal and the valve to simulate the valve delays, and a dead time of 10 s was established to sim-ulate the TOG analyzer delay.
To evaluate the controllers, the average TOG in the sim-ulation period, the highest TOG value, the time required for returning to the setpoint, and the integral of the absolute er-ror (IAE) will be considered. The IAE is a performance index that calculates the magnitude of the absolute error integral (see Equation 17) and allows an objective comparison be-tween the controllers.
,(17)
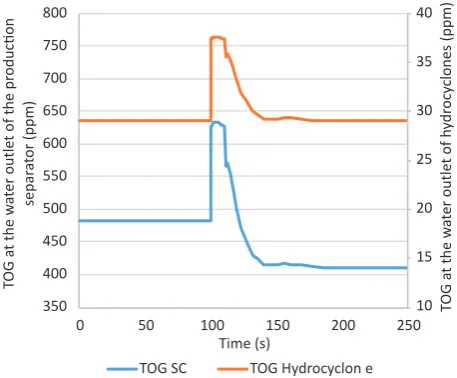
To simulate the PI controller, a proportional gain of 0.001, an integral gain of 0.0005, and an initial valve opening of 0.308 were used. The results of the step perturbation are presented in Figures 7 and 8, and the results of the sinusoi-dal perturbation are presented in Figures 9 and 10.
Figure 7 shows the PI control response for the step-type disturbance in the inlet flow. After 100 s of simulation, the peak of TOG at the exit of the separator occurs, owing to the increase in the volume without the complete separation between the phases. This effect is caused by the increase at the inlet flow rate. This indicates the reduction of the free water volume in the separation chamber and the reduction of the residence time, causing an increase in the TOG. As the discharge rate within 100 s had no variation, the efficien-cy of the hydroefficien-cyclones remained the same, and the TOG at the exit of the separator increased. Thus, the TOG at the hydrocyclones’s exit (right axis) also increased. The control-ler actuated the closing of the water discharge valve, and the TOG at the outlet of the separator stabilized at a lower value. The TOG at the exit of the hydrocyclones returned to the setpoint. The time required by the TOG of the discarded water to return to the normal value was approximately 41 s, its peak was 37.6 ppm, the TOG average was 29.7, and the IAE was 205.
0 50 100 150 200 250 TOG a
t the w
at
er outle
t of h
ydr
ocy
clones (ppm)
TOG a
t the w
at
er outle
t of the pr
oduc�on
separ
at
or (ppm)
Time (s)
TOG SC TOG Hydrocyclon e 40 35 30 25 20 15 10 800 750 700 650 600 550 500 450 400 350
Figure 7. Response of the TOG PI control to the step-type perturbation at the inlet flow rate
Source: The authors themselves.
In Figure 8, one is able to observe the closing of the water discharge valve owing to the action of the proposed quality controller, in response to the increase in TOG (on the right axis), and the reduction at the discharge flow rate (left axis). The mean flow rate discarded in the simulation time was 0.0616 m³/s. 0,6 0,55 0,5 0,45 0,4 0,35 0,3 0,25 0,2 0,08 0,07 0,06 0,05 0,04 0,03 0,02 0,01 0 W at er dischar ge v alv e opening Dischar ge W at er Flo w Ra te (m³ /s)
0 50 100 150 200 250
Time (s)
Discarded Water Valve Opening
Figure 8. Response of the discarded flow rate to the step-type disturbance at the inlet flow rate
Source: The authors themselves.
A sinusoidal disturbance was also applied to the inlet flow rate. As shown in Figure 9, after the onset of the dis-turbance, the TOG at the output of the separator increased owing to the increase at the inlet flow rate. However, as the increase was gradual, the controller acted to shut off the water outlet valve, reducing the flow of discarded water (as shown in Figure 10) and, consequently, the TOG peak was reduced. Subsequently, with the reduction in the inlet flow and consequent reduction in the TOG of the discarded wa-ter, the controller acted to open the valve and increase the discharge flow rate. This cycle was repeated with the same period of disturbance in the inlet flow. The peak was ob-served to be 32.3 ppm, the mean of the discarded TOG was 29 ppm, and the IAE was 989.
40 35 30 25 20 15 10 850 800 750 700 650 600 550 500 450 400 350
0 100 200 300 400 500 600 TOG a
t the w
at
er outle
t of h
ydr
ocy
clones (ppm)
TOG a
t the w
at
er outle
t of the pr
oduc�on
separ
at
or (ppm)
Time
TOG SG TOG Hydrocyclone
Figure 9. Response of the TOG PI control to the sinusoidal perturbation at the inlet flow rate
Brazilian Journal of Operati ons & Producti on Management
Volume 16, Número 2, 2019, pp. 358-370 DOI: 10.14488/BJOPM.2019.v16.n2.a15
W
at
er dischar
ge v
alv
e opening
Dischar
ge W
at
er Flo
w Ra
te (m³
/s)
Discarded Water Valve Opening 0,3
0,25
0,2
0,15
0,1
0,05
0
0 100 200 300 400 500 600
Time
0,6 0,55 0,5 0,45
0,4 0,35 0,3 0,25
0,2
Figure 10. Response of the discarded water fl ow rate to the sinusoidal disturbance at the inlet fl ow rate
Source: The authors themselves.
The fuzzy controller was defi ned as Mamdani type and defuzzifi ed by the centroid method as well as Paiva et al. (2016). For implementati on in MATLAB, a fuzzy module was used.
The fuzzy controller used was a fuzzy PD controller with two input variables, i.e., TOG and TOG variati on (derived from TOG), and an output variable, i.e., the change in valve positi on. The control surface (shown in Figure 11) presents the acti on of the control valve (controller output signal) for each combinati on of input signals.
Figure 11. Control surface Source: The authors themselves.
To simulate the system behavior with the fuzzy controller, the same perturbati ons and initi al conditi ons of the PI con-troller case were applied. Figure 12 shows the response of the fuzzy PD controller to the step-type perturbati on at the inlet fl ow rate.
0 50 100 150 200 250
Time (s)
40
35
30
25
20
15
10
TOG SG TOG Hydrocyclone
TOG a
t the w
at
er outle
t of h
ydr
ocy
clones (ppm)
TOG a
t the w
at
er outle
t of the pr
oduc�on
separ
at
or (ppm)
800 750 700 650 600 550 500 450 400 350
Figure 12. Response of the TOG fuzzy PD control to the step-type perturbati on at the inlet fl ow rate
Source: The authors themselves.
Aft er 100 s of simulati on (moment of the step applica-ti on), the peak of TOG occurred at the exit of the separator and the exit of the hydrocyclones owing to the sudden in-crease in the fl ow. Similar to the PI controller, the fuzzy PD controller actuated the closing of the water discharge valve. Subsequently, the TOG at the output of the separator stabi-lized at a lower value, whereas the TOG at the output of the hydrocyclone returned to the setpoint (29 ppm). The ti me required by the TOG of the discarded water to return to the setpoint was approximately 46 s, the peak was 37.6 ppm, the average TOG was 30 ppm, and the IAE was 260. It was verifi ed that, compared to that of the PI control, there was an increase in the ti me involved in reaching the setpoint, a reducti on of the TOG mean, and an increase in the IAE. How-ever, there was no change in the TOG peak, as the variati on was instantaneous, and there was no ti me for the control to reduce TOG.
In Figure 13, the closing of the water discharge valve and restricti on of the discharge fl ow can be observed. The mean fl ow rate discarded during the simulati on was 0.0575 m³/s.
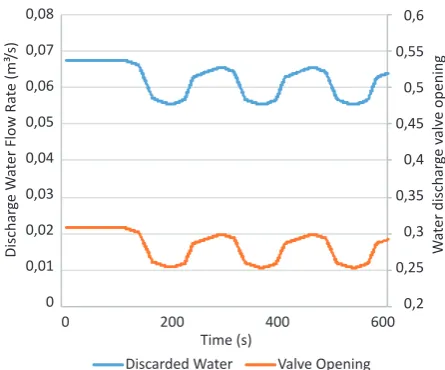
A sinusoidal disturbance was applied to the inlet fl ow. The TOG controller response and the TOG at the producti on separator outlet fl ow are shown in Figure 14. The TOG peak was observed to be 33.2 ppm, the TOG average was 29 ppm, and the IAE was 1068. The peak of TOG was 0.9 ppm higher than that of the PI controller. In additi on, an increase in IAE was observed.
0,08 0,07 0,06 0,05 0,04 0,03 0,02 0,01 0
Discarded Water Valve Opening
W at er dischar ge v alv e opening Dischar ge W at er Flo w Ra te (m³ /s) 0,6 0,55 0,5 0,45 0,4 0,35 0,3 0,25 0,2
0 50 100 150 200 250
Time (s)
Figure 13. Response of the discarded flow rate to the step-type disturbance at the inlet flow rate
Source: The authors themselves.
Time (s)
TOG SG TOG Hydrocyclone
TOG a
t the w
at
er outle
t of the pr
oduc�on
separ
at
or (ppm)
0 200 400 600
750 700 650 600 550 500 450 400 350 40 35 30 25 20 15
10 TOG a
t the w
at
er outle
t of h
ydr
ocy
clones (ppm)
Figure 14. Response of the TOG PD fuzzy control to the sinusoidal perturbation at the inlet flow rate
Source: The authors themselves.
The discarded water flow rate and the opening of the wa-ter discharge valve are shown in Figure 15.
Table 4. Comparison between controllers
Distur-bance troller Average Peak
Con-Time to return to
setpoint IAE
step PI 29.7 37.6 41 205
step Fuzzy PD 30 37.6 46 260
sinusoidal PI 29 32.3 - 989
sinusoidal Fuzzy PD 29 33.2 - 1068
0,08 0,07 0,06 0,05 0,04 0,03 0,02 0,01 0
Discarded Water Valve Opening
W at er dischar ge v alv e opening Time (s) 0,6 0,55 0,5 0,45 0,4 0,35 0,3 0,25 0,2 Dischar ge W at er Flo w Ra te (m³ /s)
0 200 400 600
Figure 15. Response of the discarded flow rate to the sinusoidal disturbance at the inlet flow rate
Source: The authors themselves.
5. CONCLUSIONS
This work presented the modeling of a separation and treatment unit for produced water, consisting of a produc-tion separator and a battery of hydrocyclones. A mathemat-ical model was developed for production separators whose input has high BSW and the water discharge rate is limited by the need to satisfy the minimum quality imposed by the legislation, which is a typical situation of production units operating in mature fields. It is proposed that the control of the discarded flow not be performed with the production separator interface control as is usually done, but rather be based on the TOG of the discarded water. In order for this control philosophy to be employed, the application of TOG meters is necessary. Thus, it is possible to optimize the pro-cess in real time, which is facilitated by Industry 4.0.
Both PI and Fuzzy PD controllers performed well and maintained the TOG of the discarded water within the legal requirements. The PI controller required less effort for param-eter adjustment than the fuzzy PD. Notably, the fuzzy PD con-troller is usually tuned by trial-and-error, and a large number of simulations are necessary to obtain the pertinence func-tions that generated good control outputs. This fact may be related to the marginally lower result of this controller. Nota-bly, such tests are difficult to perform on a real platform.
Brazilian Journal of Operations & Production Management Volume 16, Número 2, 2019, pp. 358-370
DOI: 10.14488/BJOPM.2019.v16.n2.a15
Received: 14 Dec 2018 Approved: 16 Apr 2019
DOI: 10.14488/BJOPM.2019.v16.n2.a15
How to cite: Nascimento, J. L.; Copetti, A.; Bertini, L. et al. (2019), “Evaluation of Total Oil and Grease with Flow Control for Mature Oil Fields in the Context of Industry 4.0”, Brazilian Journal of Operations & Production Management, Vol. 16, No. 2, pp. 358-370, available from: https://bjopm.emnuvens.com.br/bjopm/article/ view/663 (access year month day).
REFERENCES
Backi, C. J.; Brian A. G.; Skogestad, S. (2018), “A Control-and Estimation-Oriented Gravity Separator Model for Oil and Gas Applications Based upon First-Principles”, Industrial & Enginee-ring Chemistry Research, Vol. 57, No. 21, pp. 7201-7217. Doi: 10.1021/acs.iecr.7b04297.
Brasil, N. I.; Araújo, M. A. S.; Sousa, E. C. M. (Organizadores) (2014), Processamento de Petróleo e Gás: petróleo e seus deri-vados, processamento primário, processos de refino, petroquí-mica, meio ambiente, 2 ed., LTC, Rio de Janeiro.
Castro, J. F.; Lima, C.; Gutierrez, R. (2015), “Projects and ope-rations in the oil and gas E&P segment: a bibliographic panel”, Brazilian Journal of Operations & Production Management, Vol. 12, No. 2, pp. 306-320. https://doi.org/10.14488/BJOPM.2015. v12.n2.a10
Conselho Nacional de Meio Ambiente – CONAMA (2007), Re-solução nº 393, de 8 de agosto de 2007, dispõe sobre o descarte contínuo de água de processo ou de produção em plataformas marítimas de petróleo e gás natural, e dá outras providências, available fom: <http://www.mma.gov.br/port/conama/legia-bre.cfm?codlegi=541>. Accessed in Nov 01, 2017.
Farah, M. A. (2012), Petróleo e seus derivados: definição, constituição, aplicação, especificações, características de quali-dade, LTC, Rio de Janeiro.
Filgueiras, N. G. T. (2005), Modelagem, análise e controle de um processo de separação óleo/água, dissertação de mestrado em Engenharia Química, Universidade Federal do Rio de Janei-ro, Rio de Janeiro.
Kunert, R. (Ed.) (2007), Processamento primário de petróleo, Escola de Ciências e Tecnologias, Universidade Petrobras, Rio de Janeiro.
Lima, C. B. C.; Lima, G. B. A.; Quelhas, O. L. G.; Ferreira, R. N. (2015), “Integrated operations: value and approach in the oil industry”, Brazilian Journal of Operations & Production Ma-nagement, Vol. 12, No. 1, pp. 74-87. https://doi.org/10.14488/ BJOPM.2015.v12.n1.a8
Martins, F. B.; Cardoso, R.; Tammela, I.; Colombo, D.; Matos, B. A. (2018), “Applying CBM and PHM concepts with reliability approach for Blowout Preventer (BOP): a literature review”, Bra-zilian Journal of Operations & Production Management, Vol. 15, No. 1, pp. 78-95. https://doi.org/10.14488/BJOPM.2018.v15. n1.a8
Masoneilan International (2000), Masoneilan Control Valve Sizing Handbook, Dresser Valve Division, Bulletin OZ1000/00.
Nunes, G. C. (1194), Modelagem e simulação dinâmica de se-parador trifásico água-óleo-gás, dissertação de mestrado, Uni-versidade Federal do Rio de Janeiro, Rio de Janeiro.
Nunes, G. C. (2001), Design and analysis of multivariable pre-dictive control applied to an oil-water-gas separator: A polyno-mial approach (thesis), Division of Colleges & Universities, Uni-versity of Florida, Florida.
Nunes, G. C. (2007), “Modelagem dinâmica do processamen-to primário de petróleo: conceiprocessamen-tos fundamentais e aplicação em controle de processos”, Boletim Técnico da Produção de Petró-leo, Vol. 2, No. 1.
Nunes, G. C.; Lima, E. L. (2006), Avaliação de diferentes estra-tégias de controle para hidrociclones para altos teores de óleo: relatório parcial, Petrobras, CENPES, Rio de Janeiro.
Nunes, G. C.; Medeiros, J. L.; Araújo O. Q. F. (2010), Mode-lagem e controle na produção de petróleo: aplicações em MA-TLAB, Blucher, São Paulo.
Othman, H. A.; Dabirian, R.; Gavrielatos, I.; Mohan, R.; Shoham, O. (2018), “Validation and improvement of the hori-zontal pipe separator model”, Society of Petrolium Engeneers, SPE Western Regional Meeting, 22-26 April, Garden Grove, Cali-fornia, USA. https://doi.org/10.2118/190047-MS
Paiva, V. W. M. M. C.; Copetti, A.; Bertini, L.; Campos, M. C. M. M.; Moratori, P. B. (2016), “Controle supervisório fuzzy aplicado ao processo de separação e tratamento de óleo e água em uma plataforma de petróleo”, XXI Congresso Brasileiro de Automáti-ca – CBA2016, Vitória - ES, 3-7 out., pp. 2187-2192.
Ribeiro, C. H. P. (2012), Controle preditivo multivariável com requisitos de qualidade em plataformas de produção de petró-leo, dissertação de mestrado, Universidade Federal do Rio de Janeiro, Rio de Janeiro.
Ribeiro, C. H. P.; Miyoshi, S. C.; Secchi, A. R.; Bhaya, A. (2016), “Model Predictive Control with quality requirements on pe-troleum production platforms”, Journal of Pepe-troleum Scien-ce and Engineering, Vol. 137, pp. 10–21. Doi: 10.1016/j.pe-trol.2015.11.004.
Silveira, M. A. C. R. (2006), Controle de um processo de trata-mento primário de petróleo, dissertação de mestrado, Universi-dade Federal do Rio de Janeiro, Rio de Janeiro.
Stewart, M.; Arnold, K. (2008), Emulsions and oil treating equipment: Selection, sizing and troubleshooting, Elsevier.