Han et al. World Journal of Engineering Research and Technology
RELIABILITY ENHANCEMENT ON RADIAL DISTRIBUTION
SYSTEM BY DISTRIBUTED GENERATION
Han Su Yin1* and Shwe Zan Aung2
1
Professor, Dept. of Electrical Power Engineering, Yangon Technological University,
Yangon, Myanmar. 2
Project & System Design Engineer, Omega Integration Pte Ltd. Singapore.
Article Received on 08/07/2019 Article Revised on 29/07/2019 Article Accepted on 19/08/2019
ABSTRACT
This paper presents the Reliability Enhancement by Distributed
Generation (DG). The study of the test system used in this paper is on
Kalay distribution system, located at Kalay Township, Sagaing
Division, Union of the Republic of Myanmar. To estimate the
reliability of the test system and load flow conditions, the test cases are
modeled and evaluated using ETAP (Electrical Transient and Analysis
Program) Software and Newton-Raphson Method. According to the result, Distributed
Generation can improve the voltage profile and reliability indices. Moreover, the estimation
becomes more accurate by considering load flow constraint. The difference cases are
presented by comparing reliability index ENS (Energy Not Supplied). In this paper, optimal
placement of Distributed Generation (DG) in the distribution system is discussed and
premeditated, which can improve the voltage profile, loss minimization and system reliability
enhancement.
KEYWORDS: Reliability enhancement; distributed generation (DG); voltage profile; loss minimization; optimal placement.
INTRODUCTION
The fundamental requirement of the power system is to deliver electric energy to its loads
sufficiently, efficiently and reliably. A power system consists of a generation, transmission and
World Journal of Engineering Research and Technology
WJERT
www.wjert.org
SJIF Impact Factor: 5.218*Corresponding Author
Han Su Yin
Professor, Dept. of
Electrical Power
Engineering, Yangon
Technological University,
to the end users. It is the link between the utility system and the end customers. Many
distribution systems used in practice have a single circuit main feeder and are defined as radial
distribution systems. The mainstream distribution systems are designed to operate with a radial
topology. Radial distribution systems have a set of series components between a substation
and a load point, which usually includes breakers, lines, cables, transformers, switches, fuses
and other equipment. A failure of any component in the series path will result in the outage at
a load point and interruption may occur frequently because of the occurrence of the failures
and faults in the distribution network.
Reliability is one of the essential roles in electric power system which defines stable and uninterrupted supply of power to the fulfillment of customer‟s needs. The distance of load
points far from feeder causes increase the interruption frequency, interruption duration and
decrease the supply voltage. Electricity supply interruptions and low voltage problem cause
high disturbance to consumers and results in system unreliability. Usually, the utmost
reliability problems in power system are caused by distribution network.
The Distribution Reliability is the ability of the distribution system to perform its function
under stated conditions for a stated period of time without failure. Distribution Reliability is
becoming significantly important in the current competitive climate because of the fact that the
distribution system feeds the customers directly. Events on transmission and generation system
can also cause interruption to customers but events on these systems are much less likely to
affect customers than those on the distribution system.[1][2] Therefore, the improvement of reliability for distribution system including its protection system, transformer and allocating
distributed generation should be considered to promote the overall power system reliability.
Reliable power system means serving consumer‟s loads without interruptions in supply
voltage and it is one of the critical issues. Power system reliability has two aspects: system
adequacy and system security. The system adequacy is the availability of sufficient generation,
transmission and distribution facilities within the system to meet the required electrical energy
to the customer demand. The term security is the ability of the system to respond to disturbances
arising within the system and is therefore linked with system dynamics. Reliability assessment
of a complete system is a significant ability in overall electric power system operation and
planning.[3] Therefore, distribution reliability is one of the most important issue in the power system due to its high impact on system performance and electric power supply to the
with load flow constraint can generate more accurate outcome.
In the present times, integrating of large Distributed Generation systems into the various
power distribution systems have become very popular and it also keeps growing with fast
speed. Distributed Generation has a key role to play in the future of electricity. There is no
universal agreement on the definition of DG, which is also known as Embedded Generation or
Distributed Generation or Dispersed Generation. In this research, DG means small-scale
generation which is connected to the grid at distribution level voltage. DG energy resources
are categorized as non-renewable (conventional) and renewable (non-conventional) energy
resources.
Technologies based on renewable energy include PV modules, Geo-thermal system and Wind
turbines. As co-generation plants, fuel cells and heat engines use the technologies based on
non-conventional resources.[4] Interconnecting a DG to the distribution feeder can have significant effects on the power system positively in terms of voltage & reactive power support,
losses-reduction, and enhancement of reliability. But, negative impact of DG on power system
may include voltage rises & fluctuations, frequency and voltage instability, etc.[5][6] Figure 1. shows different conventional and non-conventional energy resources which are integrated with
the distribution system.
Figure 1: Distribution System with Distributed Generation.[7]
This research work will emphasis on assessment of reliability of distribution system. This
distribution system are explained. Studying on the test system is mentioned in third section. An
estimation and evaluation of reliability index and comparison results are presented in fourth
section. Finally, conclusion is presented in fifth section.
METHODOLOGY A. Load Flow Analysis
Power flow studies, commonly known as load flow, form an important part of power system
analysis. The flow of active and reactive power is called power flow or load flow. The main
purpose of the load-flow solution is to evaluate the magnitudes and phase angle of voltages at
each bus and the active and reactive power flow in each line. In this paper, load flow analysis
is suggested to observe for the lowest voltage load buses and to know the load flow conditions.
There are different methods to determine the load flow for a particular system such as: Gauss-
Seidel Method, Newton-Raphson Method and Fast Decoupled Method.
In solving a power flow problem, the system is assumed to be operating under balanced
conditions and a single-phase model is used. Four quantities, which are voltage magnitude |V|,
phase angle δ, active power (real power) (P) and reactive power (Q) are associated with each
bus. The system buses are generally classified into three types, namely slack bus, load bus and
generator bus.
The Newton-Raphson method is found to be more efficient and more practical. The number of
iterations required to obtain a solution is independent of the system size, but more functional
evaluations are required at each iteration. The Newton-Raphson load flow calculation is shown
below. The injected current in term of admittance matrix,
Where V is voltage magnitude and phase angle[8]
Load Flow Constraints: The limitations of load flow in power system are known as load flow
constraint. In Myanmar, these constraints are regarded as follow:
± 5 % is for voltage constraint in High-Voltage Transmission system
± 10 % is for voltage constraint in Middle-and Low-Voltage Distribution system.[9]
B. Reliability Indices
Reliability Indices are the functions of various factors such as failure rate, repair time,
switching time, etc. of various components. As factors are random in nature, reliability indices
are also random in nature. Three primary indices, average failure rate, average outage duration
and average annual unavailability or annual outage time are fundamentally important, but
they do not always give a complete representation of system behavior and response.
Therefore, the following reliability indices such as System Average Interruption Frequency
Index (SAIFI), System Average Interruption Duration Index (SAIDI), Customer Average
Interruption Duration Index (CAIDI), Energy Not Supplied (ENS) and Expected Energy Not
Supplied (EENS) are included in the calculation to evaluate the complete scenario of reliability
of distribution system. Three basic indices of reliability and the equation of reliability indices
are shown in equations (8) through (14).[3][10]
These basic load point indices are the load point average failure rate (λ), the average outage
time (r) and average annual unavailability or outage time (U).
The equation for reliability indices are as follow:
SAIFI = total number of customer interrupti on
total number of customer served
SAIDI = sum of customer interrupti on duration
total number of customer
CAIDI =sum of customer interrupti on duration
total number of customer interrupti ons
Where La(i) is the average load demand at load point i and Ui is outage time at load point i.
Reliability indices are useful for determining what a customer can expect in terms of
interruption frequencies and durations.[11]
C. Software
A number of software tools available for electrical engineer. Software like MATLAB/
SIMULINK, AutoCAD ELECTRICAL, PSIM and ETAP can be available easily. The software
tool used in these analyses is ETAP, which is a fully integrated AC and DC electrical power
Program‟ and it offers a wide range of network analysis applications for electrical engineering.
Modules are available to analyze generation plants, large industrial facilities, transmission
systems, distribution systems as well as small commercial facilities. Moreover, ETAP Software
can be used offline for power system simulation, online for real-time data management, or used
to control real time systems and it is customizable; enabling clients to utilize the portions of
the application they require without having to purchase the entire package. This software is the
complete guide for electrical engineers and it offers a complete solution to all the electrical
problems such as the power flow, arc flash & short circuit analysis, transient stability, relay
coordination, cable selection and best possible power flow.
Here, this paper is focusing on evaluation of reliability indices and solving of the load flow
analysis. The test system is modeled and evaluated in Electrical Transient and Analysis
Program (ETAP). The procedures in ETAP are
1. Model reliability characteristic of each component
2. Implement user-defined parameters & settings
3. Calculate system reliability indices
4. Calculate load flow analysis to know load flow conditions
The load bus and system indices evaluated by ETAP software and some of them are;
1. System Average Interruption Frequency Index (SAIFI)
2. System Average Interruption Duration Index (SAIDI)
3. Expected Energy Not Supplied (EENS)
4. Average Energy Not Supplied (AENS)
The system voltage load buses and system losses are calculated by ETAP.
Test System
The analysis is tested in Kalay Distribution network. Originally, the electrification at Kalay is
done by Diesel Generators and Mini-Hydro Power Plant before Myanmar National Grid is not
supported. Since 2016, it started to generate and distribute electricity by Myanmar National
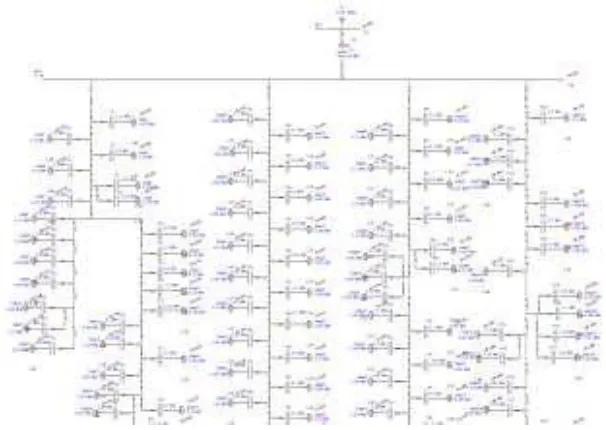
Figure 2: Single Line Diagram of Kalaymyo Distribution System.
The single line diagram of Kalay distribution network is shown in Figure 2.
Kalaymyo distribution substation is located in Kalay Township. Its distribution corresponds
to provide the electricity to Kalay Township. For the distribution, one 20 MVA, 66/11 kV
transformers are employed at the substation. The Kalay distribution feeder network has an
11kV system with substations and transformers which step down the voltage to 0.4kV at the
secondary level. Currently, Kalaymyo substation is supplying electricity with four feeders
namely; Myo Htawt, Aung Thit Sar, Da-Ka-Sa and Gyi Kone.[12] The data for this research was sourced from Kalaymyo substation.
Electric Transient Analysis Program (ETAP) software was used in reliability analysis and
load flow computation in this paper.[13] The reliability analysis by means of ETAP helps to evaluate distribution system reliability with highly efficient analytical algorithms. For this
A. Studying on the Existing System
This paper analysed the reliability prediction and load flow calculation to the distribution
network of Kalay Distribution Substation. Table 1. presents type of cable and length of feeder
in Kalay distribution system while Table 2. shows type and number of customers that supplies
power to different types of customer loads: Government and Institution, Office and Building,
Residential and Commercial.
Some of transformer data and load data of the test system for load flow calculation are
presented in Table 3. These data are collected and calculated from the failure rate and outage
time of Kalaymyo substation and some data are taken from sample data of IEEE system.
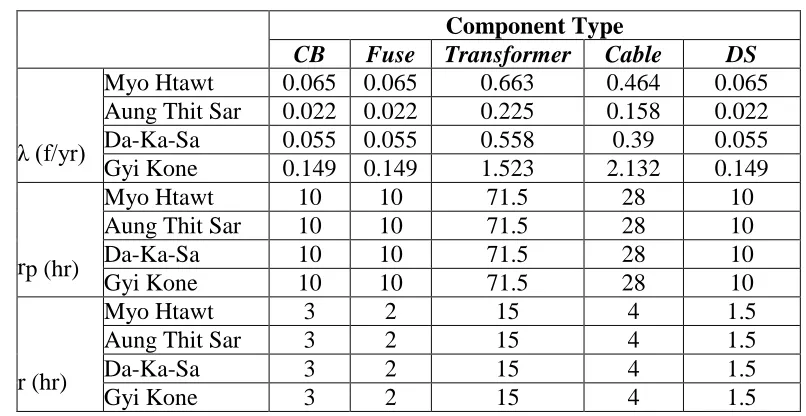
Reliability data for each component is shown in Table 4. Parameter λ is failure rate per year,
rp is replace time in hours and r is repair time for transformers, circuit breaker, fuse, cable and
disconnecting switch.
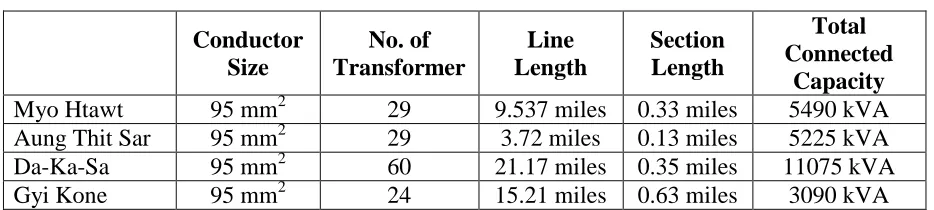
Table 1: Line Data.
Conductor Size No. of Transformer Line Length Section Length Total Connected Capacity
Myo Htawt 95 mm2 29 9.537 miles 0.33 miles 5490 kVA Aung Thit Sar 95 mm2 29 3.72 miles 0.13 miles 5225 kVA Da-Ka-Sa 95 mm2 60 21.17 miles 0.35 miles 11075 kVA Gyi Kone 95 mm2 24 15.21 miles 0.63 miles 3090 kVA
Table 2: Load Data, Customer Types and Number.
Load Point Customer
Type
Average Load per Load Point
No. of Customer
1 Residential 650 kW 687 2,3,4,8,10,11,12,1,28,31,33,45,57,59,6
0,61,62,64,66,68,81,83,86,90,91,96, 103,104,106,113,114,115,120,121,135
Residential 104 kW 8880
5 G&I 163.8kW 1
6 G&I 83.2 kW 1
7 Residential 156 kW 316 9,32,34,35,36,41,43,54,85,107,122,
123,124,125 Commercial 52 kW 14 13,94,117,142 G&I 163.8 kW 4 14,22,65,70,72,73,74,80,126,128,131,
136,137,138,139,140,141 G&I 52 kW 17 15,37,53,71,87,132 O&B 83.2 kW 6
24,25,51,56,58,76,105 Commercial 83.2 kW 7 26 Commercial 5.2 kW 1 27,89,97 Residential 83.2 kW 458 38,42,79 Commercial 104 kW 3
39,134 Residential 163.8 kW 499 40,44 Commercial 163.8 kW 2 46,50,84,89,98 Residential 163.8 kW 1584
47,108 Industry 52 kW 2 48,49,112,119 O&B 104 kW 4 52,101 Commercial 26 kW 2 55,116 G&I 156 kW 406
67 G&I 260 kW 6
91 Residential 416 kW 621
92 Industry 26 kW 1
95 O&B 163.8 kW 1
109,110 Industry 156 kW 2
111 O&B 13 kW 1
118 G&I 104 kW 1
Table 3: Transformer and Load Data. Feeder
Name Transformer Name
Transformer Rating
(kVA)
LF PF P (kW) Q (kVA)
Myo Htawt
Office (1) 1250 0.65 0.8 650 487.5 Civil Hospital 315 0.65 0.8 163.8 122.85 Sayataw Kyaung 50 0.65 0.8 25 19.5 Mingalar Garden 10 0.65 0.8 5.2 3.9
Aung Thit Sar
Phualpi AG Church 200 0.65 0.8 104 78 Tazin (3) Street 315 0.65 0.8 163.8 122.85 Royal City Hospital 160 0.65 0.8 83.2 62.4 KaGyiWin 100 0.65 0.8 52 39
Da-Ka-Sa
GTU 500 0.65 0.8 260 195
University (1) 300 0.65 0.8 156 117 Tahan (2) 800 0.65 0.8 416 312 Industrial Zone Exchange 25 0.65 0.8 13 9.75
Gyi Kone
Table 4: Component Reliability Data.
Component Type
CB Fuse Transformer Cable DS
λ (f/yr)
Myo Htawt 0.065 0.065 0.663 0.464 0.065 Aung Thit Sar 0.022 0.022 0.225 0.158 0.022 Da-Ka-Sa 0.055 0.055 0.558 0.39 0.055 Gyi Kone 0.149 0.149 1.523 2.132 0.149
rp (hr)
Myo Htawt 10 10 71.5 28 10 Aung Thit Sar 10 10 71.5 28 10 Da-Ka-Sa 10 10 71.5 28 10 Gyi Kone 10 10 71.5 28 10
r (hr)
Myo Htawt 3 2 15 4 1.5 Aung Thit Sar 3 2 15 4 1.5 Da-Ka-Sa 3 2 15 4 1.5 Gyi Kone 3 2 15 4 1.5
Table 5: Simulation Result (Reliability Indices).
SAIFI 107.601 f/customer.yr SAIDI 157.775 hr/customer.yr ENS 1104.425 MWhr/yr
Table 6: Simulation Results (Reliability Indices with DG).
SAIFI 63.6683 f/customer.yr SAIDI 129.2911 hr/customer.yr ENS 445.6781 MWhr/yr
Test Results
Under different situations, three cases were analysed which shows diverse calculated results.
Case A. Reliability Analysis without DG
Using the test system and data, the current condition of system reliability and voltage profile
Figure 3: Reliability assessment of test system without DG by using ETAP Reliability evaluation result without DG is presented in Table 5.
Voltage profile with and without DG is expressed in Figure 4. From simulation results with
and without DG, under-voltage buses can be observed.
Case B. Reliability Index ENS considering load flow constraint
Reliability estimation considering load flow constraint is forecasted as follow. In this
estimation, number of under voltages buses and the test system peak time (hr) should be
considered. The total load (MW) of under voltages buses are 1464 kW and the peak time (hr)
per day for the test system is 2 hr. Therefore, estimation result considering the load flow
constraint condition for Energy Not Supplied (ENS) is calculated.
ENS = 2173.125 MWhr/yr
Case C. Reliability Index ENS with DG Integrated
As mentioned above, load flow analysis is a study to observe load buses with the lowest
voltage and to see the load flow conditions. The voltage profile with DG can be shown in
Figure 5.
The proper location of DG plays a very important role to upgrade the system reliability, to
reduce the system losses and to improve the system voltage profile. Since DG can promote the
voltage profile and system reliability, the location for DG is usually set at the load bus with
lowest voltage.
As a consequence, the DG is connected at a load bus from the Da-Ka-Sa feeder. Table 6.
express the simulation result (Reliability Indices with DG).
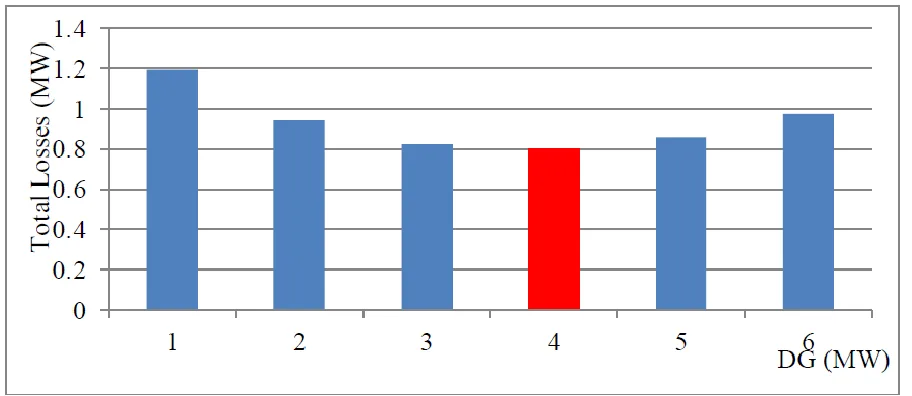
Figure 5: Comparison of Loss vs DG Rating.
plotted in Fig 5: Comparison of Loss vs DG Rating. It is observed that the suitable amount is
obtained at 4 MW and it is selected for the feeder.
Fig 6: shows the voltage profile after integrating DG into the system.
Figure 6: Voltage profile with DG.
Case C. Comparison Analysis
Figure 7: Comparison of ENS.
In Figure 7, three tested cases are compared to check the improvement of ENS (Energy Not
Supplied). Case A is indices without DG/ without considering load flow constraint, and Case
constraint, the resulted ENS increases from the current condition and the estimation is closely
represented the actual condition. And case C is reliability improvement by Distributed
Generation in feeders.
CONCLUSION
As presented in this paper, the estimation of reliability indices and solving of the load flow
analysis is done using ETAP (Electrical Transient and Analysis Program). The Newton-
Raphson method is adopted for the calculation of load flow analysis. According to the tests,
the reliability indices and voltage profile can be improved by connecting Distributed
Generation into the system. If the load constraint is not considered, the amount of ENS is
(1104.425 MWhr/yr) without DG. But, when the load constraint is considered, the amount of
ENS becomes (2173.125 MWhr/yr) without DG. When the Distributed Generation is
integrated into the system the amount of ENS becomes (445.6781 MWhr/yr). From the ENS
comparison results, it can be conducted that considering load flow constraint is more
approximate with actual values. Therefore, it is more suitable for actual reliability estimation.
ACKNOWLEDGMENT
I would like to express my sincere appreciation to Kalay Substation for their supports on data
collecting. I also would like to acknowledge special thanks to all my seniors and colleagues
from Department of Electrical Power Engineering for their help, support and encouragement
towards this paper.
REFERENCES
1. Author (), Hand book of Power Quality, John Wiley and Sons Ltd
2. G.V. K Murthy, Dr. S.Sivanagaraju, Dr. S.Satyanarayana and B. Hanumantha Rao, () Reliability improvement of Radial distribution system with distributed generation”
International Journal of Engineering Science and Technology (IJEST).
3. Billinton R. and Allan R.N. (1984), Reliability Evaluation of Power Systems”, 2nd
Edition, Plenum Press, New York.
4. Ilyas, M., Tanweer, S.M., and Rahman, A. (2013) Optimal Placement of Distributed
Generation on Radial Distribution System for Loss Minimization & Improvement of
Voltage Profile, International Journal of Modern Engineering Research (IJMER) 3, No. 4
on power system s: Part 1- Radial distribution systems, IEEE Power technology, Inc, Vol.
3, pp. 1645-1656.
6. I. Hernando-Gil, I-sorin Ilie, J.L.Acosta and Sasa Z. Djokic (2012) “Impact of DG and Energy Storage on Distribution Network Reliability : A comparative Analysis,” 2nd IEEE
energycon conference & exhibition.
7. Ahmah, S., Asar, A.U., Sardar, S., and Noor, B. (2017) “Impact of Distributed Generation on the reliability on Local Distribution System”. International Journal of Advanced
Computer Science and Applications, Vol. 8, No. 6.
8. Saadat Hadi (1999) Power System Analysis 3rd Edition, McGraw-Hill Inc. 9. Myanmar Electric Power Enterprise
10.P. Mazidi and G. Sreenivas (2011) “Reliability assessment of a distributed generation connected distribution system,” International Journal of Power System Operation and
Energy Management (IJPSOEM), Nov.
11.U.S Department of Energy (2012), Reliability Improvements from the Application of
Distribution Automation Technologies-Initial Result
12.Kalay Substation and Distribution Network, “Documents of System Data and Load Data”, Sagaing Division, Myanmar.
![Figure 1: Distribution System with Distributed Generation.[7]](https://thumb-us.123doks.com/thumbv2/123dok_us/8362661.1672087/3.596.170.426.462.663/figure-distribution-system-with-distributed-generation.webp)