Applications of Atomic Force Microscopy in Textiles
Serpil Koral Koc
Uludag University, Textile Engineering Department, Bursa, TURKEY
Correspondence to:
Serpil Koral Koc email: [email protected]
ABSTRACT
Potential applications of atomic force microscopy (AFM) in textiles are explained. For this purpose samples were carefully selected from both natural and synthetic fibers. Cotton, wool, conventional polyethylene terepthalate (PET), antibacterial PET, and antistatic PET were investigated by means of 3D topography imaging, phase imaging, and calculation of their Rq values. The distribution of the additives in the cross sections of antibacterial PET and antistatic PET were analyzed. Moreover, differences between inner and outer cross section of trilobal PET was observed by force spectroscopy. The results are discussed considering the fiber properties. It is concluded that AFM is a powerful tool to investigate different properties of textile fibers, and it gives valuable information.
Keywords: Atomic force microscopy, textile fibers, surface properties.
INTRODUCTION
Atomic force microscopy (AFM) is a surface analytical tool developed during the mid-1980s by Binnig, Quate, and Gerber as a daughter technique to scanning tunneling microscopy [1,2]. AFM was developed as an alternative for imaging either conducting or nonconducting surfaces. Therefore it allows investigating textile fibers without any coating and at ambient conditions.
In AFM, the tip is attached to a flexible cantilever and is brought in contact with the surface (Figure 1). The force between the tip and the surface is detected by sensing the cantilever deflection. A topographic image of the surface is obtained by plotting the deflection as a function of the x-y position. In a more common mode of operation, a feedback loop is used to maintain a constant deflection, while the topographic information is obtained from the cantilever vertical displacement [3].
Besides 3D imaging, AFM can be also used to determine the characteristics of a surface quantitatively. Thus, different surfaces can be
compared quantitatively rather than qualitatively in a straight forward fashion. The simplest and most common method used for the observation of surface topography is called the root mean square roughness calculation (Rq). Rq values can be easily calculated
using software supplied with the AFM instrument [2,4].
FIGURE 1. AFM sy stem [3].
Phase imaging is a powerful extension of tapping mode AFM that provides nanometer-scale information about surface structure often not revealed by other scanning probe microscopy techniques. By mapping the phase of the cantilever oscillation during the tapping mode scan, phase imaging goes beyond simple topographical mapping to detect variations in composition, adhesion, friction, viscoelasticity, and perhaps other properties. Applications include identification of contaminants, mapping of different components in composite materials, and differentiating regions of high and low surface adhesion or hardness. Phase imaging promises to play an important role in the ongoing study of material properties at the nanometer scale [5].
the tip and sample (the result of this measurement is called a force-distance curve). For this method, the AFM tip is extended towards and retracted from the surface as the deflection of the cantilever is monitored as a function of piezoelectric displacement [6]. Force curves, provide valuable information on local material properties such as elasticity, hardness, Hamaker constant, adhesion and surface charge densities [7].
In this study AFM was used to investigate different properties of textile fibers by means of 3D imaging, phase imaging, calculating Rq values, and force
spectroscopy. The samples were carefully selected to introduce the performance of AFM. The results are explained considering the fiber structures.
MATERIAL AND METHOD
In this study cotton, wool, conventional polyethylene terepthalate(PET), antibacterial PET, antistatic PET, and trilobal PET fibers were used. Different characteristics of the fibers were investigated by using different modes of AFM. 3D topography imaging; phase imaging and calculation of Rq value were performed for all the samples except trilobal PET. Investigating the distribution of the additives in fiber cross section was performed only for antibacterial PET and antistatic PET fibers. Force spectroscopy was used in order to observe the differences between inner and the outer parts of the trilobal PET fiber. The materials and the methods used in this study are summarized in TableI.
TABLE I. Materials and the methods used in the study.
The AFM studies were performed on a Veeco Dimension 3100 atomic force microscope, in the Laboratories of Max-Planck Institute for Polymer Research (Mainz, Germany). The topography imaging of the surface of the fibers were carried out in tapping mode AFM. In these studies phase imaging of the fibers were also performed. For roughness calculations, the raw images were flattened
(second order) and then the Rq values of the samples
were calculated using the software (version v720) supplied with the atomic force microscope. Furthermore PET, antibacterial PET, and antistatic PET fibers were embedded in epoxy and had smooth cuts by microtome. The distribution of particles in fiber cross section was analyzed by contact mode AFM. The force spectroscopy studies were carried out with standard force-volume mode of AFM.
RESULTS AND DISCUSSION
AFM images of the samples are given in Figure 2 and Figure 3.
Cotton and wool fibers were analyzed with two different scan sizes in order to get more detailed information about their surfaces. Characteristic surface features were observed for all the samples. For cotton fibers the fibrillar structure and for wool the scales on the surface were recorded. PET showed a smooth surface with few impurities. On the other hand antistatic PET and antibacterial PET gave rougher surfaces due to the additives inside their structures.
Rq values of the fibers are given in Table II. Rq values
are dependent on scan size; therefore they were calculated only for AFM images with the same scan size (2 μm × 2 μm). It was observed that wool gave the highest Rq value, while cotton gave the lowest. On
the other hand PET, antibacterial PET, and antistatic PET gave similar Rq values. These results may be
seen incompatible with the AFM images; however Rq
is calculated from height variations from a mean surface level [4], which is the main reason for this difference. Moreover in most of the AFM images the scale cannot keep constant to get more detailed images. Therefore in determining the surface characteristics of the samples it is thought to be very useful to use Rq values, in addition to AFM images.
TABLE II. Rq values of the fibers.
Material Rq (nm)
Cotton 7.02
Wool 22.7
PET 11.6
Antibacterial PET 11.7
Antistatic PET 12.0
(a)
(b)
(c)
(d)
seen. This shows that in antibacterial PET, the silver particles tend to aggregate on the surface of the fiber. On the other hand in antistatic PET, the carbon black particles spread homogeneously across the cross section of the fiber. Recently there is an increasing
demand to fibers with additives. To understand the performance of these fibers it is very beneficial to know the distribution of the additives inside of the fiber. AFM can be easily used in such investigations.
(a)
(b)
(c)
(a) (b)
FIGURE 3. AFM images of the samples: a) PET, b)Antistatic PET, c) Antibacterial PET.
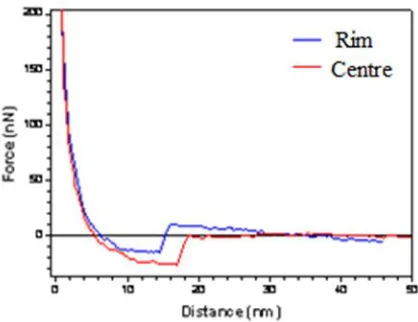
Figure 5 shows the force-distance curves obtained from the cross section of the trilobal PET. The curves were taken from two different places: near the surface and near the center. The curves indicate no pronounced difference between the rim and the center of the cross section. Trilobal PET is produced by the melt spinning process. During melt spinning inner and outer parts of the fibers may show different solidification behaviors, resulting a non-homogeneous structure across the fiber. Detecting homogeneity of the fiber cross section is very beneficial, since it directly affects mechanical behavior of the fibers. AFM can be used to analyze the differences in the structure across the fiber cross section effectively.
FIGURE 5. Force-distance curve of trilobal PET ( Taken from 2 different places on the fiber cross-section. Near the surface and near the centre).
CONCLUSION
AFM gives 3D topography images of the fibers with high resolution. Calculation of Rq values allows
determining the surface characteristics of textile fibers quantitatively. The distribution of particles in fibers with additives can be easily analyzed by AFM. Moreover the differences between inner and the outer part of fibers can be investigated by force curves.
It is concluded that AFM is a very powerful tool to investigate different properties of textile fibers, and it gives valuable information.
ACKNOWLEDGEMENT
The author would like to thank Dr. Rüdiger Berger and Uwe Rietzler (Max Planck Institute for Polymer Research, Germany) for supporting the SFM studies and helpful discussions. This research was funded by Uludag University, Turkey [The project number is YDP(M)-2010/9].
REFERENCES
[1] Binning, G., Quate, C.F., Gerber Ch., “Atomic force microscope”, Physical Review Letters, 1986; 56(9), pp.930-933. [2] Skolnik, A.M., Hughes, W.C., Augustine,
B.H., “A metallic surface corrosion study in aqueous NaCl solutions using atomic force microscopy (AFM)”, Chem Educator,2000; 5, pp.8-13.
[3] Bhushan B., “Springer Handbook of
Nanotechnology”, Springer, Berlin, 2004, pp.147-180.
[4] Simpson, G.J., Sedin, D.L., Rowlen, K.L., “Surface roughness by contact versus tapping mode atomic force microscopy”, Langmuir, 1999, 15, pp.1429-1434.
[5] http://www.chembio.uoguelph.ca/educmat/c
hm729/afm/moredet.htm (accessed June
2013).
[6] http://en.wikipedia.org/wiki/Atomic_force_
microscopy (accessed June 2013).
[7] Butt, H.J., Cappella, B., Kappl, M., “Force measurements with the atomic force microscope:Technique interpretation and applications”, Surface Science Reports,
2005, 59, pp.–152.
AUTHORS’ ADDRESSES Serpil Koral Koc
Uludag University Faculty of Engineering
Textile Engineering Department 16059 Gorukle, Bursa