212
INTRODUCTION
In recent years, a dynamic development of the companies producing polymer precast concrete has been observed, including the systems for spe-cialized applications, such as: bridge elements (ledges, curbs, grooves), elements for municipal wastewater drainage (wells, channels, tanks), tanks for aggressive media used in industry, mod-ern railway sleepers. The direction of application of this type of composites results from, among others, excellent chemical resistance, low water absorption, and at the same time the high strength parameters of resin concretes [1–3]. These fea-tures, in turn, are conditioned by the type of syn-thetic resin used as a binder. It is the resin that first and foremost determines the properties of such a
composite, especially its chemical resistance. The use of a given type of resin causes the obtained composite to have different properties. Therefore, it is extremely important to judiciously select the type of binder for the anticipated conditions of the process of manufacturing and using the products made of resin concrete. Since the cost of produc-ing this type of composites is higher than that of cement concrete, the glycolysis products based on poly(ethylene terephthalate) (PET) waste are used as a partial replacement for the resin, which leads to a significant reduction in the production costs of the finished goods. This approach allows us to obtain a less expensive material that also has very good physical and mechanical param-eters. In addition, this solution fits into the idea of sustainable development in the construction
Accepted: 2019.08.11 Available online: 2019.08.17 Volume 20, Issue 8, September 2019, pages 212–225
https://doi.org/10.12911/22998993/111712
Evaluation of the Utility of Using Classification Algorithms
when Designing New Polymer Composites
Bernardeta Dębska
1*, Barbara Dębska
2, Lech Lichołai
11 Rzeszow University of Technology, The Faculty of Civil and Environmental Engineering and Architecture, ul. Poznańska 2, 35-084 Rzeszów, Poland
2 Rzeszow University of Technology, The Faculty of Chemistry, ul. Powstańców Warszawy 6, 35-959 Rzeszów, Poland
* Corresponding author’s e-mail: [email protected]
ABSTRACT
Polymer composites are the materials that can be successfully used in the places where high mechanical strength and chemical resistance as well as low absorbability are required. These unique features of polymer composites are obtained mainly due to a suitably selected binder, i.e. a synthetic resin. At the same time, this component ac-counts for the high production costs of these materials. Partial substitution of the resin with glycolisates obtained using poly(ethylene terephthalate) waste (PET), helps reduce the price of polymeric mortars, while maintaining favourable physicomechanical properties. This modification method also has a beneficial effect on the environ -ment, as it allows the utilisation of a very common waste, which is difficult to dispose of. The article concerns three types of resin mortars, i.e. epoxy, polyester and polyester with the addition of colloidal silica, modified with PET glycolisate. On the basis of the obtained data set and database knowledge mining techniques, such as discriminant analysis and decision trees, it was shown to what extent the type of resin and the presence of an added modifier differentiate the mortar properties. The results obtained with both methods were compared. It was confirmed that these techniques are effective both in the classification and prediction of the type (selection) of mortar in the pro -cess of designing new composites.
industry, as the waste materials that constitute a major environmental problem, are used during the production of polymer prefabricates. A meth-od of obtaining the composites mmeth-odified with glycolisates obtained on the basis of PET waste, and their effect on selected properties of epoxy mortars, is described in detail in the article [4]. The experiments conducted formed the basis for the construction of a laboratory database which brings together, among others, the data on the type and composition of raw materials used for the production of composites and the correspond-ing properties of the polymer concretes obtained. Such datasets can be used to search for useful reg-ularities hidden within them. For example, while designing construction elements, we want to find an answer to the question: which resin should be used for the production of polymer precast con-crete so that the construction meets the required mechanical properties. In order to demonstrate the extent to which the type of resin and the presence of an added modifier differentiate the properties of resin mortars, this article uses two selected database knowledge mining techniques, i.e. discriminant analysis and classification trees. In both cases, the database is searched for a de-pendency of the form:
properties of the composite → type of resin.
The properties of the composite serve here as input variables (features of the examined objects, attributes of the analysed cases). The type of resin is sought in the population (group, label) to which the composite belongs. Discriminant analysis is used to decide which variables distinguish (dis-criminate between) two or more naturally emerg-ing groups. It searches for the rules of conduct aimed at assigning multivariate objectsto one of many populations with known parameters with possibly minimal classification errors. The discri -minant analysis techniques are based on a rather simple mathematical model, the core of which is a linear combination of independent variables (also called discriminating variables). It allows classification of observations (e.g. test mortars) into one of the groups that are of interest to the researcher [5].
Two main stages can be distinguished in dis-criminant analysis:
1. Training stage (model construction), in which the classification rules are created based on the research results (training set) gathered in the database.
The canonical discriminant functions sepa-rating the studied groups were determined. In the case of differences between groups, each of them can be treated as a cloud of points in space with axes that are discriminating variables. These point clouds may overlap slightly, but most of the points are concentrated in centroids spaced apart, i.e. fictitious points the coordinates of which are equal to the group mean of each discriminating variable. It is accepted that the centroids are typi-cal representatives of each group. All classifica -tion procedures use a case-by-case comparison with each calculated centroid to find the closest one. The classification process is associated with the creation of one or more functions, classifying the analysed cases to the appropriate groups. It is conducted on the basis of Ronald Fisher’s linear combination in the form (1):
𝐾𝐾𝑖𝑖 = 𝑎𝑎𝑖𝑖0+ 𝑎𝑎𝑖𝑖1∗ 𝑥𝑥1+ ⋯ + 𝑎𝑎𝑖𝑖𝑖𝑖∗ 𝑥𝑥𝑖𝑖 (1)
where: aij, j = 0, 1, … , n are the coefficients cal -culated from discriminant variables for each classification function.
There are as many of these functions as there are groups and they are used to decide which group most likely belongs to the given case. With the functions so defined, the case is classified in the group for which Ki assumes the highest value. 2. Classification stage (using the model), in which
classification is carried out of a set of objects whose membership is unknown, based on the class characteristics found earlier.
If the database (sample) is large, the data set can be divided into two subsets: the training and test, in order to assess the usefulness of the des-ignated classification equations. Otherwise, new data should be collected to confirm the accuracy of the classification. In practical use, the database is constantly expanded with new objects (data collected during the conduction of new laborato-ry experiments), which usually increases the cor-rectness of the results of the classification stage (class prediction effectiveness).
214
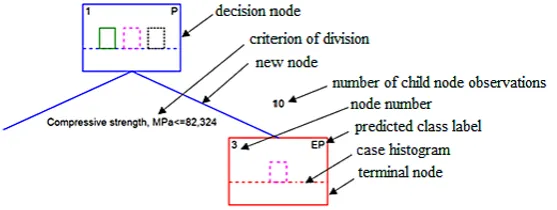
The tree is a graphical model created as a result of a recursive division of the set of observations A into n disjoint subsets A1, A2, A3, ... An. The goal of building a model is to obtain subsets of maxi-mum homogeneity from the point of view of the value of a dependent variable. It is a multi-stage process that can use another independent variable in each step. At each stage, all of the predictors are analysed, and the one that ensures the best node division, i.e. it separates the most homoge-neous subsets, is chosen.
An example of a classification tree is shown in Fig. 1. The beginning of each tree is the whole set of observations (the root of the decision tree), which is divided into 2 or more subsets. The first case concerns binary trees, and the second case any trees. The divided collection is called the par-ent node, while the separated subsets are called the child nodes. In the stage of division, the child node, which is further subdivided, becomes the parent node for the 2nd stage, and the node that remains unchanged becomes the terminal node, referred to as the leaf. The size of the tree is the number of leaves, and the depth of the tree is the number of edges between the top and the most distant leaf. The graphical representation of the knowledge on the studied process in the form of a tree makes the interpretation of results easier than in the case of purely numerical results [6, 7].
The aim of the analysis based on classifica -tion trees is to predict or explain the response (reaction) encoded in the qualitative depend-ent variable, and therefore the techniques used in this module have much in common with the techniques used in more traditional statistical methods, such as discriminant analysis, discussed above. Therefore, both methods were used in this study, and the results obtained were compared. For this purpose, the STATISTICA software was used, in which both discriminant methods
and classification trees are implemented. The STATISTICA software enables to build trees by an exhaustive search for division of cases into classes. This algorithm is a complete implemen-tation of techniques for calculating binary classi-fication trees based on univariate divisions.
M. R Feldesman [8] presented the circum-stances that limit the possibilities of applying both of the methods mentioned above. In many situations, similar results are obtained, but some-times one method can be an alternative to the other. The data mining methods are widely used in many fields of science, including psychology, sociology, economics, and medicine. However, their use in materials science is much more mod-est. Y. Li [9] demonstrated the possibilities of applying the decision tree method to the classi-fication of stainless steel. Article [10] describes the use of the decision tree method to the clas-sification of beer samples. M. Hajigholizadeh and A.M. Melesse used the methods of discriminant analysis to assess water quality and to evaluate its spatial and temporal changes [11]. S.R. Oro et al. described a multivariate statistical analysis of displacements of a concrete dam in relation to the environmental conditions, using various statisti-cal methods, including discriminant analysis [12]. Gabriela Vítková et al. used this method to clas-sify bricks [13]. In another article [14], B. Dębska showed the possibility of using the discriminant analysis method for testing the mortars obtained using three different types of aggregates, i.e. per -lite, expanded clay and granulated waste rubber, which are a partial substitute for quartz sand.
This article describes a study on the impact of the binder type on the change of mechanical properties of polymer mortars. The methods used were discriminant analysis and decision trees for the classification of mortars. The results obtained with both methods were compared.
MATERIALS AND METHODS
Three types of resin mortars were prepared: A. Epoxy mortar modified with PET deg -radation product – (EP), of the following composition:
• epoxy resin (EP) – 20% of the total composition
• poly(ethylene terephthalate) (PET) glycolisate – 0%, 5%, 10% or 15% by weight relative to the amount of resin
• Z-1 (triethylenetetramine) hardener – 10% by weight relative to the amount of resin
• quartz sand with a grain size of 0–2 mm, con-forming to the requirements of standard PN EN 196–1 – 80% of the total composition B. Polyester mortar I modified with PET degradation product – (P), of the following composition:
• unsaturated polyester resin Polimal 103 – 20% of the total composition
• poly(ethylene terephthalate) (PET) glycolisate – 0%, 5%, 10% or 15% by weight relative to the amount of resin
• K-1 hardener – 2 g per 100 g of resin
• Co accelerator 1% – 0.4 g per 100 g resin
• quartz sand with a grain size of 0–2 mm, conforming to the requirements of standard PN EN 196–1 – 80% of the total composition C. Polyester mortar II modified with PET deg -radation product – (P-HDK), of the following composition:
• unsaturated polyester resin Polimal 103 – 20% of the total composition
• poly(ethylene terephthalate) (PET) glycoli-sate – 0%, 5%, 10% or 15% by weight relative to the amount of resin
• K-1 hardener – 2 g per 100 g of resin
• Co accelerator 1% – 0.4 g per 100g of resin
• Colloidal silica HDK H 20 – 1% by weight in relation to the amount of resin, used to elimi-nate the phenomenon of sedimentation of ag-gregate in polyester mortars
• quartz sand with a grain size of 0–2 mm, con-forming to the requirements of standard PN EN 196–1 – 80% of the total composition
Selected physicochemical properties of res-ins and glycolisate, respectively, are presented in tables 1–3.
Obtaining of epoxy and polyester
compositions modified with PET glycolisate
The epoxy compositions modified with PET glycolisate were obtained on the basis of Epid-ian 5 epoxy resin and a PET degradation product. Appropriate amounts of epoxy resin and modifier were weighed in a beaker using technical scales with an accuracy of ± 0.01 g and mixed with a rod to make them uniform.
After mixing, the ingredients were baked for 60 minutes at 353 K to enable the functional groups of the two components to react.
Table 3. The physicochemical properties of PET glycolisate
Type of
glycolisate Density 23 oC, g/cm3
Melting temperature,
oC Form
Hydroxyl number, mgKOH/g Molecular weight n M g/mol w M g/mol
PET 1.30 78 ÷ 82 Semi-solid wax 515 404 849
Table 2. The physicochemical properties of Polimal 103
Type of
resin Density,g/cm3 Viscosity 25 oC, mPa s
Gelation time 25oC,
min
Acid numer LK, mg KOH/g
Polimal 103 1.10 ÷ 1.16 350 30 32
Table 1. The physicochemical properties of Epidian 5
Type of
resin Density,g/cm3 Viscosity 25 oC,
mPa s Molecular weight, g/mol Epoxy count LE,mol/100 g
216
Obtaining polyester compositions modified with PET glycolisate
The polyester compositions modified with PET glycolisate were obtained on the basis of Polimal 103 polyester resin and a PET degrada-tion product. Appropriate amounts of polyester resin and modifier were weighed in a beaker us -ing technical scales with an accuracy of ± 0.01 g and mixed with a rod make them uniform.
Production and curing of mortars
Curing of epoxy compositions
After reaching room temperature, the pre-pared PET glycolisate modified epoxy composi -tion was mixed with the appropriate amount of Z-1 hardener (10 parts/100 g resin). The ingredi-ents were mixed thoroughly with a glass rod until a homogeneous mixture was obtained.
Curing of polyester compositions
The prepared compositions were combined with the K-1 hardener in an amount of 2% in relation to the amount of resin and mixed thor-oughly. The cobalt accelerator was then added in an amount of 0.4 g per 100 g resin and mixed thoroughly again.
Production of epoxy and polyester mortars
The mortar samples were prepared using a laboratory mixer. The previously prepared resin compositions were transferred to the mixer bowl and mixed with standard sand while maintaining the same mixing time and mixer speed. For each composition differing in ingredients, three mor -tar samples of 40x40x160 mm were made for the flexural and compressive strength tests as well as hardness tests. The samples thus prepared were left to cure for 7 days at room temperature.
Mortar testing
For hardened mortars, the following proper-ties were determined:
a) Strength: flexural ff and compressive strength fc. These tests were carried out in a strength testing machine equipped with appropri-ate inserts, on standard bars according to the PN-EN 196–1:2016 standard.
b) HB hardness
The determination was performed based on PN-EN ISO 2039–1: 2004. This standard applies to the determination of hardness by ball pressing and is intended for testing of plastics. This test method was chosen due to the fact that the matrix in the tested mortars was an epoxy resin. The test method consists in pressing balls, under a given load, into the surface of the test piece. The depth of the impression under the load is measured and the ball surface impression area is calculated on this basis. Using the ball pressing method (HB) hardness can be calculated from the following relationship:
1
𝐻𝐻𝐵𝐵 =𝐼𝐼𝐼𝐼𝐴𝐴𝐼𝐼𝐴𝐴𝐼𝐼𝐼𝐼𝐴𝐴𝑙𝑙𝐼𝐼 𝑙𝑙𝐼𝐼𝐴𝐴𝑙𝑙𝐴𝐴𝐴𝐴𝐴𝐴𝐴𝐴𝐴𝐴𝐴𝐴𝐴𝐴 𝐴𝐴𝑙𝑙𝑙𝑙𝐴𝐴 (2)
Construction of analytical database
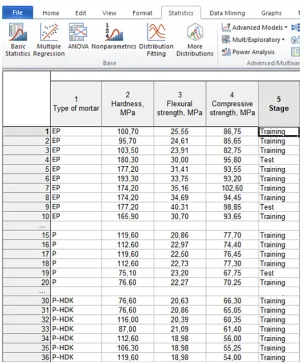
The obtained test results are summarized in a table, which subsequently serves as a data sheet necessary to carry out the analyses using the Statistica 12 software package. A fragment of the table is shown in Figure 2. The data table contained 5 columns. In the first one, the infor -mation about the type of resin used to make the mortar is presented. It was, respectively, epoxy (EP), polyester (P) and polyester with the addi-tion of colloidal silica (P-HDK). The mortar also contained, respectively, from 0–15% modifier in the form of a glycolisate obtained on the basis of PET waste. The mortar type here was a group-ing variable identifygroup-ing the type of mortar. The next three columns contain the values of three input variables, i.e. hardness, flexural strength and compressive strength. The final, 5th column lists the labels assigned to the samples at random. This variable has the character of the sample ID. It enables to distinguish between the samples to be analysed (Training) and the sample intended for cross-checking (Test) allowing the assessment of the quality of the classifier.
RESULTS AND DISCUSSION
Descriptive statistics
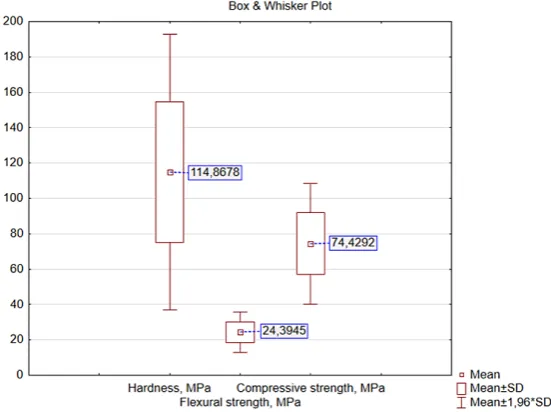
For the purpose of graphical assessment of laboratory data sets, a box and whisker plot was produced, showing the ranges of the described variables marked in the studies (Figure 3). On the basis of Figure 3, it can be concluded that the variables are significantly different in terms of the average value of variables. This forces the application of the standardization procedures dur-ing the construction of the classification model by means of discriminant analysis. The basic meas-ures for the marked variables are included in the table shown in Figure 4. For all three variables, histograms were also produced, and the Shapiro-Wilk normality test was carried out. The obtained results are presented in Fig. 5.
Discriminant analysis
Discriminant analysis was carried out using the Multivariate exploration techniques module available in the Statistica 12 software package.
Two stages of building the model were distinguished:
1. Learning stage. Building a classifier using cases that make up the training set, marked in the table as Training – a total of 30 cases. At this stage, the discriminant function analysis is used to decide which variables allow the best way to divide a given set of cases into naturally occurring groups.
2. Test stage. Classifier validation using the cas -es labelled Test. For this purpose, 2 cases for each type of mortar, previously selected from the entire data set, were used, which created a 6-piece test set allowing for the assessment of prognostic correctness of the designated discriminant functions with the cross-analysis method.
218
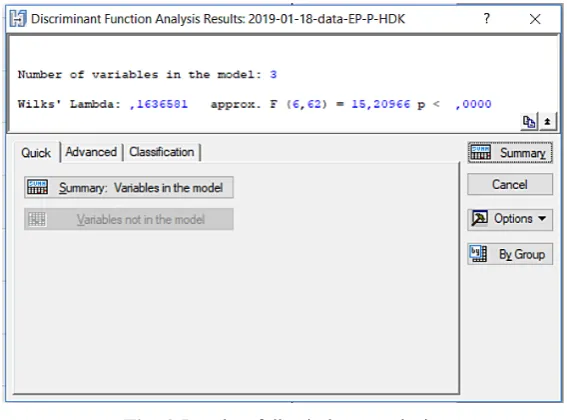
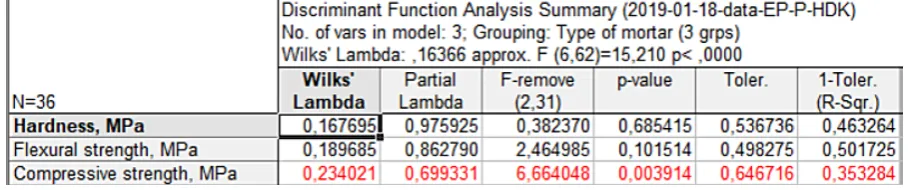
samples produced, i.e.: hardness, flexuralstrength and compressive strength. Thus, it can be deter-mined if these variables can be used to test wheth-er the tested mortars belong to these three groups. One of the basic assumptions of the possibility of applying the discriminant analysis is the origin of data from a population with a multivariate normal distribution. In the case of the analysed mortars this assumption is violated, as evidenced by the results of the Shapiro-Wilk normality test shown in Figure 5. Only in the case of the compressive strength variable is the normality condition met. Despite this, an attempt was made to apply the discriminant analysis to the classification of mor -tar types. The simulation studies carried out in recent years using the Monte Carlo methods have shown empirically that the impact on the obtained results of non-compliance with the assumption of normality is negligible [15]. The results of the discriminant analysis carried out are presented in Figures 6–8. They show that among the three predictors used, only the compressive strength parameter plays a significant role in discrimina -tion (p < 0.05). The frac-tional Wilks’ Lambda values (Fig. 7) indicate the contribution of indi-vidual variables in the predictive model. On this
basis, it can be concluded that after compressive strength, the largest share in the model is played by the flexural strength variable and the smallest by hardness. The results of the chi-square test car-ried out in the canonical analysis indicate the high significance of the generated discriminant func -tion (Figure 8). On the basis of this test, it can be concluded that only one discriminant function can be interpreted (only the first function is statis -tically significant, p < 0.05).
Determination of canonical discriminant functions was performed by calculating their co-efficients (Figure 9).
These coefficients relate to the standardized variables and refer to comparable ranges of at-tribute variability. Therefore, they may be used to interpret the variables that vary considerably in size, as is the case with the tested mortars (Figure 3). In the last two lines of the table pre-sented in Figure 9, there are eigenvalues (roots) and the cumulative ratio of the explained variance corresponding to each function. These param-eters allow us to conclude that the first function is responsible for almost 99% of the explained variance, i.e. almost 99% of the discriminative power is explained by this function. On the basis Fig. 3. Ranges of variables tested.
of the table containing mean canonical variables (Figure 10), it can be concluded that the consid-ered discriminant function mainly differentiates the mortars obtained on the basis of epoxy resin.
This interpretation is also confirmed by the analysis of the scatterplot of non-standardized values of the first function with respect to the val -ue of the second function presented in Figure 11.
a) b)
c)
Fig. 5. Histograms of the variable distribution: (a) hardness, (b) flexural strength, (c) compressive strength.
220
The points corresponding to the epoxy mor-tars are placed much more to the left in the figure (they take negative values for the first function), so this discriminant function mainly distinguishes this type of mortar.
The classification functions assume a linear model of the general form described by formula (1). The coefficients of these functions enabling the classification of cases are presented in the ta -ble shown in Figure 12.
The values of the calculated coefficients were used to create linear classification functions K1, K2 and K3 in the form (3)-(5):
𝐾𝐾1= −49.6562 − 0.151 ∗ 𝐻𝐻𝐻𝐻𝐻𝐻𝐻𝐻𝐻𝐻𝐻𝐻𝐻𝐻𝐻𝐻 + 2.0837 ∗ 𝐹𝐹𝐹𝐹𝐻𝐻𝐹𝐹𝐹𝐹𝐻𝐻𝐻𝐻𝐹𝐹𝐻𝐻𝐹𝐹𝐻𝐻𝐻𝐻𝐻𝐻𝐹𝐹𝐹𝐹ℎ + 0.9296 ∗ 𝐶𝐶𝐶𝐶𝐶𝐶𝐶𝐶𝐻𝐻𝐻𝐻𝐻𝐻𝐻𝐻𝐶𝐶𝐶𝐶𝐻𝐻𝐻𝐻𝐹𝐹𝐻𝐻𝐻𝐻𝐻𝐻𝐹𝐹𝐹𝐹ℎ
𝐾𝐾1= −49.6562 − 0.151 ∗ 𝐻𝐻𝐻𝐻𝐻𝐻𝐻𝐻𝐻𝐻𝐻𝐻𝐻𝐻𝐻𝐻 + 2.0837 ∗ 𝐹𝐹𝐹𝐹𝐻𝐻𝐹𝐹𝐹𝐹𝐻𝐻𝐻𝐻𝐹𝐹𝐻𝐻𝐹𝐹𝐻𝐻𝐻𝐻𝐻𝐻𝐹𝐹𝐹𝐹ℎ + 0.9296 ∗ 𝐶𝐶𝐶𝐶𝐶𝐶𝐶𝐶𝐻𝐻𝐻𝐻𝐻𝐻𝐻𝐻𝐶𝐶𝐶𝐶𝐻𝐻𝐻𝐻𝐹𝐹𝐻𝐻𝐻𝐻𝐻𝐻𝐹𝐹𝐹𝐹ℎ (3)
𝐾𝐾2= −88.326 − 0.1649 ∗ 𝐻𝐻𝐻𝐻𝐻𝐻𝐻𝐻𝐻𝐻𝐻𝐻𝐻𝐻𝐻𝐻 + 2.8263 ∗ 𝐹𝐹𝐹𝐹𝐻𝐻𝐹𝐹𝐹𝐹𝐻𝐻𝐻𝐻𝐹𝐹𝐻𝐻𝐹𝐹𝐻𝐻𝐻𝐻𝐻𝐻𝐹𝐹𝐹𝐹ℎ + 1.1773 ∗ 𝐶𝐶𝐶𝐶𝐶𝐶𝐶𝐶𝐻𝐻𝐻𝐻𝐻𝐻𝐻𝐻𝐶𝐶𝐶𝐶𝐻𝐻𝐻𝐻𝐹𝐹𝐻𝐻𝐻𝐻𝐻𝐻𝐹𝐹𝐹𝐹ℎ
𝐾𝐾2= −88.326 − 0.1649 ∗ 𝐻𝐻𝐻𝐻𝐻𝐻𝐻𝐻𝐻𝐻𝐻𝐻𝐻𝐻𝐻𝐻 + 2.8263 ∗ 𝐹𝐹𝐹𝐹𝐻𝐻𝐹𝐹𝐹𝐹𝐻𝐻𝐻𝐻𝐹𝐹𝐻𝐻𝐹𝐹𝐻𝐻𝐻𝐻𝐻𝐻𝐹𝐹𝐹𝐹ℎ + 1.1773 ∗ 𝐶𝐶𝐶𝐶𝐶𝐶𝐶𝐶𝐻𝐻𝐻𝐻𝐻𝐻𝐻𝐻𝐶𝐶𝐶𝐶𝐻𝐻𝐻𝐻𝐹𝐹𝐻𝐻𝐻𝐻𝐻𝐻𝐹𝐹𝐹𝐹ℎ (4)
𝐾𝐾3= −35.0257 − 0.1282 ∗ 𝐻𝐻𝐻𝐻𝐻𝐻𝐻𝐻𝐻𝐻𝐻𝐻𝐻𝐻𝐻𝐻 + 1.92 ∗ 𝐹𝐹𝐹𝐹𝐻𝐻𝐹𝐹𝐹𝐹𝐻𝐻𝐻𝐻𝐹𝐹𝐻𝐻𝐹𝐹𝐻𝐻𝐻𝐻𝐻𝐻𝐹𝐹𝐹𝐹ℎ + 0.7218 ∗ 𝐶𝐶𝐶𝐶𝐶𝐶𝐶𝐶𝐻𝐻𝐻𝐻𝐻𝐻𝐻𝐻𝐶𝐶𝐶𝐶𝐻𝐻𝐻𝐻𝐹𝐹𝐻𝐻𝐻𝐻𝐻𝐻𝐹𝐹𝐹𝐹ℎ
𝐾𝐾3= −35.0257 − 0.1282 ∗ 𝐻𝐻𝐻𝐻𝐻𝐻𝐻𝐻𝐻𝐻𝐻𝐻𝐻𝐻𝐻𝐻 + 1.92 ∗ 𝐹𝐹𝐹𝐹𝐻𝐻𝐹𝐹𝐹𝐹𝐻𝐻𝐻𝐻𝐹𝐹𝐻𝐻𝐹𝐹𝐻𝐻𝐻𝐻𝐻𝐻𝐹𝐹𝐹𝐹ℎ + 0.7218 ∗ 𝐶𝐶𝐶𝐶𝐶𝐶𝐶𝐶𝐻𝐻𝐻𝐻𝐻𝐻𝐻𝐻𝐶𝐶𝐶𝐶𝐻𝐻𝐻𝐻𝐹𝐹𝐻𝐻𝐻𝐻𝐻𝐻𝐹𝐹𝐹𝐹ℎ (5) Fig. 7. Evaluation of the suitability of variables in the discriminant analysis.
Fig. 8. The results of chi-square test with successive canonical roots.
Fig. 9. Standardized discriminant function coefficients.
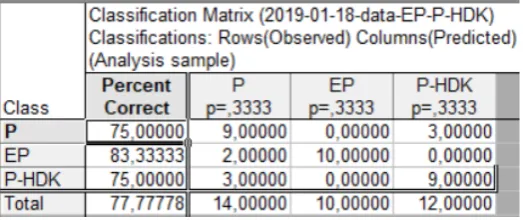
The table shown in Figure 13 contains the results pertaining to the correctness of the clas-sification process carried out for the training set (30 cases). It can be concluded that 77.78% of cases were classified correctly. The designated classification functions (K1, K2, K3) enable to classify new cases. A mortar obtained on the ba-sis of a given resin is included in the group for which the value of the classification function is the highest.
In the second stage, the model created was used to predict the type of mortar. The correct-ness of the operation of the designated classifi -cation functions was checked by classifying the cases from the drawn test set (column 5, Fig. 2), i.e. those that had not been previously used to calculate the function coefficients K1, K2 and K3 (cross-evaluation). The obtained results are pre-sented in the table shown in Fig. 14.
Comparing the results from both tables (Figures 13 and 14), it can be concluded that the average percentage of the correctly classi-fied mortars for the test sample is slightly larger (83.3%) than the result obtained for the training
set (77.78%). This is probably related to the fact that the predictive capability of the classification functions generated is assessed only on the set of 6 data points drawn from the studied sample (the remaining data were the test sample), and not, for example, on the new data obtained as a result of planning and implementing a similar research experiment.
Decision trees
The second of the suggested algorithms for searching for patterns characterizing the relation-ships occurring between the data stored in the da-tabase was carried out with a method allowing the presentation of the results in the form of a clas-sification tree. The advantage of this method is the lack of initial assumptions regarding data dis-tributions, which is especially useful in the situ-ations where the correlated data occur. The
Clas-sification Trees module available in the Statistica
12 software package was used to build a decision tree allowing for the classification of the studied mortars into three groups. The median variability
Fig. 11. Scatterplot for the first two discriminant functions.
222
intervals for the values of strength parameters and hardness were used to build the tree. As in the case of the discriminant analysis method, the decision tree was determined based on the input data contained in the table, part of which is shown in Figure 2. Thirty randomly selected mortar sam-ples constituted the training sample used at the tree construction stage, while 6 cases formed a test group, used to evaluate the tree built. The first step assessed the validity of all three vari -ables that were the results of laboratory tests. The results of the ranking are shown in Figure 15.
The analysis of the obtained results shows that the strength parameters are far more impor-tant, and much less the mortar hardness. A classi-fication tree was generated, the structure of which is shown in Figure 16. Such a decision tree can be exchanged for three classification rules:
Rule 1: if Compressive strength > 82.734 MPa then EP
Rule 2: if Compressive strength ≤ 82.734 MPa and Flexural strength ≤ 21.137 MPa then P-HDK
Rule 3: if Compressive strength ≤ 82.734 MPa and Flexural strength > 21.137 MPa then P The number of splits (2) given in the header of Fig. 16 means the number of decision nodes, i.e. the number of questions in the system. The number of terminal nodes was 3. They represent the “leaves” of the decision tree and indicate the
type of group identified. The attribute of com -pressive strength was found in the root of the tree. It proved to be the most important decision at-tribute (this is confirmed by the results obtained by means of discriminant analysis). The value of flexural strength was then examined. The least important parameter was hardness. We do not ask about the value of this parameter by analysing the decision tree or applying classification rules. This attribute proved to be redundant and, in this case, it does not have to be determined, which signifi -cantly speeds up the testing of composite samples in the laboratory.
While analysing the content of leaf nodes, it can be concluded that epoxy mortars form a well-isolated set, as in this case only one decision path leads to a leaf, while for the other groups – two. The tables showed in Figures 17 and 18 present the results of the effectiveness of classifying the generated decision tree for the training and test data sets respectively.
While analysing these results, it can be con-cluded that among 30 cases forming the teaching set, all of the mortars were classified correctly. However, from a set of 6 mortars forming the test group, one sample was classified incorrectly. Thus, the classification efficiency of the generat -ed decision tree for the training set is 96.67%, and for the test set 83.33%. These results are better than those obtained with the discriminant method. Fig. 13. Classification matrix of cases from the training group.
Fig. 15. Evaluation of the validity of predictors for the decision tree method.
Fig. 16. Classification tree.
224
CONCLUSIONS
After application, the following conclusions can be drawn for the classification of the three types of resin mortars, two methods of data min-ing, i.e. discriminant analysis and decision trees, and a comparison of the obtained results:
• Both of the methods confirmed that the com -pressive strength is the most important vari-able that allows the discrimination of mortars with different types of resin.
• In the case of discriminant analysis, one dis-criminant function can be interpreted (only the first one is statistically significant (p <0.05)), because it explains almost 99% of the entire discriminant power.
• Both methods confirmed that epoxy mortars constitute a well-isolated collection. In the case of the discriminant analysis methods, the elements of this set are placed on the scatter-plot much more to the left, so the first discri -minant function mainly distinguishes this type of mortar from the other two. However, there is only one decision path in the classification tree chart for epoxy mortars.
• Methods of discriminant analysis and deci-sion trees showed that for the classification of the tested mortars the decisive parameter is compressive strength, flexural strength was less important and the least significant was hardness.
• The K1, K2, K3 functions determined in the discriminant analysis enable the classifica -tion of new cases belonging to the test set, which was not used to calculate the function coefficients.
• Classification can also be successfully carried out using decision trees or a set of classifica -tion rules. In this case, the classifica-tion ef -fectiveness for the training set is significantly better than in the case of discriminant analysis and amounts to 96.67%.
• The predictive capacity of both data mining methods was the same, as the correctness of classification of mortars belonging to the test set amounted to 83.33%. Typically, these re-sults can be improved by extending the data-base, thus introducing the measurement results of the properties of new polymer composites, obtained in a similar manner, into the data set.
• The conclusion that compressive strength is the most important parameter (when com-pared with flexural strength and hardness, strictly interrelated), is obvious, at least from the mechanical point of view. In this sense, the results given by the algorithms can be under-stood as the verification of the correctness also in the mechanics of materials field.
This research did not receive any specific grant from funding agencies in the public, com-mercial, or not-for-profit sectors.
On behalf of all authors, the corresponding author states that there is no conflict of interest.
REFERENCES
1. Czarnecki L. 2010. Polymer concretes. Cement Lime Concrete, 2, 63–85.
2. Lokuge W., Aravinthan T. 2013. Effect of fly ash on the behaviour of polymer concrete with different types of resin. Materials and Design, 51, 175–181. 3. Dębska B., Lichołai L. 2016. The effect of the type of curing agent on selected properties of epoxy mortar modified with PET glycolisate. Construc -tion and Building Materials, 124, 11–19.
4. Dębska B., Lichołai L. 2016. Resin Composites with High Chemical Resistance for Application in Civil Engineering. Periodica Polytechnica-Civil Engineering, 60(2), 281–287.
5. Radkiewicz P. 2010. Analiza dyskryminacyjna. Podstawowe założenia i zastosowania w badani -ach społecznych. Psychologia Społeczna, 2–3(14), 142–161 (in Polish).
6. Quinlan J. R. 1986. Induction of Decision Trees. Machine Learning, 1, 81–106, Kluwer Academic Publishers. http://hunch.net/~coms-4771/quinlan. pdf. (Accessed 12 July 2019).
7. Rokach L., Maimon O. 2008. Data mining with decision trees: theory and applications. World Sci-entific Pub Co Inc.
8. Feldesman M. R. 2002. Classification Trees as an Alternative to Linear Discriminant Analysis. American Journal of Physical Anthropology, 119, 257–275.
9. Yong L. 2006. Predicting materials properties and behavior using classification and regression trees. Materials Science and Engineering: A, 433, 261–268.
10. Hajigholizadeh M., Melesse A. M. 2017. Assort-ment and spatiotemporal analysis of surface water quality using cluster and discriminant analyses. Catena, 151, 247–258.
11. Dębska B. J., Guzowska-Świder B. 2011. Decision Trees in Selection of Featured Determined Food Quality. Analytica Chimica Acta, 705, 261–271. 12. Oro S. R., Neto A. Ch., Mafioleti T. R., Ribeiro
Pardo Garcia S., Neumann Júnior C. 2016. Multi-variate analysis of the displacements of a concrete dam with respect to the action of environmental conditions. Independent Journal of Management and Production, 7, 526–545.
13. Vítková G., Prokeš L., Novotný K., Pořízka P., No -votný J., Všianský D., Čelko L., Kaiser J. 2014. Comparative study on fast classification of brick samples by combination of principal component analysis and linear discriminant analysis using stand-off and table-top laser-induced breakdown spectroscopy. Spectrochimica Acta Part B, 101, 191–199.
14. Dębska B. 2018. The use of discriminant analysis methods for diagnosis of the causes of differences in the properties of resin mortar containing various fillers. E3S Web of Conferences, 00017, 49, 1–10. https://doi.org/10.1051/e3sconf/20184900017. 15. Moczko J. 2003. Wybrane metody eksploracji