S/N Items SLM LM NLM SNLM
1 I am curious about why things work the way they do.
2 I have interest in developing and maintaining sound knowledge. 3 I like to sort out facts and analyse information.
4 I thoughtfully weigh multiple sides before taking a decision. 5 I take time to reflect before taking any action.
6 I am always ready to entertain new ideas. 7 I always give consideration to alternative opinions. 8 I am always considerate about the opinions of others. 9 I like to probe deeply into any information on my studies.
10 It is not difficult for me to state questions, opinions, and thoughts in an understanding way.
-11 I think clearly and thoroughly through any idea, information or thoughts at all times.
12 I am good at pointing out inconsistencies in someone and other people’s ideas. 13 I am precise when discussing issues.
14 I prefer to deal with the difficult questions asked in my subjects.
15 I consider other persons’ viewpoints and not my own.
16 I find myself accepting information without finding out if it is true or not.
17 Most of the times my assumptions on issues are not right. 18 I am always fair-minded when I consider issues. 19 I am only concerned about my personal opinions. 20 I consider my argument to be sensible always. 21 I argue out of point most of the time. 22 My thinking is not always easy to understand.
Advised by Benson Adesina Adegoke, University of Ibadan, Ibadan, Nigeria
received: February 23, 2015 accepted: April 19, 2015
Olubukola Oyediji M.Ed in Counselling Psychology/ PhD (Educational Evaluation), Senior Assistant Registrar (Counselling) / Head of Unit of University Counselling and Careers Unit, Lagos State University, Ojo, Lagos, Nigeria.
Phone: +2348032372852. Email: [email protected]
Eugenia Okwilagwe PhD in Educational Evaluation, Associate Professor, Institute of Education, University of Ibadan, Ibadan, Nigeria.
Phone: +234803519155.
Email: [email protected]
US STUDENT PERFORMANCE IN SCIENCE:
A REVIEW OF THE FOUR MAJOR SCIENCE
ASSESSMENTS
Susan Poland George Mason University, Fairfax, USA E-mail: [email protected]
Linda Plevyak University of Cincinnati, Cincinnati, USA
E-mail: [email protected]
Abstract
The purpose of this research is to review the nature of four major science assessments administered in the United States: the ACT, PISA, TIMSS, and NAEP. Each assessment provides a very different view into US student performance in science. The TIMSS and PISA are international assessments of student performance and are often cited as evidence that US students are underperforming in comparison to their international peers. The NAEP is used to assess student knowledge of science across multiple age ranges in the United States. Finally, the ACT is administered to college-bound students who elect to take the exam. The underlying philosophies and basic structures of each assessment are explored, and comparisons and contrasts between the assessments are drawn. Historical student performance on each assessment is also analyzed. Analysis of these assessments suggests that US students struggle to apply
scientific skills at the high school level, while US middle and elementary students understand scientific
content knowledge well.
Key words: student performance, science assessment, STEM education, standardized testing.
Introduction
in recent years, the united states has become increasingly interested in student
performance in STEM fields, or the fields of “science, technology, engineering, and math.”
there are many potential reasons for this heightened concern, but the performance of us students on standardized science tests is certainly one of the major reasons why americans
are questioning student abilities in STEM fields. The 2009 “Program for International Student Assessment,” or “PISA” test, indicated that US 15-year-old students are performing on average with students from around the globe in the field of science. Though average, twelve countries,
including Germany, the united Kingdom, Japan, finland, the republic of Korea, and canada,
earned significantly higher scores on the PISA science test than their American counterparts (Fleischman, Hopstock, Pelczar, & Shelley, 2010). This was an improvement over the science PISA scores from 2006 which indicated that US students were performing below average as
compared to their international peers, with 22 countries outperforming us students (baldi et
al., 2007).
Similarly, 2012 test data from the ACT, one of the major college-readiness tests taken in the United States, indicated that only 31% of test-taking students have met the college-ready benchmark for science. To compare, 46% of test-takers are deemed college-college-ready in mathematics and 67% of test-takers are deemed college-ready in English (ACT, Inc., 2012).
the pisa and act statistics indicate that us students have struggled in recent years in the
field of science. Perhaps more ominously, as national security concerns and the global economy
rapidly evolve, these statistics warn that the future generation may not be able to maintain the
54 interestingly, however, testing data of younger students tells a different story from that
which is told through the ACT and PISA testing data. Data from the 2011 Trends in International Mathematics and Science Study, or “TIMSS” assessment, suggests that American fourth and eighth grade students are performing at a higher level than their international peers in the field of science. US fourth grade students performed among the top ten education systems tested around the world. Only six education systems achieved a score that was measurably above
the score of the united states – Korea, singapore, finland, Japan, the russian federation, and
Chinese Taipei. Similarly, American eighth grade students also achieved an above-average score as compared to their international peers. US eighth grade students were among the top 13 countries tested in the field of science. Only eight countries – Singapore, Chinese Taipei,
the republic of Korea, Japan, finland, slovenia, the russian federation, and hong Kong –
achieved scores that were significantly above the scores of US students (Provasnik et al., 2012).
test scores from within the united states also suggest that eighth grade students are improving
in science performance in recent years. From 2009 to 2011, US eighth grade students improved their national average science score by a statistically-significant two points on the National Assessment for Educational Progress, or “NAEP” (US Department of Education, 2012).
taken together, the data suggest that younger american students are more competitive
when compared to their peers around the world than the American high school students. This is perhaps an exciting finding, as it might suggest that science education within the United
states is improving and our younger students are becoming more competitive with their
international peers in the field of STEM. But, is this a fair claim to make? The following pages will explore potential reasons why younger American students seem to be more competitive with students their age than American high school students. This paper will examine the history
of standardized science testing in the united states, and will include an overview of the material
assessed through the ACT, PISA, TIMSS, and NAEP assessments. This paper will also examine
the historical performance of us students on national and international science tests, and
differences in tested student populations from around the world. The paper will conclude with possible explanations to the following research question: “Why do younger American students
appear to be more competitive with their international peers than american high school students
in science?” And is it even possible to compare the performance of students across grade levels given the differences between these tests?
After briefly exploring the current science achievement, it is natural to ask, “Why is testing important now?” National and international testing has exploded since the 1990s, as discussed in Kamens and McNeely (2010). Globally, “81 percent of developed countries have conducted national assessments as of 2006, and 51 percent of developing countries have also done so” (Kamens and McNeely, 2010, p. 19). The need for assessment is largely economic, to ensure that students are on-track to compete in the future in the global economy, but Kamens
and mcneely point out that,
Newer views of education and its purposes expand education culturally, beyond linkages to the economy and to development in economic terms only… a vast array of concerns now marks education policy, including human rights, gender inequality, and rural-urban gaps. furthermore, policy makers are less likely to view the purpose of education as training workers to fit into a stable economic system and occupational structure. Rather, they are more likely to focus on predicting skill sets required for future national economic success, emphasizing the goal of producing intellectually flexible workers who can adjust to future skill demands. (p. 10).
Fiala (2007) explored the changes in educational agendas from 1955 to 2000 and found
that modern school agendas focus three main points: full development for all individuals, the rights to democracy and equality for all people, and the development of the nation and its
55
the world looks to STEM fields to grow the economy and solve the many problems that have developed due to rapid population growth and resource use. The interest in standardized science testing will most likely only increase in the future as the public equates scientific success to a strong economy and the possibility of a healthier planet and society.
Research Background
Without a clear understanding of what is assessed through the TIMSS, ACT, PISA, and NAEP, testing statistics are quite unhelpful. The major assessments discussed in this paper
have many similarities, but also stark differences in how they evaluate student performance
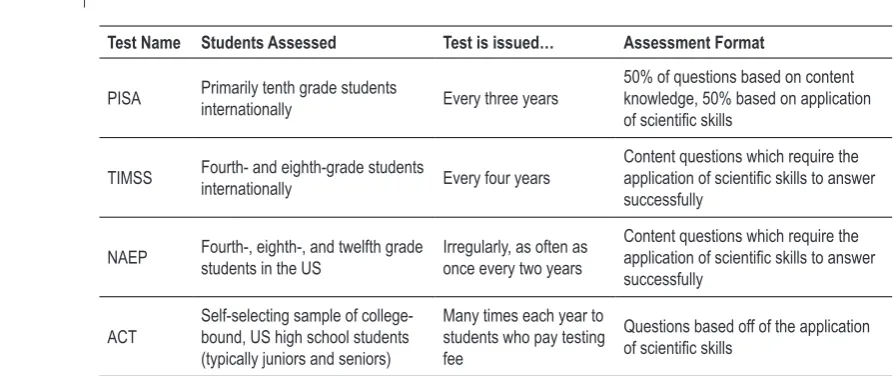
in science. Because of this, making comparisons across different student age groups can be difficult unless we understand where commonalities in these assessments lie. The nature of each assessment is explained in detail below, and Table 1 on page 7 summarizes this information.
PISA
The Programme for International Student Assessment, or PISA, is a test given to 15-year-old students every three years. The PISA assessment is considered high stakes for countries who administer it, with no impact on students who take it. The assessment measures student performance in reading, mathematics, and science. PISA was first administered in 2000, with 2012 being the latest PISA assessment in which testing data is available. The test is supported by the “Organization for Economic Co-operation and Development,” or OECD, whose mission is “to promote policies that will improve the economic and social well-being of people around the world” (“OECD: About the OECD,” 2013). Thirty-four countries are members of OECD, and all OECD countries participate in the PISA assessment along with students from other nations. In 2009, 65 countries and economies (economies do not represent an independent nation, such as Shanghai-China) participated in the PISA assessment and an additional 9 economies took the 2009 assessment in 2010 (“OECD programme,” 2013).
According to PISA, the science assessment is an assessment of “science literacy.” The assessment is based off of three major competencies in the realm of scientific literacy; how well
students:
Identify scientific issues 1.
Explain phenomena scientifically 2.
Use scientific evidence. (Programme for International Student Assessment, 2009, p. 126) 3.
pisa states:
The PISA science assessment encompasses a continuum of scientific knowledge and the cognitive abilities associated with scientific enquiry, incorporates multiple dimensions, and addresses the relationships between science and technology. It provides an assessment of students’ scientific literacy by assessing their capacity to use scientific knowledge. (2009, p. 127)
Content knowledge is applied in approximately 50% of the test questions (named
“knowledge of science,” including physical, living, earth and space, and technical systems) and
the remaining 50% of the questions are focused on “knowledge about science,” specifically
56 TIMSS
The “Trends in International Mathematics and Science Study,” or TIMSS assessment is issued to fourth and eighth grade students every four years. Similarly to the PISA assessment,
the timss assessment is considered high stakes for countries who administer it, with no impact
on students who take it. The assessment was first given in 1995, with 2011 assessment being the most recent (Provasnik et al., 2012). Like the PISA, nations may choose to participate in this assessment as a whole, and some countries also have “benchmarking participants,” whose scores are included in the national average score but also are reported as a separate entity. For example, students in Florida and Massachusetts (among other states) were considered “benchmarking participants” in the 2011 TIMSS assessment. Student scores from Florida and
massachusetts were included in the national average score calculation, but both florida and
Massachusetts also received scores on student performance within their state alone. In 2011, 52 countries and seven benchmarking participants issued the fourth grade assessment, and 45 countries and 14 benchmarking participants issued the eighth grade assessment (Martin, Mullins, Foy, & Stanco, 2012).
Each TIMSS assessment is composed of approximately 50% multiple choice questions and 50% extended response questions. Students may receive partial credit for answers to extended response questions. The TIMSS assessment, unlike the PISA assessment, structures each question within a “content domain” and a “cognitive domain.” This means that each question relies on the student’s ability to use scientific processes as well as content knowledge to find the correct answer to each question. Each test question fits into one of the following cognitive domains: applying, knowing and reasoning. At the fourth grade level, three content areas are assessed: life science, physical science, and earth science. At the eighth grade level, four content areas are tested: chemistry, biology, earth science, and physics (Provasnik et al., 2012).
NAEP
The “National Assessment of Educational Progress,” or NAEP, is an assessment given to students in grades four, eight, and twelve across the United States. NAEP was first administered in 1969 as a way to measure educational progress in a wide variety of subjects. Early tested
subjects included writing, citizenship, literature, music, career/occupational development,
mathematics, and art (“Timeline for national assessment,” 2012). In recent years, NAEP has been focused on more specific subjects of study due to NAEP testing provisions outlined in
the reauthorization of the elementary and secondary education act, or no child left behind
Act (NCLB) of 2001. NCLB outlined that the National Assessment of Educational Progress
would take place every two years and assess fourth and eighth grade knowledge of reading and
mathematics. It also stated, “To the extent that time and money allow, NAEP will be conducted in grades 4, 8, and 12 at regularly scheduled intervals in additional subjects including writing, science, history, geography, civics, economics, foreign language, and arts” (“Important Aspects,” 2005). This means that NAEP science testing is not mandatory according to current law.
during a given naep assessment, data is collected that is meant to represent the nation
57
The science NAEP was most recently administered in 2011, and the test was designed according to the same framework upon which the 2009 science assessment was built. The
2009 and 2011 NAEP assessments were based off of the National Science Education Standards
released in 1996 and Benchmarks for Scientific Literacy released in 1993 (U.S. Department
of Education, 2011). Previously, the framework for science tests was inconsistent, so year-to-year comparisons in student performance were not accurate. The 2009 NAEP assessed student understandings of science in grades 4, 8, and 12 (U.S. Department of Education, 2011), while the 2011 assessment was only administered to eighth grade students (U.S. Department of Education, 2012). Like the TIMSS, students are expected to apply both content knowledge and scientific practices when answering questions. Each question falls into one of three content domains, physical science, earth science, or life science. The weight of each content section varies by grade level. This is intended to correlate with the topics that students are taught in the specific grade level. For example, 41% of the assessment questions on the 2011 NAEP were based on
earth and space science knowledge, a subject heavily emphasized in many eighth grade science
classrooms (“Distribution of science questions,” 2012). Each question also falls into one of
four science practice domains: identifying science principles, using science principles, using
scientific inquiry, and using technological design. Questions are structured as multiple-choice or extended response questions (U.S. Department of Education, 2012).
ACT
The American College Test, or ACT, is a college-readiness test typically taken by juniors and seniors in high school (usually between the ages of 16 and 18). Unlike the other assessments discussed above, the ACT is not a mandatory test though it is considered a high stakes exam for
those students trying to get into a university, meaning nationwide performance on the act is
determined by a self-selecting sample of students who are most likely college-bound. The ACT
is not taken during school hours and students must pay to take the assessment unless they obtain
a fee-waiver. The test examines student knowledge in four subject areas: English, mathematics, science, and reading. These subject areas are examined in a multiple-choice format. Students may also choose to take a fifth subject test – writing – but this test is not required. The writing test requires students to write a short essay on a given prompt. It is the only portion of the test that requires students to give written responses (ACT, Inc., 2007).
The science portion of the ACT is a 35-minute assessment with a total of forty multiple-choice questions. The questions are based off of seven prompts containing scientific information for student interpretation. The information can be “conveyed in one of three different formats: data representation (graphs, tables, and other schematic forms), research summaries (descriptions of several related experiments), or conflicting viewpoints (expressions of several related hypotheses or views that are inconsistent with one another)” (ACT, Inc., 2007, p. 7). Approximately 38% of the test questions rely on data representation prompts, 45% of test questions rely on research summaries, and 17% of the test is based off of conflicting viewpoint prompts. Four scientific content areas – biology, earth/space science, physics, and chemistry – are represented within these questions. According to ACT, Inc. (2007),
advanced knowledge in these subjects is not required, but background knowledge
acquired in general introductory science courses is needed to answer some of the questions. The test emphasizes scientific reasoning skills over recall of scientific content, skill in mathematics, or skill in reading. Minimal arithmetic and algebraic computations may be required to answer some items (p. 12).
the test is based off of the assumption that all students have taken at least two years of
58 Table 1. An overview of testing formats.
Test Name Students Assessed Test is issued… Assessment Format
PISA Primarily tenth grade students internationally Every three years 50% of questions based on content knowledge, 50% based on application of scientific skills
TIMSS Fourth- and eighth-grade students internationally Every four years Content questions which require the application of scientific skills to answer
successfully
NAEP Fourth-, eighth-, and twelfth grade students in the US Irregularly, as often as once every two years Content questions which require the application of scientific skills to answer
successfully
ACT Self-selecting sample of college-bound, US high school students (typically juniors and seniors)
Many times each year to students who pay testing fee
Questions based off of the application
of scientific skills
Results and Discussion
apart from the differences in test construction, administration, and targeted age group/
audience, one major difference appears among all four tests. In examining the PISA, TIMSS, NAEP, and ACT science assessments, it is apparent that each test defines “scientific literacy” in a different way. Most notably, each test places a different level of emphasis on scientific content knowledge. The ACT places nearly complete emphasis on the use of scientific skills, with very little emphasis on content knowledge, and 50% of test questions on the PISA are based off of “scientific enquiry and explanations” which require very little content knowledge. Conversely, the TIMSS and NAEP assessments are structured so each question is broken into a specific content area. Each TIMSS question is then broken into a “cognitive domain” within the content area, and each NAEP question falls into a “scientific practice domain.” In both assessments, the content area is emphasized before the scientific practice.
Of the four tests examined, the NAEP and TIMSS appear to be most similar because they assess fourth and eighth grade students and have similar test designs. Upon a deeper examination, however, Provasnik et al. (2012) found that there are key differences between the assessments. The TIMSS and NAEP differ in the content areas emphasized at each grade level, and also differ in content alignment. When TIMSS science assessment data is mapped within the NAEP science framework, “31 percent of TIMSS 4th-grade items and 23 percent of TIMSS 8th-grade items could not be fit with any content statement in the NAEP 2011 science framework” (Provasnik et al., 2012, p. C-1). Since NAEP is designed to align with national standards of education, this indicates that a significant portion of the material assessed on the TIMSS is not aligned to what is taught in US schools.
in short, the major differences in content assessed through these four assessments
make drawing comparisons of test scores difficult. The achievement of high school students on the PISA and ACT science assessments would be difficult to compare to the achievement
levels of fourth and eighth grade students on the naep and timss assessments because the
tests are based off of frameworks that emphasize different content areas and skills. In order
to more accurately compare the achievement of different age groups of students, it may be
useful to compare specific content or skill areas to one another (i.e., comparing physical science
performance on timss to physical science performance on naep, or graph reading on pisa
59
comparing the scientific analysis skills of students from PISA to NAEP and TIMSS scores is not possible. The addition of specific questions solely assessing scientific analysis skills on the NAEP and TIMSS would make comparisons across scores more feasible.
to better understand the achievement gap between us secondary and elementary/ middle school students, the historical scores of us students on science standardized tests
will be examined in greater detail. It is important to note that because of rapid changes in attitudes towards testing, the frameworks for many of these assessments have changed recently. This makes data from older assessments difficult to compare to student performance on more modern assessments, and in some cases, renders accurate long-term comparisons of student performance impossible.
Science ACT performance will be examined first. Average science ACT scores from 2000 on, as well as percentages of students deemed college-ready in science from 2007 on, can be found in Table 2. A note on college readiness benchmarks: according to ACT, Inc. (2014), “The ACT College Readiness Benchmarks scores on the ACT subject area tests that represent the level of achievement required for students to have a 50% chance of obtaining a B or higher or about a 75% chance of obtaining a C or higher in corresponding credit-bearing first-year college courses” (p. 19). Furthermore, research has shown that both the ACT and a student’s
high school class rank are the top two most reliable predictors of college success, accounting for
5.9 and 10.7%, respectfully, of the difference in GPA points between academically successful and unsuccessful students in college.
Table 2. Science ACT performance, 2000-2012.
Year 2000 2001 2002 2003 2004 2005 2006
Average Science Score 21.0 21.0 20.8 20.8 20.9 20.9 20.9
Year 2007 2008 2009 2010 2011 2012 2013 2014
Average Science Score 21.0 20.8 20.9 20.9 20.9 20.9 20.7 20.8
% of Students College-Ready in Sci
-ence 28 28 28 29 30 31 36 37
Data compiled from ACT, Inc. (2013, 2014)
Notably, average science assessment scores have not changed since 2000. The percentage of students deemed college-ready in science has gradually risen from 2007 when this metric was first measured, which may mean students are better prepared for college science courses.
however, the act lowered the college-ready benchmark score in 2013 from 24 to 23 (ACT, Inc., 2014), largely explaining the dramatic increase in students achieving the benchmark score between 2012 and 2013. The number of students ready for college-level science, according to the ACT, however, is still surprisingly low even with these gains.
the pisa, naep, and timss have far less historical data available because they are not
assessed annually. The PISA was first administered in 2000, and table C displays the US score against the performance of other tested nations since the first administration. Countries can fall into three score ranges – above average, average, and below average. The score range, US
score, and international average scores appear in table 3:
Table 3. US PISA scores compared to international peers, 2006-2012.
Year 2006 2009 2012
Score Range Below Average Average Average
US Student Score 489 502 497
Average Score of All Nations 498 501 501
60 PISA data suggests that US 15-year-old students slipped behind their international
peers for a period of time in the new millennium. Due to changes in the framework of the PISA science test before the 2006 test administration, only the 2006, 2009, and 2012 scores can be compared to one another, so we have chosen to include only these scores above. The score increase from 2006 to 2009 is statistically significant and indicated that US students were becoming increasingly scientifically literate. However, the 2012 score is not significantly different from the 2006 or 2009 scores (Kelly et al., 2013), indicating that US students have not made much sustained progress.
in comparison to the scores of their international peers, timss scores have remained
relatively consistent over time for fourth and eighth grade students. From 1995 to 2011, US
fourth grade students showed no measurable difference in achievement on the timss science
test, but eighth grade student scores measurably improved from 1995 to 2011. Below are the scores from the 1995, 2007, and 2011 administrations of the TIMSS assessment, as well as the corresponding standing of US students amongst their international peers. Fourth grade data is found in table 4 and eighth grade data is found in Table 5.
Table 4. TIMSSfourth grade student performance in science.
Year 1995 2007 2011
Score 542 539 544
Score Range Above Average Above Average Above Average
Table 5. TIMSS eighth grade student performance in science.
Year 1995 2007 2011
Score 513 520 525
Score Range Above Average Above Average Above Average
Data for tables 4 & 5 compiled from Gonzales et al., 2008; Provasnik et al., 2011
Finally, NAEP assessment results are displayed in table 6. While NAEP has been assessed since 1969 at irregular intervals, only data from the 2009 and 2011 administrations are shown
below because these are the only scores available on the current testing framework which can be
compared to one another. When taking the NAEP assessment, students can receive one of three score ratings, or receive no score rating (the lowest rating): “basic” indicates partial mastery of science concepts, “proficient” indicates students “have demonstrated competency over challenging subject matter,” and “advanced” which “represents superior performance” (U.S. Department of Education, 2011, p. 6). Table 6 displays the percentage of students achieving a score of “proficient” or above on the assessment. In 2009, fourth, eighth, and twelfth grade students participated in the NAEP assessment. In 2011, only eighth grade students participated. The score increase in eighth grade students from 2009 to 2011, from 150 to 152 on a scale of 300, is a statistically-significant improvement.
Table 6. Percentage of students achieving “proficient” scores or above (%).
Grade Level Year
2009 2011
Grade 4 34 *
Grade 8 30 32
Grade 12 21 *
61
With an understanding of recent scores and test structure in mind, a more accurate picture of US student achievement in science can be drawn. PISA data suggests that US high school students lack the ability to apply scientific skills, while TIMSS data suggests US
elementary and middle school students possess a strong understanding of content knowledge
and its applications when compared to their international peers. The difference between the
achievement of eighth and fourth grade students and the fairly low achievement of high school
students may be explained by the structure of the tests themselves. ACT and PISA data both suggest that high school students struggle to apply scientific skills – this may also be true of our
younger students, but the timss and naep do not accurately measure these abilities so this
assumption cannot be made. Conversely, high school students may possess a deep understanding of content knowledge, though 2009 NAEP data suggests that twelfth grade students struggle with scientific content knowledge, as well (U.S. Department of Education, 2011). With so little
testing data available to measure high school science content knowledge, however, data remains
inconclusive.
Sampled Student Bodies
PISA is given to students at age fifteen because “at this age students are approaching the end of compulsory education in most OECD countries” (Programme for International Student Assessment, 2009). In the United States, 15-year-old students are in their first or second year of high school and all students are required to attend these grades. This means that students
of all ability levels in the united states are included within the sample population on the
PISA examination. Some nations allow students to leave mandatory education in favor of
the work force or technical training far before the typical graduation age of eighteen in the
United States. Some believe that this produces a bias in scores, making other nations appear to achieve at a higher level on PISA because lower-achieving students who have left for technical training or the workforce are not represented. This could be a way to explain why younger US students appear to be more competitive with their international peers. On the PISA assessment, other nations would have a distinct advantage over the US because they only test the highest-achieving students as lower-highest-achieving students have already left the formal education system.
on the timss assessment, however, other nations would not have this advantage because all levels of students would be assessed at the fourth and eighth grade level because education is
compulsory at these grade levels in all nations.
Do these arguments have merit, however? PISA has outlined four target groups of
students that are to be included in the tested student population:
15-year-olds enrolled full-time in educational institutions;
●
15-year-olds enrolled in educational institutions who attended only on a part-time
●
basis;
students in vocational training programmes, or any other related type of ●
educational programmes; and
students attending foreign schools within the country (as well as students from ●
other countries attending any of the programmes in the first three categories). (OECD, 2012, p. 58).
by these guidelines, every student who is enrolled in any school within a given country
would be included in the tested population. The only students who would not be included would be 15 year-old students who are not attending any school.
PISA also sets guidelines for the number of students who are permitted to be excluded from the tested population. A maximum of 5% of students are permitted to be excluded from PISA assessments. Students may be excluded because they are intellectually, physically, or mentally disabled such that they cannot take an assessment, have insufficient language experience to take the assessment, or if the school is so remote that it is not feasible to be tested (OECD, 2012, p. 59). Nations are required to test a minimum of 150 schools, and quality monitors visit schools in each country to ensure that testing is consistent across all nations (Fleischman et al., 2010).
62 until age 16, or year 11 in their school system (New Zealand Ministry of Education, 2013). In
the Republic of Korea and Japan, students attend secondary school until they are 15 years of age,
and then may choose to pursue high school (center for international education benchmarking,
2013). Finnish students attend compulsory schooling until age 16 and then may move on to “general upper secondary education” (Finnish National Board of Education, 2012).
from this information, it appears that all students would be included in pisa data from
these top-performing nations. The argument that US students have a disadvantage on the PISA because other nations do not test their lowest-performing students is invalid unless further research shows that some students are excluded from tested populations in these nations and other high-performing countries. At this time, current research does not support this notion. Thus, differences in tested student populations do not explain why US 15-year-old students
appear average against their international peers and fourth and eighth grade students appear
above average on an international stage.
Conclusions
After examining the TIMSS, PISA, NAEP, and ACT in-detail, the gap in science
achievement among us high school students and us elementary/middle school students
does not have a clear cause. The PISA and ACT allow us to conclude that US high school students struggle to apply scientific skills, while the TIMSS and NAEP show that US fourth and eighth grade students are capable of reciting and applying scientific content knowledge.
each assessment has its merits and can provide us with slightly different information, but this
makes drawing conclusions across tests very difficult. Accurate conclusions are also difficult to draw because of the time between tests. National and international science assessments do not take place annually (except for the ACT), and as instructional methods and content areas of emphasis continually change, progress in science education is difficult to assess. Politicians
and policy makers should be wary of simply stating that us students are underperforming in
science - each major test explored in this paper tells a very different story and provides unique
data that can provide a snapshot of what us students do and do not understand in science and
at what age.
in the future, we can look forward to potential changes in student performance due to the
implementation of the Next Generation Science Standards. Released in 2013, the Next Generation Science Standards were designed on a new framework that relies on student “performance expectations” to outline what students should know or be able to do. “Student performance expectations have to include a student’s ability to apply a practice to content knowledge. Performance expectations, thereby focus on understanding and application as opposed to memorization of facts devoid of context” (Achieve, Inc., 2013, p. 1). This model closely aligns
with the structure of naep and timss, and perhaps may boost student achievement to new
heights on these assessments in the future.
A promise of improved student performance is exciting, but it is also important to note
that the validity of standardized testing as an accurate measurement of educational progress
remains debated. Standardized tests can only provide a “snapshot” of educational achievement because they reflect the performance of a small sample of students on a given day. A student who tests while ill, anxious, or under stress could perform poorly one day, and perform well the next. Multiple-choice tests also promote guessing and may not reflect what a student actually knows, but their ability to make an educated guess. Beaton et al. (1999), on behalf of the International
institute for educational planning run by unesco, argue that international testing allows a country to scrutinize its own curriculum for gaps in content that should be covered and analyze
factors that produce successful schools. They warn, however, that “Recommendations for policy
changes in a country need to take account of not only the results of the international analyses,
63 some merit, research suggests that a wide variety of factors can be associated with student
achievement. The methods and techniques that improve scores in one nation may not improve scores in another (Drent, Meelissen, & van der Kleij, 2013).
science standardized tests, in particular, have also come under scrutiny due to the
amount of reading required on most standardized science tests. As most standardized tests are timed, students must have the skills to pick out relevant and irrelevant information in text, learn new vocabulary terms in-context, and use headings and variations in font to quickly pick out information that is useful to answering questions at-hand. A number of studies have
shown that reading skills are tied to performance on standardized science tests (dempster &
Reddy, 2007; O’Reilly & McNamara, 2007; Visone, 2010). In the study conducted by O’Reilly
and mcnamara, high school students with higher reading abilities and lower science content knowledge actually outperformed students with a deeper understanding of content knowledge
and lower reading levels. In the future, the amount of reading required on a given assessment
needs to be carefully analyzed in order to accurately assess science knowledge, particularly for
the sake of students who are English language learners (ELLs) or struggling readers.
Even with their flaws, standardized tests remain the most cost-effective way to measure student achievement. Standardized tests have become a part of the world’s educational landscape,
and if designed effectively, tests can provide us with a wealth of valuable information about
student understandings of science. Because of their shortcomings, however, educational policies should never be based on standardized test performance alone.
future data from standardized test scores will become easier to analyze if testing
frameworks remain consistent for an extended period of time. Researchers are also currently exploring the relationships between the TIMSS, NAEP, and PISA, and the results of this research will help us to better understand overlapping tested content. This is particularly important for TIMSS and PISA data. If few commonalities exist between these assessments, student growth from middle to high school will be difficult to track. In summary, long-term data
available in the coming years, coupled with stronger understandings of assessed content, should allow researchers to develop more detailed understandings of what our students do and do not
understand in science. Hopefully, we can look forward to a future of more effective science testing. If we expect our students to engage meaningfully with these tests, and expect our
teachers to dedicate instructional time to test preparation, the least the testing community can do
is ensure that testing data is useful and helpful to those engaged in the education community.
References
About state NAEP. (2012, December 3). U.S. Department of Education, National Center for Education Statistics. Retrieved from http://nces.ed.gov/nationsreportcard/about/state.aspx
Achieve, Inc. (2013, April). Appendix A – Conceptual shifts in the Next Generation Science Standards.
Retrieved from http://www.nextgenscience.org/next-generation-science-standards.
ACT, Inc. (2007). The ACT technical manual. Retrieved from http://www.act.org/aap/pdf/ACT_ Technical_Manual.pdf
ACT, Inc. (2012). The condition of college and career readiness: 2012 [PDF Version]. Retrieved from http://media.act.org/documents/CCCR12-NationalReadinessRpt.pdf.
ACT, Inc. (2013). ACT national and state scores. Retrieved from http://www.act.org/newsroom/data/ ACT, Inc. (2014). ACT profile report – National, Graduating Class 2014. retrieved from http://www.act.
org/newsroom/data/2014/pdf/profile/National2014.pdf.
Baldi, S., Jin, Y., Skemer, M., Green, P. J., & Herget, D. (2007). Highlights from PISA 2006: Performance of U.S. 15-year-old students in science and mathematics literacy in an international context
(NCES Publication No. 2008–016). U.S. Department of Education. National Center for Education Statistics. Retrieved from http://nces.ed.gov/pubs2008/2008016.pdf.
Beaton, A. E., Postlethwaite, T. N., Ross, K. N., Spearritt, D., & Wolf, R. M. (1999, September).
64 Center on International Education Benchmarking, National Center on Education and the Economy (2013). Top performing countries. Retrieved from http://www.ncee.org/programs-affiliates/center-on- international-education-benchmarking/top-performing-countries/http://www.ncee.org/programs-affiliates/center-on-international-education-benchmarking/top-performing-countries/.
Dempster, E. R., & Reddy, V. (2007, November). Item readability and science achievement in TIMSS 2003 in South Africa. Science Education, 91 (6), 906-925. doi: 10.1002/sce.20225.
Distribution of science questions: 2011. (2012, April 5). U.S. Department of Education, National Center for Education Statistics. Retrieved from http://nces.ed.gov/nationsreportcard/science/distributequest. aspx.
Drent, M., Meelissen, M. R. M., & van der Kleij, F. M. (2013). The contribution of TIMSS to the link between school and classroom factors and student achievement. Journal of Curriculum Studies,
45 (2). doi: 10.1080/00220272.2012.727872.
Fiala, R. (2007). Educational ideology and the school curriculum. In Benavot, A. & Braslavsky, C. (Eds.),
School knowledge in comparative and historical perspective (pp. 15-34). doi: 10.1007/978-1-4020-5736-6.
Fleischman, H. L., Hopstock, P. J., Pelczar, M. P., & Shelley, B. E. (2010). Highlights from PISA 2009: Performance of U.S. 15-year-old students in reading, mathematics, and science literacy in an international context (NCES Publication No. 2011-004). U.S. Department of Education, National Center for Educational Statistics. Retrieved from http://nces.ed.gov/pubsearch/pubsinfo. asp?pubid=2011004.
Gonzales, P., Williams, T., Jocelyn, L., Roey, S., Kastberg, D., & Brenwald, S. (2008). Highlights from TIMSS 2007: Mathematics and science achievement of U.S. fourth- and eighth-grade students in an international context (NCES Publication No. 2009-001 Revised) U.S. Department of Education, National Center for Education Statistics. Retrieved from http://nces.ed.gov/pubs2009/2009001. pdf.
Important aspects of No Child Left Behind relevant to NAEP. (2005, August 10). U.S. Department of Education, National Center for Education Statistics. Retrieved from http://nces.ed.gov/ nationsreportcard/nclb.aspx.
Kamens, D. H., & McNeely, C. L. (2010, February). Globalization and the growth of international educational testing and national assessment. Comparative Education Review, 54 (1). Retrieved from http://www.jstor.org/stable/10.1086/648471http://www.jstor.org/stable/10.1086/648471. Kelly, D., Xie, H., Nord, C. W., Jenkins, F., Chan, J. Y., & Kastberg, D. (2013). Performance of U.S.
15-year-old students in mathematics, science, and reading literacy in an international context: First look at PISA 2012 (NCES Publication No. 2014-024). U.S Department of Education, National Center for Education Statistics. Retrieved from http://nces.ed.gov/pubs2014/2014024rev.pdf. Lemke, M., Calsyn, C., Lippman, L., Jocelyn, L., Kastberg, D., Liu, Y. Y., Roey, S., Williams, T., Kruger, T.,
& Bairu, G. (2001). Outcomes of learning: results from the 2000 program for international student assessment of 15-year-olds in reading, mathematics, and science literacy (NCES Publication No. 2002–115). U.S. Department of Education, National Center for Education Statistics. retrieved from http://nces.ed.gov/pubs2002/2002115.pdf.
Lemke, M., Sen, A., Pahlke, E., Partelow, L., Miller, D., Williams, T., Kastberg, D., & Jocelyn, L. (2004).
International outcomes of learning in mathematics literacy and problem solving: PISA 2003 results from the U.S. perspective (NCES Publication No. 2005-003). U.S. Department of Education, National Center for Education Statistics. Retrieved from http://nces.ed.gov/pubs2005/2005003. pdf.
Martin, M. O., Mullis, I. V. S., Foy, P., & Stanco, G. M. (2012). TIMSS 2011 international results in science. International Association for the Evaluation of Educational Achievement (IEA). Retrieved from http://timssandpirls.bc.edu/timss2011/international-results-science.html.
New Zealand Ministry of Education. (2013, June). NZ education system overview. retrieved http://www.minedu.govt.nz/NZEducation/EducationPolicies/InternationalEducation/ forinternationalStudentsAndParents/NZEdOverview/School_Education.aspx.
OECD. (2012). PISA 2009 Technical Report. PISA, OECD Publishing. Retrieved from http://www.oecd. org/pisa/pisaproducts/pisa2009/50036771.pdf.
OECD: About the OECD. (2013). Organization for Economic Co-operation and Development. Retrieved from http://www.oecd.org/about/.
OECD programme for international student assessment (PISA). (2013). Organization for Economic Co-operation and Development. Retrieved from http://www.oecd.org/pisa/.
65 Programme for International Student Assessment, Organization for Economic Co-operation and
Development. (2009). PISA 2009 assessment framework: Key competencies in reading, mathematics and science. Retrieved from http://www.oecd.org/pisa/pisaproducts/ pisa2009assessmentframework-keycompetenciesinreadingmathematicsandscience.htm.
Provasnik, S., Kastberg, D., Ferraro, D., Lemanski, N., Roey, S., & Jenkins, R. (2012). Highlights from TIMSS 2011: Mathematics and science achievement of U.S. fourth- and eighth-grade students in an international context (NCES Publication No. 2013-009). U.S. Department of Education, National Center for Education Statistics. Retrieved from http://nces.ed.gov/pubs2013/2013009rev.pdf. Timeline for National Assessment of Educational Progress (NAEP) Assessments from 1969 to 2017.
(2012, September 5). U.S. Department of Education, National Center for Education Statistics. retrieved from http://nces.ed.gov/nationsreportcard/about/assessmentsched.aspx.
U.S. Department of Education, National Center for Education Statistics. (2011). The nation’s report card: Science 2009 (NCES Publication No. 2011–451). Retrieved from http://nces.ed.gov/ nationsreportcard/pdf/main2009/2011451.pdf.
U.S. Department of Education, National Center for Education Statistics. (2012). The nation’s report card: Science 2011 (NCES Publication No. 2012-465). Retrieved from http://nces.ed.gov/ nationsreportcard/pdf/main2011/2012465.pdf.
Visone, J. D. (2010). Science or reading: What is being measured by standardized tests? American Secondary Education, 39 (1), 95-112.
Wilson, J. K. (2012). Predictors of college readiness: An analysis of the student readiness inventory
(Unpublished doctoral dissertation). University of North Texas, Texas.
Advised by Rita Makarskaitė-Petkevičienė, Lithuanian University of Educational Sciences, Lithuania
received: February 26, 2015 accepted: April 22, 2015
Susan Poland M.Ed., Doctoral Student, George Mason University, 4400 University Drive, MS4D1, Fairfax, VA 22036, USA.
E-mail: [email protected] Website: http://firstauthor.com
Linda Plevyak PhD, Associate Professor, University of Cincinnati, 511F Teachers College, Cincinnati, OH 45220, USA.