toward banning alcohol sales on campus among European university students. Public Health, 123, 122-129.
Swallen, K. C., Reither, E. N., Haas, S. A., & Meier, A. M. (2005). Overweight, obesity, and health related quality of life among adolescents: The national longitudinal study of adolescent health. Pediat-rics, 115, 340-347.
Trost, S. G., & Loprinzi, P. D. (2008). Exercise-promoting healthy lifestyles in children and adolescents. Journal of Clinical Lipidology, 2, 162-168.
Twenge, J. M., Gentile, B., DeWall, C. N., Ma, D., Lacefield, K., & Schurtz, D. R. (2010). Birth cohort in-creases in psyhopathology among young Americans, 1938-2007: a cross-temporal meta-analysis of the MMPI. Clinical Psychology Review, 30, 145-154.
Umiastowska, D. (2007). Change of model of physical education at universities in the light of researches on participation in physical education of students from Szczecin. Szczecin: University of Szczecin Press.
Varela, A., & Pritchard, M. E. (2011). Peer in� uence: Use of Alcohol, Tobacco, and Prescription Medica-Peer in�uence: Use of Alcohol, Tobacco, and Prescription Medica-tions. Journal of American College Health, 59 (8), 751-756.
Wechsler, H., & Nelson, T. (2008). What We Have Learned From the Harvard School of Public Health College Alcohol Study: Focusing Attention on College Student alcohol Consumption and Envi-ronmental Conditions that Promote It. Journal of Studies on Alcohol and Drugs, 69 (4), 481-490. Zatoński, W. (1996). Stan zdrowia Polaków. In W. Zatoński, B Hulanicka, & J. Tuczyński (Eds.), Stan
Zdrowia Polaków (pp. 7 – 27). Wrocław: ZA PAN.
Zieliński, R., & Zieliński, W. (2001). Tablice statystyczne. Warszawa: Fundacja Rozwój SGGW Press.
Advised by Jūratė Armonienė, Vilnius University, Lithuania
Received: May 30, 2013 Accepted: June 07, 2013
Robert Podstawski PhD., Assisting Professor, Department of Physical Education and Sport, University
of Warmia & Mazury in Olsztyn, Prawocheńskiego 7, 10-720 Olsztyn, Poland. E-mail: [email protected]
Elżbieta Wesołowska Professor, Social Science Department, University of Warmia & Mazury in Olsztyn,
Prawocheńskiego 13, 10-720 Olsztyn, Poland. E-mail: [email protected]
Renata Gizińska Teaching Assistant, Faculty of Technical Sciences, Chair of Machines and Sepa -ration Processes, University of Warmia & Mazury in Olsztyn, Oczapowskiego 11, 10-720 Olsztyn, Poland.
E-mail: [email protected]
Andrzej Sołoma Assisting Professor, Faculty of Economics, Chair of Finance and Banking, University of Warmia & Mazury in Olsztyn, Oczapowskiego 4, 10-719 Olsztyn, Poland. E-mail: [email protected]
StYleS of thINkINg IN relatIoN to
BraIN hemISphere DomINaNce
Andrej Šafhalter Primary School Anice Černejeve Makole, Slovenia
e-mail: [email protected]
Srečko Glodež, Karin Bakračevič Vukman University of Maribor, Maribor, Slovenia e-mail: [email protected], [email protected]
Abstract
The progress of neuroscience and the understanding of children’s styles of thinking are opening up new teaching styles that take into account differences in individual cognitive perception. Students can be clas-sified into three distinctive perceptive types, according to the pronounced activity of one cerebral hemi -sphere in their thinking and information processing: left-hemi-sphere, right-hemi-sphere, and integrative type that does not exhibit a considerable dominance of one particular hemisphere.
The purpose of the research was to establish differences in the 3D modeling encouraged progression of spatial ability between the left-hemisphere, right-hemisphere and integrative types of students.
Computerized 3D modeling employed during technical extra-curricular activity in lower secondary school(grades 6 to 9) may affect the spatial ability of students, which according to other studies, appears to be predominantly connected with the right brain hemisphere. Research was conducted among a variety of lower secondary school students across Slovenia aged 11 – 15 years. Data on spatial ability and its development was collected using a hybrid spatial intelligence test conducted on two separate occasions, while assessment of the learning perception type of students – depending on hemispheric dominance – was obtained using a self-evaluation questionnaire. The 3D modeling of technical objects and objects drawn in orthographic or isometric projection was done with the software Trimble SketchUp.
Key words: cognitive development, 3D modeling, hemispheric dominance, spatial ability.
Introduction
The great progress in neuroscience and neuropedagogy in recent times and the subse-quent better knowledge of the human brain, particularly in the age of growing up and schooling, has led to possibilities of new and different methods of teaching. The way a child thinks can now be better understood and different methods can be used to achieve one’s goals. Further-more, the development of each individual is taken into consideration.
92 anticipated in advance. It is more about moving to and fro between different levels of thinking.
Persons using this style of thinking may be intolerant of other-minded people. As stated by En-twistle, “persons with an integrative learning style are more prone towards divergent thinking, which means that they are using broader conceptual categories and are more willing to accept the content and analytical connections between notions. They may also be more impulsive. Per-sons with a sequential learning style often employ more convergent thought processes, are more cautious, conservative, analytical, and often reject certain connections because they are relying on narrow categories.” (Marentič-Požarnik, Magajna and Peklaj, 1995, p. 171)
Whereas divergent thinking is characteristic of the right-hemispheric type, convergent thinking is mostly found in the left-hemispheric types. The division into right-hemispheric and left-hemispheric learning styles was already mentioned by Reynolds, Kaltsounis and Torrance (Reynolds, Kaltsounis and Torrance, 1979). Today, in addition to the two mentioned categories, there are also students of an integrative type, whose hemispheric dominance is not particularly expressed.
Persons with highly-developed spatial intelligence, which is merely one type of intel-ligence according to Gardner, have good spatial ability. The author of multiple intelintel-ligences Howard Gardner (Gardner, 2010) claims that intelligence tests measure only the linguistic and logical-mathematical intelligence. In addition to the above mentioned intelligences, Gardner defines a spatial, musical, bodily-kinesthetic, interpersonal and intrapersonal intelligence. What is important for spatial intelligence is the ability to correctly perceive the visual world, carry out transformations of initial perceptions and recreate aspects of visual experience. Spatial intel-ligence could also be called visual, as it is closely connected with the observation of the visual world. However, it does not depend solely on the visual world, for it can also develop in a blind person. In this type of intelligence it is very important how one perceives an object from another angle or what the object would look like turned upside down.
As described in the work of Barbara Meister Vitale (Meister Vitale, 2004), there are dif-ferent explanations as to the specialization of the brain hemispheres. According to one explana-tion, the brain hemispheres are said to develop symmetrically until the age of four. Specializa-tion is said to occur only after age four. Each side of the brain has its forte in different cognitive functions. Specialization is said to be concluded by age five. According to another explanation, hemispheric domination, lateralization and functional specialization are said to occur after birth during specific periods. Individual specialized functions are thus said to be activated whenever a child is exposed to specific stimuli from the environment. Lateralization is not obvious until the corpus callosum between the hemispheres is fully developed, which occurs between the ages five and six. Specialization and lateralization are said to be fully completed around age nine. The third theory claims that language functions develop at birth, whereas the specializa-tion of other funcspecializa-tions develops gradually and is concluded during puberty.
93
Thus Andreas Demetriou (Demetriou and Raftopoulos, 2004) expanded the imaginative-spatial perception of children at this age to the following stages:
11 – 12 years: capable of perceiving abstract notions of images and objects, •
13 – 14: show originality in imagining known and unknown images and objects, •
15 – 16: capable of mental manipulation in forming images of pictures and objects and •
shaping aesthetical criteria. Methodology of Research
General Research Characteristics
The purpose of the research was determining the in�uence of 3D modeling on differenc-es in the development of spatial ability of left-hemispheric, right-hemispheric and integrative types of students. It was conducted during the technical extra-curricular activity of 3D model-ing, which was carried out with the free computer tool Trimble Sketchup. With the mentioned software tool the students modeled objects on the basis of orthographic or isometric projection and various objects from their surroundings (furniture, buildings, vehicles, technical aids and the like). Sketchup enables rotating an object or displaying it from different viewing angles. The spatial ability of students was tested twice; before the start and after the implementation of the 3D modeling activity. The entire student sample was also tested for the style of learning and thinking according to the hemisphericity of the brain.
Sample of Research
The research was conducted between 2011 and 2013 in eight different lower secondary schools in Slovenia on a sample of 90 students, 62 males (68.9 %) and 28 females (31,1 %), aged 11 to 15, who belong to the formal operational stage by Piaget’s classification as regards their understanding of space and spatial relations. Since 3D modeling is not a part of the com-pulsory activity in the curricula and syllabi of Slovenian lower secondary schools, i.e. it is not being carried out as a compulsory subject, the sample was chosen on the basis of applications for the extra-curricular activity, which was being carried out at the schools participating in the research.
Instrument and Procedures
Two measuring instruments were used for the needs of this experiment, namely a self-as-sessment questionnaire “A Children Form of Your Style of Learning and Thinking”, form A for children, and a hybrid spatial ability test. The self-assessment questionnaire, intended for deter-mining the style of learning and thinking according to the hemisphericity of the brain, contained 36 sets of different statements about the manner in which one thinks about things and feelings. Each set contains three different answers of which a student chooses one. Each of these three statements is characteristic of a style of thinking, i.e. whether the left or right brain hemisphere is dominant. The third choice presents the manner for which the dominance of either of the hemispheres cannot be precisely defined; such individuals are called the integrative type.
two-94 dimensional medium. They mainly require rotating geometric shapes and objects, with four
choices given, of which only one is correct. The tested subject must determine which object or geometric shape is identical to a specific object or geometric shape. The hybrid test consisted of two sets. The first set, set A, contained tasks for determining the identicalness of two geometric shapes, of which one was rotated. In the second part, set B, students had to carry out mental spatial manipulation in order to successfully solve the task. These tasks were mostly about de-termining the suitability of an object with regard to its grid or about dede-termining what an object looks like when rotated.
Data Analysis
At the end of each test “A Children Form of Your Style of Learning and Thinking” points were collected according to the individual answers. The total of all points was 36; a deviation of left- or right-hemispheric answers shows a tendency of the dominance of one of the hemi-spheres when thinking about things and feelings.
The students were able to collect 16 points at the hybrid spatial ability test, both at the initial and final test. The part of the test which contained the rotation of geometric shapes had a total of 8 points; the same amount of points could be collected in the tasks of virtual three-dimensional mental manipulation.
The statistical data analysis was carried out with the SPSS program; the two tests used were the paired samples t-test and the analysis of variance test; descriptive methods were also applied.
Results of Research
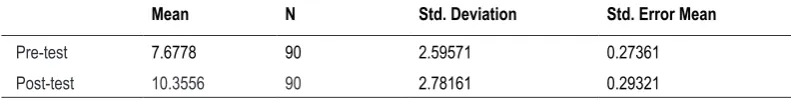
A test of the arithmetic means and characteristics of the differences for Pre-test and Post-test was conducted with a paired samples t-Post-test. The results are shown in Table 1, Table 2 and Table 3. The null hypothesis: H0: μPre = μpost was proposed.
Table 1. Differences in the Mean Values of Pre-test and Post-test.
Mean N Std. Deviation Std. Error Mean
Pre-test 7.6778 90 2.59571 0.27361
Post-test 10.3556 90 2.78161 0.29321
Table 2. Paired Samples Correlations.
N Correlation Sig.
Pre-test & Post-test 90 0.625 0.000
Table 3. Paired Samples Test.
Paired Differences t df Sig.
(2-tailed)
Mean Std. Devia
-tion Std. Error Mean 95% Confidence Interval of the Difference
Lower Upper
Pre-test
95
As Sig (2-tailed) amounts to less than 0.05, the null hypothesis is rejected; it is deduced that the differences between both tests were not created randomly but were the result of the in�uence of training.
On the basis of the self-assessment questionnaire, students were categorized into differ-ent learning styles, relating to the style of thinking. There were 17 (18.9 %) of studdiffer-ents with a left-hemispheric style, 44 (48.9 %) with an integrative style and 29 (32.2 %) with a right-hemispheric style.
Table 4. Share of Individual Learning Styles, Obtained by the Self-Assessment Questionnaire “A Children Form of Your Style of Learning and Think-ing”.
Frequency Percent Valid Percent Cumulative Percent
Left-hemispheric 17 18.9 18.9 18.9
Integrative 44 48.9 48.9 67.8
Right-hemispheric 29 32.2 32.2 100.0
Total 90 100.0 100.0
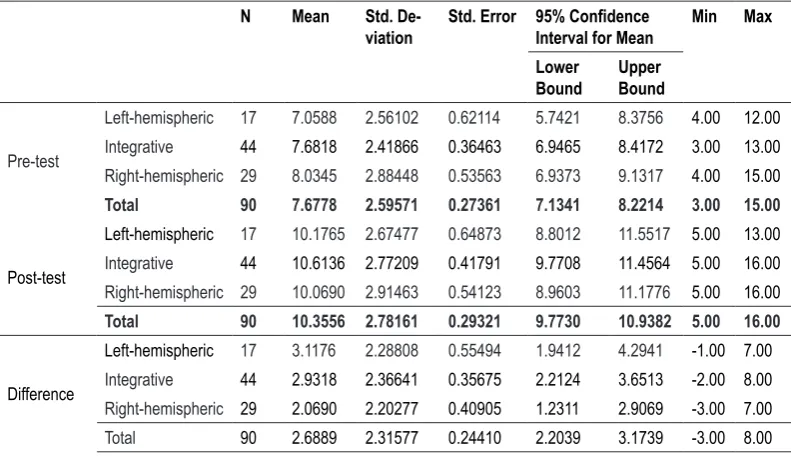
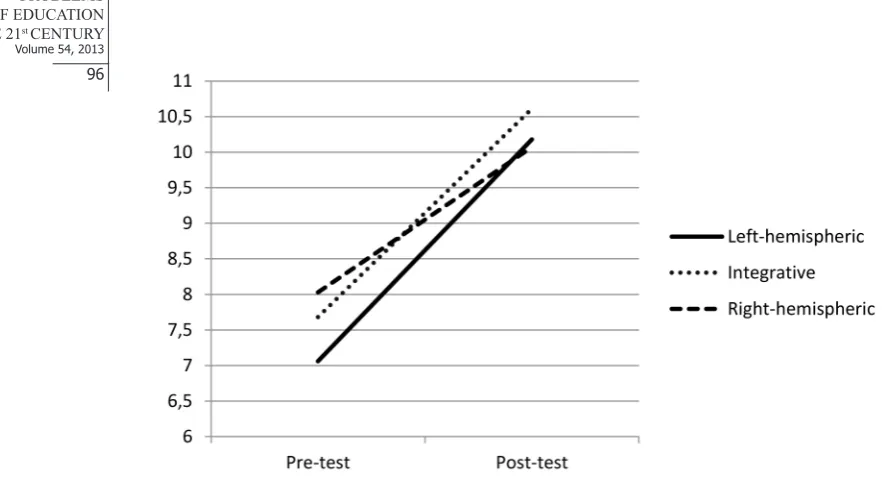
Table 5 shows the results obtained by the analysis of variance test. At the first spatial ability test the students with the left-hemispheric style obtained 7.06 points on average, those with the integrative style 7.68 and those with the right-hemispheric style 8.03 points. At the second test the students with the left-hemispheric style obtained 10.18 points on average, those with the integrative style 10.61 and the right-hemispheric ones 10.07 points. When comparing the progress in the spatial ability of students with individual learning styles, there are no sta-tistically significant differences among the left-hemispheric, integrative and right-hemispheric students (Table 5 and Table 6). However, when comparing merely the arithmetic means, the greatest progress (+3.12 points) can be seen in the left-hemispheric students; the integrative students made slightly less progress (+2.93 points) and the right-hemispheric students made the least progress (+2.07 points), which is shown in Figure 1.
Table 5. Results of the Analysis of Variance Test.
N Mean Std.
De-viation Std. Error 95% Confidence Interval for Mean Min Max Lower
Bound Upper Bound
Pre-test
Left-hemispheric 17 7.0588 2.56102 0.62114 5.7421 8.3756 4.00 12.00 Integrative 44 7.6818 2.41866 0.36463 6.9465 8.4172 3.00 13.00 Right-hemispheric 29 8.0345 2.88448 0.53563 6.9373 9.1317 4.00 15.00
Total 90 7.6778 2.59571 0.27361 7.1341 8.2214 3.00 15.00
Post-test
Left-hemispheric 17 10.1765 2.67477 0.64873 8.8012 11.5517 5.00 13.00 Integrative 44 10.6136 2.77209 0.41791 9.7708 11.4564 5.00 16.00 Right-hemispheric 29 10.0690 2.91463 0.54123 8.9603 11.1776 5.00 16.00
Total 90 10.3556 2.78161 0.29321 9.7730 10.9382 5.00 16.00
Difference
Left-hemispheric 17 3.1176 2.28808 0.55494 1.9412 4.2941 -1.00 7.00 Integrative 44 2.9318 2.36641 0.35675 2.2124 3.6513 -2.00 8.00 Right-hemispheric 29 2.0690 2.20277 0.40905 1.2311 2.9069 -3.00 7.00
96
Figure 1: Differences in the Means of Points Obtained Pre-test and Post-test.
Table 6 shows the testing of the validity of the test at the level of the population. The table clearly shows that in Pre-test and Post-test, as well as in the testing of the differences between both mentioned tests, the significance level is higher than 0.05. Therefore it is not pos-sible to generalize the results of the sample to the population with certainty.
Table 6. Testing of the Validity at the Level of the Population.
ANOVA
Sum of Squares df Mean Square F Sig.
Pre-test
Between Groups 10.203 2 5.102 0.753 0.474
Within Groups 589.452 87 6.775
Total 599.656 89
Post-test
Between Groups 5.858 2 2.929 0.373 0.690
Within Groups 682.764 87 7.848
Total 688.622 89
Difference
Between Groups 16.867 2 8.433 1.594 0.209
Within Groups 460.422 87 5.292
Total 477.289 89
Discussion
3D modeling presented an elective activity for the students as a technical extra-curricular activity. It can be seen that there were more male students than female ones, as technical activi-ties are generally more interesting to male students.
inte-97
grative type, i.e. as students with a learning style that does not prefer activities typical of either the left-hemispheric or right-hemispheric type of students. In the classification of students into individual categories with regard to the hemisphericity of the brain there were smaller or greater deviations of one category against the other two. A tendency towards an individual learning style was sought. In addition to the used self-assessment questionnaire there are other methods to recognizing a specific student type. Thus the work of Barbara Meister Vitale (Meister Vitale, 2004) describes the following methods of ascertaining hemispheric dominance: observing the child (e.g. dreaminess, use of verbal or nonverbal communication, impulsiveness,…), tests of dominance (dominance of the eye, position of the hand, muscle test, eye movements, body sym-metry,...) or the open questions method (e.g. a student imagines the singing of birds or the mur-mur of the sea and then points to the part of his/her head where these sounds are being heard).
Other research (Martin-Dorta, Saorin, Contero, 2008) has shown that 3D modeling has a positive impact on spatial ability. Spatial ability may also be in�uenced by the perceptual style of the student with regard to the receiving of information (visual, auditory, kinesthetic), or gender, which is in�uenced by the evolutionary aspect (Gardner 2010; Basham, 2006) or hormonal activity (Kolbl, Whishaw, 2003) or a combination of the genetic code and hormonal activity (Zaidi, 2010).
Conclusions
The results of the test show that the greatest difference can be found in the average of the points obtained among the left-hemispheric students, despite the fact that these students are bet-ter at verbal understanding and less at understanding spatial notions and relations. Such persons do, however, strive towards greater accuracy. Also possible is the explanation that this group of students had slightly worse spatial ability prior to the 3D modeling activity and that the activity itself enabled greater progress of this ability.
Contrary to expectations, students with a dominant right hemisphere demonstrated the least progress in spatial ability due to 3D modeling. This fact can be explained from the stand-point that these individuals had the best spatial ability prior to the start of the activity, but in comparison with the other two hemispheric types showed the smallest difference when compar-ing the results of Pre-test and Post-test.
References
Basham, K. L. (2006). The effects of 3-dimensional CADD modeling software on the development of spatial ability of ninth grade Technology Discovery students. Louisiana State University and Ag-ricultural & Mechanical College.
Demetriou, A., Raftopoulos, A. (2004). Cognitive Developmental Change. Cambridge: Cambridge Uni-versity Press.
Entwistle, N. (1981). Styles of Learning and Teaching. An integrated Outline of Educational Psychology for Students, Teachers and Lecturers. New York: John Wiley & Sons.
Gardner, H. (2010). Frames of Mind: The Theory of Multiple Intelligences. Ljubljana: Tangram. Kolb, B., Whishaw, I. Q. (2003). Fundamentals of Human Neuropsychology, Fifth Edition. New York:
Worth publishers.
Labinowicz, E. (2010). The Piaget Primer. Ljubljana: DZS.
Marentič Požarnik, B. (2000). Psychology of Learning and Instruction. Ljubljana: DZS.
Marentič Požarnik, B., Magajna, L., Peklaj, C. (1995). Challenge of Diversity. Nova Gorica: Educa. Martin-Dorta, N., Luis Saorin, J., Contero, M. (2008). Development of a Fast Remedial Course to
98 Meister Vitale, B. 2004. Unicorns Are Real: A Right-Brained Approach to Learning. Donji Vukojevac:
Ostvarenje.
Newton, P., Bristoll, H. Spatial Ability, Practice Test 1. Psychometric Success.
Reynolds, C. R., Kaltsounis, B., Torrance, E. P. (1979). Children’s Form of Your Style of Learning and Thinking: Preliminary Norms and Technical Data. The Gifted Child Quarterly, 23 (4), 757 – 767.
Zaidi, F. Z. 2010. Gender Differences in Human Brain: A Review. The Open Anatomy Journal, 2, 37 – 55.
Advised by Renata Bilbokaitė, University of Siauliai, Lithuania
Received: May 07, 2013 Accepted: June 13, 2013
Andrej Šafhalter Professor, Primary School Anice Černejeve Makole, Makole 24, 2321 Makole,
Slovenia.
E-mail: [email protected]
Website: http://www.os-makole.si
Srečko Glodež PhD., Professor, University of Maribor, Faculty of Natural Sciences and Mathematics, Department of Technical Education, Koroška 160, 2000 Maribor,
Slovenia.
E-mail: [email protected]
Website: http://tehnika.fnm.uni-mb.si
Karin Bakračevič Vukman PhD., Professor, Department of Psychology, Faculty of Arts, University of