182
Actuating Sensor For Determining The
Direction Of Arrival Using Maximal RSSI
Munesh Singh, Pabitra Mohan Khilar
Abstract: In this paper, we proposed an actuating device that can identify the direction of arriving (DOA) radio signal using its maximum receive signal strength (RSSI) that is suitable for localization as well as localization aided fundamental network services, such as network routing, topology control, coverage ,boundary detection and clustering. The device determine the direction of arrival by identifying the maximal received signal strength indicator (RSSI) measurement based on MRF24J40MA ZigBee embedded monopole antenna radiating characteristics. Localization from distance estimation alone is a challenging problem, but helpful if we know the relative angular position measurements between pairs of nodes. AOA measurements using directional antenna or phased array antenna are unsuitable for wireless sensor networks due to cost, size, complexity and energy demanding limitation. The device and the algorithm we proposed is compact and simple enough to be suitable for deployment in WSNs. Our prototype scheme is based on low cost ,8 bit Atmega micro-controller embedded with Microchip ZigBee MRF24J40MA shield and rotational support provided by servo motor. Our experimental results verify the optimality of smart sensor for estimating the DOA with less than an error of 6 to 7 degree in both indoor and outdoor environments including varying height of transmitting anchor.
Index Terms: Received signal-strength indication (RSSI), Direction of arrival (DOA), MRF24J40MA, Wireless sensor network (WSN).
————————————————————
1INTRODUCTION
Recent advances in micro-electro-mechanical systems technology, have enabled the development of small size, low-cost sensor nodes capable to communicate with each other over a short distance [1].Usually a sensor device consist sensing, processing, communication, and power supply subsystems. Researchers focused on various aspects of WSN, such as routing, topology control, covering, boundary detection, energy saving, security, and localization [1].Localization or position estimation has become a very interesting research topic over a recent years, due to their wide application need including military, environment, industrial, civilian etc. The key importance of WSNs comes from small size and low cost of the nodes, which make it possible to deploy a large number of them in a wide geographical area. For the effective use of the data from the sensors, the location of the sensor node must be known. Localization of node manually is expensive and sometime infeasible. Current approaches to self localization are based on measurements of pair wise distance between nodes, which can be obtained from time of the signal (acoustic or RF) arrival (ToA) or the received signal strength (RSSI)[2][3]. However distance measurement based self-localization is a challenging problem, especially when measurement between the node is corrupted by noise [4][5]. In order to calculate the TOA parameter, the nodes must have a common clock, or exchange the time synchronization information using certain protocols[6].
Most of the 802.15.4 radio module natively support RSSI circuitry, which enable to calculate the distance using its received signal power from each received packets. However RSSI based distance estimation are very unpredictable because there are several error sources such as multipath, shadowing. Instead of ToA and RSSI ranging technique, the AoA can be used for localization. The most common ways that sensor measure the AoA using antenna array, where a receiver determine the direction of a transmitter by analyzing the phase or the time difference between the signals arrivals at different microphone or at different antenna arrays. Most researchers use directional rotating antennas to measure AoA using the maximum power of the receiving signal. if, however, both distance and angle measurements are available between pair of nodes ,then the relative position between a pair of nodes can be obtain. Therefore, there is a need to equip wireless sensor nodes with the ability to measure the optimal relative angle between pairs of node, which makes the network localization problem more tractable[7][8]. This paper presents a simple method for DoA (direction of arrival) measurement, which utilize the monopole antenna radiating characteristic. The radiation pattern of the used monopole antenna is not ideally isotropic and has a maximum in a left direction of antenna axis. The idea presented in this paper two find the maximal RSSI zone by rotating this antenna. Finding the maximum was chosen because better selectivity is obtain due to the radiation pattern of antenna as well as selective direction of antenna arrangement. A minimal two antenna arrangement required in order to detect the direction of arrival from two opposite sides. The main advantage of the proposed approach is that a commercial radio module MRF24J40MA with already equipped microchip antenna can be used, instead of massively heavier directional reflector [9] or special antenna array [10], microphone arrays [11].Most radios that are applicable to WSNs have the capability of measuring the received signal strength indicator (RSSI).Proposed method also emphasis on of the antenna selective arrangement according to their maximum radiating direction. When the antenna more radiating beam aligned in such a way that the incoming signal is focused at the receiver antenna, a maximum RSSI is observed. Both sides attach antenna _____________________
Munesh Singh is currently pursuing his PhD from
National institute of technology (NIT) Rourkela, Computer science and engineering department, India PH-07735058901.
E-mail: [email protected]
Pabitra Mohan Khilar he is working as an assistant
professor at National institute of technology (NIT)
Rourkela,Computer science and engineering
183 finding the DOA by searching for the direction which the
highest RSSI observed. The rest of the paper is organized as follows: Section II background of proposed approach, Section III experimental hardware setup, Section IV experimental flow of algorithm, Section V result and discussions and Section VI conclusion.
2
B
ACKGROUNDA
NDP
ROPOSEDI
DEAWSN consist of a large variety of sensors distributed randomly into a sensing field. The objective of this paper is to propose a noble scheme for accurate measurement of AOA for localization of sensor nodes. The basic principle of proposed framework is to make use of the phenomenon of radio irregularity in WSNs using rotatable antennas. Rotatable antennas have been widely used in most of AoA-based localization methods. However, the antennas used in those schemes are directional antennas and antenna arrays. Proposed scheme taken the advantages of monopole antenna radiation pattern, as used almost all commercially available radio modules. In [12] AoA Estimation Using RSSI by arranging four Omni directional Rotatable Antennas are used. In [13] the commercial ZigBee module with omnidirectional antenna and additionally mounted actuating reflector used for AOA estimation. In the proposed method, two rotatable omnidirectional antennas are used and the direction of arrival estimation is carried out by sensing maximum RSSI. Radio irregularity is a common phenomenon which arises from multiple factors, such as variation in RF sending power and different path-losses depending on the direction of propagation. In previous studies, the radiation pattern of the sensor nodes are assumed to be spherical, which is an oversimplification of the radio propagation model in practical applications. This paper is distinguished from the previous ones for the initiative in bridging the gap between spherical radio models used by simulators and the physical reality of radio signals. Radio irregularity is caused by two categories of factors: devices and the propagation media. Device properties include the antenna type (directional or omnidirectional), the sending power, antenna gains (at both transmitter and receiver),receiver sensitivity, and the Signal-Noise Radio (SNR) threshold. Media properties include the media type, the background noise and other environmental factors. The radiation pattern can be found by measuring the strength of the field at every point on the surface of a sphere.
Fig.1 Simulated 3D radiation pattern of MRF24J40MA antenna[11]
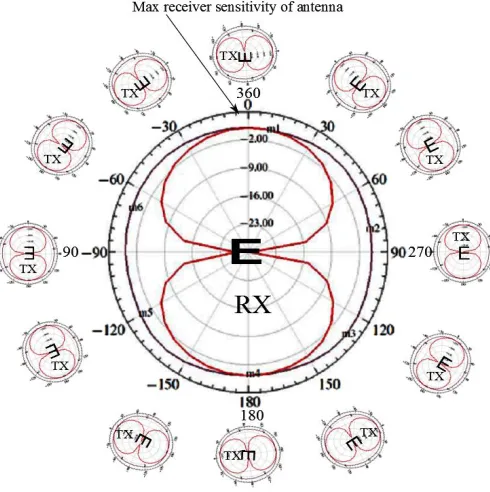
An antenna radiation pattern is the variation of the field intensity as an angular function around an antenna. Gain pattern is usually represented graphically for far-field condition in either the horizontal or vertical plane as a plot of signal strength vs azimuth or elevation. Azimuth and elevation together can specify any direction, azimuth is defined as the horizontal angle measured clockwise from north ranges from 0 to 360 degrees and, the elevation is the angle by which an object is lifted above the horizontal plane ranges from -90 to +90 degrees. The antenna gain is a measure of how much the input power concentrated in a particular direction since electromagnetic radiation is dipole radiation, which is not possible to build an antenna that radiates equally in all directions, although such a hypothetical isotropic antenna is used as a reference to calculate antenna gain. The radiating field from the transmitter antenna is characterized by the complex Poynting vector. Poynting’s theorem defines the relationship between the power density Pd of the E-field (electric field) and H-field (magnetic field) vectors [14]. Close to the antenna pointing vector I imaginary (reactive) while further away it is real (radiating) and (E, H) decay as 1/r (or is range).These two types of field, dominating in different region around the antenna as shown in Fig. 2. here we consider the far field measurement.
(1)
Fig. 2: Simulated 2D radiation pattern of H-field (violet) and E-field(red) [11].
184 placed 40 cm away from the sender (both on ground) and
received signal strength is measured from 0 to 360 degree with an increment of 30 (azimuthally angle φ) at different geographical direction by sampling 10 beacons received in each direction.
Fig. 3: Antenna under test measuring signal strength variation within E-planes.
We measure the variation of signal strength with change in angular direction of the sender with respect to the receiver as shown in Fig 3.The variation of the received signal strength as a function of the angular direction with respect to the sender, when the distance between the sender and receiver is 40 cm. This result show that the received signal strength varies continuously with the direction. In other words, incremental changes in direction result in incremental variation in the receiver signal strength .Table 1 shows that the received signal strength in each direction is relatively stable over time .However ,the signal strength received at the 0 and 360 degree are much higher than that the received in the other direction. The antenna used in our experiments is a part of the MRF24J40MA ZigBee module[11]. Radiation pattern of used monopole antenna consist of two zones of increasing intensity at 0 and 180 degree , as observed along the y axis on Fig 1 and Fig 2,but experiment verifies the antenna directionality toward the maximum along the azimuth angle of 0 as shown in Fig 3.The azimuth angle of rotated antenna where the RSSI is maximal, is assume to represents estimated AoA. The proposed method uses two antennas place on the two opposite direction, such a way that there maximum
receiver sensible direction facing towards the sensing field as shown in Fig.4.
TABLE 1
Signal Strength variation over time from 0 to 360 degree (azimuthal angle φ)
Azimuth
angle (φ) TX power (dBm)
Distance (cm)
Average RSSI 0 -20 40 221.5
30 -20 40 205
60 -20 40 181.1
90 -20 40 173.9
120 -20 40 168.8
150 -20 40 207.7
180 -20 40 200.2
210 -20 40 192.6
240 -20 40 155.8
270 -20 40 175.6
300 -20 40 184.4
330 -20 40 190.2
185
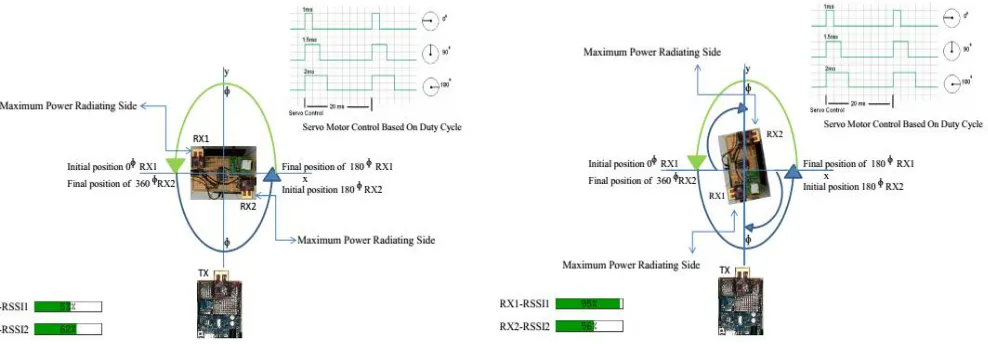
Fig. 4: Top view of measuring device, and the coordinate system for measuring AOA. (a) Initial setup with unknown position of transmitter (TX), progress bar shows the measured RSSI, (b) Movement scenario where true DOA is obtained. The maximum
RSSI value observed on antenna RX1 as shown on the progress bar graphs. of the corresponding antenna RX1-Rx2 at any time instant
is the angle between initial position and direction of receiving antenna according to maximum RSSI ,which is computed by multiplying the servo motors angular motion with the steps of (3 degree) resolution motor has moved until that time. During experiment , RSSI measurement are taken at every angular position. The estimated AoA is the angular position of the corresponding antenna(RX1-RX2), where the maximum signal strength is observed as shown in Fig 4(b). Due to random fluctuation in RSSI. RSSI is averaged over 1, 2, 4 or 8 bit times are used .The algorithm for processing RSSI measurements is simple enough that it can be run by on-board processor with limited memory and processing power. Micro-controller keeping only those angular position in memory at which the normalized RSSI measurement exceeded a threshold.
3
H
ARDWARES
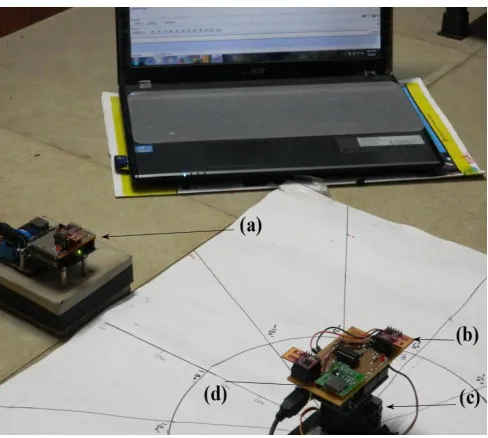
ETUPThe AOA measuring device, shown in Fig.5(a) consist of a two transceiver placed on plate, rotational actuator, processor board. The microchip based MRF24J40MA ZigBee with embedded monopole antenna ,operating at ISM band 2.405-2.48 GHz, which has on broad capability of measuring the received signal strength averaged over 1,2,4,and 8 bit times[11].Both board are based on 8 bit Atmega micro-controller with battery power source ,as shown in Fig.6.A 180 degree rotating servo motor is used to rotate the plate with transceivers. The two receivers is fixed to the plate such that the motor shaft can rotate 0 to 180 degree but other side, attach receiving transceiver cover 180 to 360 degree.
186
Fig. 6: Hardware setup (a) Transmitter,(b) Receiver with two Transceiver MRF24J40MA on Atmega Micro-controller board for AOA measurement ,(c) Servo Motor controlled by Microcontroller board,(d) Micro SD card for data logging. During the experiment ,the servo motor turns the plate using receiver with resolution of 3 .The transmitter continuously transmits the signal .For each position of the plate, Both the receiving transceiver measure RSSI and transferred to the micro-controller to select the maximum among the RX1-RX2 with their position to estimate AOA as shown in Fig 6(b).
4
E
XPERIMENTALF
LOW OFA
LGORITHMThe proposed method is effective only when there are no moving objects in the vicinity of the transceiver, therefore all the experiment were carried-out within obstacle and moving object free environment. At every angular position , a number of RSSI measurements taken .Let N_pos be the number of measurements taken at each angular position Pos(φ) ,where Pos,Pos1 is the angular positional variable recoded the movement of the servo motor with resolution of 3.RX1 angular positions Pos(φ)=0,3,...,180 degree and RX2, Pos1(φ)=180,3 ,...,360 degree. The experiment conducted within both indoor and outdoor environments for different distances between transceivers. The whole algorithm for estimating AOA is presented in Fig 7.
4.1SYSTEM MODEL
The algorithm used to process the RSSI measurement to estimate the AOA is described as follows.
Step 1: The transmitter (TX) in Fig 6(a) continuously transmitted a signal for rapid RSSI data collection at the receiver until TX interval gets expired.
Step 2: Receiver in Fig 6(b) collect the incoming packets with their RSSI on both RX1 and RX2 at each angular rotation until position variable Pos(φ) get equal to 180(0,3,....180).
Step 3: Angular position variable Pos(φ) ,Pos1(φ)
corresponding to RX1 (RSSI1),RX2 (RSSI2) record the angular rotation of servo motor incremented until Pos
=0,3,...,180 and Pos1=180,3,...,360.
Step 4: Calculate the one max from each recorded RSSI corresponding to angular position Pos(φ) ,Pos1(φ) among both the RX1 (RSSI1),RX2 (RSSI2),during the period of angular rotation - .Calculated final Max RSSI with their corresponding Pos, which set the Loc variable (Loc=Pos, Loc=Pos1) that instruct the servo to set their final position according to max RSSI receiving direction after completing the Pos=180
Step 5: If Loc variable contain the angular position Loc<=180 that correspond to RX1(RSSI1) instruct the servo motor to set their final position Loc. On the other hand Loc>180 that correspond to RX2(RSSI2) instruct the motor to set their final position Loc-180.
Fig. 7: Algorithm for Angle of Arrival Measurement.
5
R
ESULTA
NDD
ISCUSSION187 distance between the transceiver pair. Each test consisted
of single 180 revolution. The proposed scheme for
directional of arrival estimation is optimal then estimating scheme of AOA measurement .The exciting scheme emphasis on the specific alignment of the transmitter
towards AOA measuring device to measure the maximum or minimum RSSI .The goal of the proposed algorithm is to estimate the AOA without considering any specific direction using maximum arriving signal strength (RSS).
5.1PRELIMINARY MEASUREMENTS
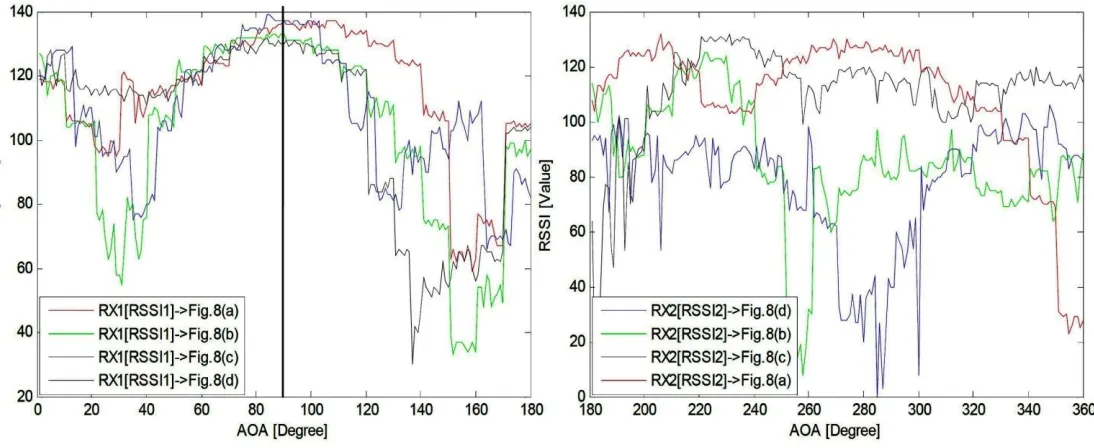
The first preliminary measurement were taken within an indoor environment without obstacles between the transceiver (LOS) over a distance of 1 m, at the power of 0dBm without considering the specific direction of the transmitter. The true angle between the initial position of receiver RX1 and the transmitter was set at 90 ,as shown in Fig 4(a).The RSSI of the corresponding receiving antenna archived a maximum RSSI practically the same results see in Fig.9 (a),(b) with an angle error of 4 to 5 degree. A search was made for the appearance of the maximum RSSI during AOA measurement. The servo motor initially made complete rotation of 0,3,...,180 with RX1 antenna, during the course of rotation other side antenna Rx2 also rotate (φ)= 180,3,...,360 to find the first appearance of Maximum RSSI on the corresponding antenna. The position of the corresponding antenna set after the complete rotation of ,when the maximum sensitive direction of receiving antenna aligned with the transmitting antenna. Experiments were also conducted with different rotation of transmitter within the azimuth
plane as depicted in Fig 8(a,b,c,d),and obtained the servo motor of 180 ,where maximum of RSSI appears.
Fig. 8: Different direction of Transmitter to see Optimality of detection.
5.2INDOOR EXPERIMENT
The indoor experiment were conducted in 6.4 m-by-7.6 m room at different distance from the AOA measuring device without including any obstruction between transmitter and receiver. At each varying distances three test were repeated to calculate the mean AOA, compared with next time estimated angle to see the possibility of angle deviation. The transceiver
Fig. 9: Different alignment of transmitter with respect to AOA measuring device.(a) Initial setup with know position of transmitter(TX) 90 azimuth, a true azimuth angle is estimated corresponding to RX1 antenna measured RSSI2,at each angular
188 were placed at 1m apart, transmitter location fixed at 90 as
shown in Fig10. Estimated AOA error is quit less than 4 to 6 degree.
5.3OUTDOOR EXPERIMENT
The outdoor experiment is conducted on the tarries of 8.6m by-10 m without considering any obstacle in between the transmitter and receiver. The true AOA was set at 90 .The same algorithm for AOA measurement can be used at different distances, because distance has little influence on the shapes of RSSI curve. Fig 11 shows the measured AOA at varying distance of transmitter with an angle error of about to be 4 to 5.
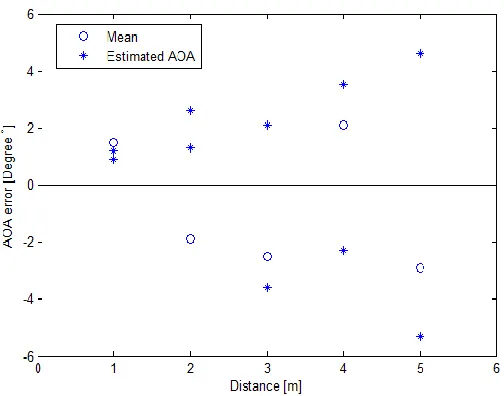
Fig. 10: AOA error estimation with varying distances in indoor environment small circle represent the mean AOA
of three trial and star represent the estimated AOA.
Fig. 11: AOA error estimation with varying distances in outdoor environment small circle represent the mean AOA
of three trials and star represent the estimated AOA.
5.4VARYING ALTITUDE
Varying Height test is conducted in indoor environment by placing transmitter at a distance of 1m from the actuating
receiver. Tests were repeated each time by varying the height of the transmitter placing on non-conductive box. Estimated test result shows the optimality of our actuating sensor detection capability of AOA with an error of 7 to 8.
Fig. 12: AOA error estimation with varying height of TX.
6
C
ONCLUSIONThese results shows that it is possible to get quite accurate AOA from RSSI measurement by using the antenna receiving sensibility with selective direction of placement .it is assumed that there is no obstacle in between the measuring devices, transmitter and receiver both lies on the same azimuth plane. Our prototype verifies the optimality to measure the AOA using both side attach MRF24J40MA transceiver with an absolute mean error of 5 to 6 in indoor environment and 4 to 5 in outdoor environment. This concludes that indoor measurements are less accurate then outdoor, which is the consequence of interference with many reflected signals. Distance versus error shows that the increased distances between transceivers had little influence on error.
R
EFERENCES[1] I. F. Akyildiz et al.,”Wireless Sensor Networks: A Survey,” Comp. Networks, vol. 38, no. 4, Mar. 2002, pp. 393-422.
[2] L. Girod and D. Estrin,”Robust range estimation using acoustic and multimodal sensing,” inProc. IEEE/RSJ Int. Conf. Intell. Robot. Syst.,Oct. 2001, pp. 1312-1320.
[3] S. Lanzisera, D. Lin, and K. Pister,”RF time of flight ranging for wireless sensor network localization,”inProc. Workshop on Intelligent Solutions in Embedded Systems (WISES), Jun. 2006, pp. 1-12.
189 [5] G. Mao, B. Fidan, and B. D. Anderson,”Wireless
sensor network localization techniques,”Comput. Networksvol. 51, no. 10, pp. 2529-2553,2007.[Online].Available:http://www.sciencedi rect.com/science/article/B6VRG-4MR88Y3-1/2/e1ec9202368c395d70268cd7e44b6484 [6] Niculescu, D., Nath, B. (2003). Ad hoc positioning
system (APS) using AoA. In Proc. of the IEEE computer and communications societies(pp.17-34).
[7] A. Basu, J. Gao, J. Mitchell, and G. Sabhnani,”Distributed localization by noisy distance and angle information,” inProc. 7th ACM Int. Symp. Mobile Ad Hoc Networking and Comput. (MobiHoc), May 2006, pp.262-273. [8] K. Chintalapudi, A. Dhariwal, R. Govindan, and G.
Sukhatme, Adhoc localization using ranging and sectoring,in Proc. IEEE INFOCOMM, Marl 2004 [9] Yinjie Chen, Zhongli Liu,XinwenFu, Benyuan Liu
and Wei
[10]Zhao.Theory Underlying Measurement of AOA with Rotating Directional Antenna. In Proceedings IEEE INFOCOM,pages 2490-2498,2013.
[11]Kucuk K, Kavak A, Yigit H, Ozdemir C. A novel localization technique for wireless sensor networks using adaptive antenna arrays. In: Proceedingsof IEEE radio and wireless symposium, Orlando; 2008, p. 483-6
[12]Microchip, MRF24J40MA Datasheet. (2010) [Online].
Available:http://ww1.microchip.com/downloads/en/ DeviceDoc/70329b.pdf
[13]Marko Malajner, Peter PlaninÅ ˛aic, and DuÅ ˛aan Gleich.Angle of Arrival Estimation Using RSSI and Omnidirectional Rotatable Antennas.In IEEE SENSORS JOURNAL,2012.
[14]B. N. Bryan and P. Barooah,”Estimating DoA from radio-frequency RSSI measurements using an actuated reflector,”IEEE Sensors J.,vol. 11, no. 2, pp. 413-417, Feb. 2011.
[15]Semtech,”Calculating Radiated Power and Field
Strength for Conducted Power
![Fig. 2: Simulated 2D radiation pattern of H-field (violet) and E-field(red) [11].](https://thumb-us.123doks.com/thumbv2/123dok_us/9080441.1443099/2.612.323.576.342.577/fig-simulated-radiation-pattern-field-violet-field-red.webp)