Open Access
Technical advance
Multimodal surface-based morphometry reveals diffuse cortical
atrophy in traumatic brain injury.
And U Turken*
1, Timothy J Herron
1, Xiaojian Kang
2, Larry E O'Connor
1,
Donna J Sorenson
1, Juliana V Baldo
1and David L Woods
1,2Address: 1Veterans Affairs Northern California Health Care System, Martinez, CA, USA and 2Department of Neurology, University of California, Davis, CA, USA
Email: And U Turken* - [email protected]; Timothy J Herron - [email protected]; Xiaojian Kang - [email protected]; Larry E O'Connor - larry.o''[email protected]; Donna J Sorenson - [email protected]; Juliana V Baldo - [email protected]; David L Woods - [email protected]
* Corresponding author
Abstract
Background: Patients with traumatic brain injury (TBI) often present with significant cognitive deficits without corresponding evidence of cortical damage on neuroradiological examinations. One explanation for this puzzling observation is that the diffuse cortical abnormalities that characterize TBI are difficult to detect with standard imaging procedures. Here we investigated a patient with severe TBI-related cognitive impairments whose scan was interpreted as normal by a board-certified radiologist in order to determine if quantitative neuroimaging could detect cortical abnormalities not evident with standard neuroimaging procedures.
Methods: Cortical abnormalities were quantified using multimodal surfaced-based morphometry (MSBM) that statistically combined information from high-resolution structural MRI and diffusion tensor imaging (DTI). Normal values of cortical anatomy and cortical and pericortical DTI properties were quantified in a population of 43 healthy control subjects. Corresponding measures from the patient were obtained in two independent imaging sessions. These data were quantified using both the average values for each lobe and the measurements from each point on the cortical surface. The results were statistically analyzed as z-scores from the mean with a p < 0.05 criterion, corrected for multiple comparisons. False positive rates were verified by comparing the data from each control subject with the data from the remaining control population using identical statistical procedures.
Results: The TBI patient showed significant regional abnormalities in cortical thickness, gray matter diffusivity and pericortical white matter integrity that replicated across imaging sessions. Consistent with the patient's impaired performance on neuropsychological tests of executive function, cortical abnormalities were most pronounced in the frontal lobes.
Conclusions: MSBM is a promising tool for detecting subtle cortical abnormalities with high sensitivity and selectivity. MSBM may be particularly useful in evaluating cortical structure in TBI and other neurological conditions that produce diffuse abnormalities in both cortical structure and tissue properties.
Published: 31 December 2009
BMC Medical Imaging 2009, 9:20 doi:10.1186/1471-2342-9-20
Received: 24 September 2008 Accepted: 31 December 2009
This article is available from: http://www.biomedcentral.com/1471-2342/9/20
© 2009 Turken et al; licensee BioMed Central Ltd.
Background
Many TBI patients fail to show detectible abnormalities in cortical structure on standard neuroradiological examina-tions despite significant cognitive impairments [1-8]. In contrast, neuroimaging studies of TBI patient groups find highly consistent evidence of cortical gray matter atrophy [9-12]. Cortical atrophy is also found consistently in post-mortem investigations of TBI patients [13,14]. Diffuse axonal injury (DAI) and atrophy at the gray matter/white matter junction have been shown in post-mortem studies and in animal models of TBI [14-17].
The detection of cortical abnormalities in individual patients is essential for the accurate diagnosis and treat-ment of TBI patients. However, the variability in normal cortical anatomy makes it difficult to assess subtle altera-tions of cortical tissue properties. The variaaltera-tions in cortical folding patterns [18] and interregional differences in cor-tical tissue properties and gray matter thickness [19] necessitate methods that precisely align homologous regions of the cortical surface in different subjects into a standard coordinate frame using surface-based morpho-metric (SBM) analysis techniques [18-22]. SBM has per-mitted the detection of regional reductions in cortical thickness and folding in a variety of neurodegenerative and neuropsychiatric conditions [8,23-28].
While the application of SBM has previously been limited to the analysis of high-resolution T1-weighted anatomical images, we introduce here multimodal SBM (MSBM) that combines information from DTI and T1 image datasets. DTI-derived measures of tissue anisotropy and diffusivity [29,30] can be quantified in the cortex and in the under-lying white matter [31-34]. Damage to cortical gray matter produces microstructural alterations in neuropil density, along with corresponding loss of projections in subjacent white matter fiber tracts. These changes are respectively associated with increased mean diffusivity (MD) and reduced fractional anisotropy (FA) [30,35,36]. While DTI has been used successfully to visualize deep white matter abnormalities in individual TBI patients [37-39], it has not yet been utilized to evaluate in individual patients the pericortical abnormalities that are suggested by animal models and post-mortem studies of TBI [13,16,40].
Multi-modal imaging can potentially enhance sensitivity to cortical abnormalities in individual cases. In theory, damage to neuronal cell bodies and axons should pro-duce co-localized changes in cortical thickness (seen with high-resolution T1-weighted imaging), and neuropil den-sity and fiber microarchitecture (seen with DTI). In addi-tion, because neuronal death causes anterograde loss of axons, and axonal damage produces retrograde degenera-tion of neuronal cell bodies and dendrites [41,42], peri-cortical damage should produce a characteristic
co-localized triad of abnormalities: reduced cortical thick-ness, increased cortical gray matter diffusivity, and reduced pericortical anisotropy. The detection of patho-logical tissue can therefore be enhanced with statistical procedures that combine evidence of co-localized abnor-malities from multiple metrics of tissue integrity [43].
Here, we demonstrate the use of MSBM to characterize cortical abnormalities in a patient who suffered a severe TBI. MSBM revealed reliable and consistent regional corti-cal abnormalities that were not evident on a standard MRI evaluation.
Methods
Case presentationA 33-year old right-handed male TBI patient with severe cognitive impairments was tested in 2008, 5 years post-injury. Following a motor vehicle accident in 2003, he remained in a coma for two weeks, with a Glasgow Coma Score (GCS) of 3 at hospital admission and a post-trau-matic amnesia (PTA) lasting three weeks. A left fronto-temporal epidural hematoma and parieto-fronto-temporal skull fractures were observed on an initial computed tomogra-phy (CT) scan, but had resolved two years later on a repeat CT scan. His clinical MRI scans acquired three years post-injury (T1 with and without contrast, T2 and FLAIR) were reported as completely normal on an initial neuroradio-logical assessment (see Figure 1). As part of this research project, a retrospective assessment of these scans was per-formed by one of the authors (L.O.) who noted subtle cor-tical atrophy, and a small left orbito-frontal encephalomalacia that had not been detected in the initial examination. The patient has not been able to return to work due to chronic cognitive and emotional impair-ments. At the time of the brain imaging and the neuropsy-chological assessments reported here, the patient was on anti-depressant and mood stabilizing medications.
Neuropsychological assessment
Logi-cal Memory subtest of the WMS-III (1st percentile). Mem-ory impairments were also observed on the California Verbal Learning Test (CVLT)-II [44]. The patient was at the 1st percentile for free recall on the five learning trials. He was also impaired on short-delay free recall (2nd percen-tile), long-delay free recall (7th percentile), and recogni-tion (13th percentile). However, on the long-delay forced-choice recognition portion of the CVLT-II, a measure of motivation/malingering, he was 100% accurate, thus rul-ing out poor motivation as a source of his impaired per-formance.
Importantly, the patient tested in the average range on a number of tests that do not rely on attention or memory. He performed well on the Wechsler Adult Intelligence Scale (WAIS)-III comprehension/knowledge subtest (63rd percentile) and on the DKEFS 20 Questions Test (42nd percentile), a test of reasoning and abstraction. He was in the normal range in his ability to copy the Rey-Osterreith Figure, a test of visuospatial perception, and on the Boston Naming Test, an index of language function-ing. Last, he performed in the average range on the motor speed trial of the DKEFS Trail Test (37th percentile).
Brain imaging
High-resolution T1-weighted structural and diffusion MRI scans were obtained using a 1.5T Phillips Eclipse scanner. To evaluate the reliability of the MSBM analysis, identical imaging sequences were acquired on two separate ses-sions at an interval of 6 days. Data from a third imaging
session were discarded due to excessive patient motion during the DTI scans. T1-weighted images were acquired with a Spoiled Gradient Recall (SPGR) sequence (TR/TE = 15/4.47 ms, FOV = 240 mm, 256 × 256 imaging matrix, flip angle = 35°, 0.94 × 1.3 × 0.94 mm3 voxels, 212 coro-nal slices). Two T1-weighted images were acquired and averaged together from each imaging session to improve signal-to-noise ratio (SNR). Two series of cardiac-gated diffusion images (single-shot spin echo EPI sequence, TR/ TE = 600-1000/115.6 ms, FOV = 240 mm, 80 × 80 imag-ing matrix, flip angle = 90°, 3 × 3 × 3 mm3 voxels, 48 axial slices, b = 1000 s/mm2) were acquired on each day of imaging using six non-collinear gradient directions.
Control group
Normative imaging data were acquired from 43 young healthy volunteers (30 males, 13 females, mean age = 27, range = 18-48, all right-handed by self report) from the local community (San Francisco Bay Area, CA, USA).
Informed consent
In accordance with the Declaration of Helsinki [45], writ-ten informed consent was obtained from the patient and all participants following protocols reviewed and approved by the VA Northern California Health Care Sys-tem Institutional Review Board.
Image post-processing
T1 images were corrected for magnetic field inhomogenei-ties and resampled to 1 × 1 × 1 mm3 resolution. In order Representative axial slices from clinical MRI scans of the TBI patient
Figure 1
to correct for movement artifacts and geometric distor-tions [46], diffusion MRI images were co-registered with anatomical scans and resampled at the same resolution using SPM5 http://www.fil.ion.ucl.ac.uk/spm. MATLAB http://www.mathworks.com programs were imple-mented for processing the diffusion imaging data. A 2D 3.75 FWHM Gaussian smoothing filter was applied to individual slices from B0 images to correct for in-plane Gibbs ringing artifacts. An edge-preserving weighted-median tensor smoothing filter [47] was applied to the diffusion-weighted images for noise removal. The two DTI series from each imaging session were averaged to improve SNR. The diffusion tensor [30] was computed using log linear least squares while correcting for negative eigenvalues [48]. FA and MD maps [30] were then derived from the diffusion tensor.
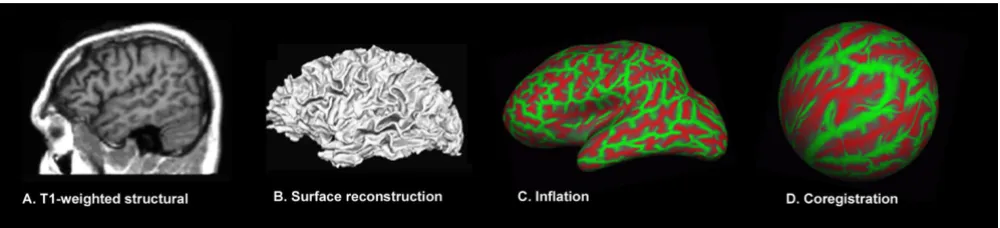
Surface-based morphometry
The cortical surface was reconstructed from high-resolu-tion T1 images using the fully automated analysis proto-col implemented in FreeSurfer 4.0 http:// surfer.nmr.mgh.harvard.edu. First, the cortical surface was automatically segmented from the anatomical images (Figure 2A-C). Gyral anatomy was aligned to a standard spherical template using surface convexity and curvature measures (Figure 2D) [20,49,50]. Identical procedures were used to analyze control data to permit statistical comparisons of homologous cortical regions between the patient and controls. The frontal, temporal, parietal and occipital cortices delineated by the surface parcellation provided by FreeSurfer [51] were used to analyze cortical tissue properties at the lobar level.
FA and MD maps were resampled in mid-gray matter and in pericortical white matter 2 mm below the boundary
between gray and white matter [34] (Figure 3). Cortical thickness [19] and DTI metrics were estimated at each point on a 1 mm2 grid. In order to the minimize variance due to minor intersubject disagreements in gyral and sul-cal anatomy, surface-based smoothing was implemented with a 2D 30 mm2 Gaussian kernel [52,53].
Control data
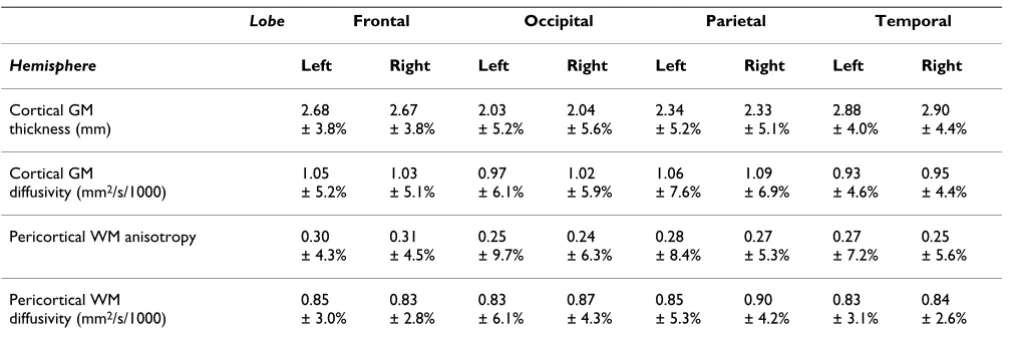
Surface maps of mean cortical thickness, cortical diffusiv-ity, pericortical white matter diffusivity and fractional ani-sotropy as well as their coefficients of variation (standard deviation/mean value) are shown for the control group in Figure 4. Average tissue properties of the different cortical lobes, together with their standard deviations, are shown in Table 1.
Statistical procedures
Cortical tissue metrics from the patient were compared with those from control subjects at each point on the cor-tical and pericorcor-tical surfaces using one-tailed significance tests for reduced cortical thickness, lower pericortical ani-sotropy, and increased cortical and pericortical diffusivity. A significance threshold of p < 0.05, corrected for multiple comparisons, was achieved by setting the point-wise z -score threshold to 1.5 and by computing a variable cluster extent threshold based on parameter smoothness esti-mates [53,54]. To improve sensitivity, corrections for age, brain volume and local curvature were applied to the cor-tical thickness measure of control subjects [19,55]. In order to ensure the normal distributions of z-scores, trans-formations were empirically derived from the database and were applied to the thickness, FA, and MD parameter distributions separately. Because of greater statistical power in averaging over large cortical areas, z-scores were used to analyze data on the lobar level.
SBM image processing steps: Surface reconstruction and alignment to standard template
Figure 2
Combined assessment of individual tests of each metric
The joint significance of the abnormalities on individual measures was assessed using a modified version of Fisher's combined probability test [56]. The original test uses the p-values (pi) from k independent single-sided tests sharing the same null hypothesis to calculate a joint test statistic:
. The overall p-value can be computed
from this test statistic using a χ2 distribution with 2 k degrees of freedom. With covarying measures (e.g.,
corti-cal thickness and gray matter diffusivity) correlations between measurements from the normal group must be used to appropriately adjust the degrees of freedom of the reference χ2 distribution [43,57]. The false-positive rate for the combined Fisher test was evaluated using leave-one-out permutation testing by comparing each control subject against the remaining control population using the same procedures as those used to analyze the patient data.
cF i i
k
p 2
1 2
= −
∑
= ln[ ]Quantification of tissue properties in the cerebral cortex and in pericortical white matter
Figure 3
Quantification of tissue properties in the cerebral cortex and in pericortical white matter. Two surfaces were defined from the T1-weighted anatomical images (left column): in mid-gray matter (red) and 2 mm below the gray-white matter boundary (blue). White matter fractional anisotropy (middle) was quantified 2-mm below the gray/white boundary and mean diffusivity (right) was quantified in both the cortical gray matter and the white matter surfaces. Parasagittal (left hemisphere) and axial (above the lateral ventricles) cross-sections from the TBI patient's first imaging session are shown. High intensity regions on the FA map correspond to major fiber bundles running parallel to the cortical surface. Cerebrospinal fluid sur-rounding the cortex appears bright on the MD map.
Table 1: Mean cortical tissue parameters in different lobes for the control group.
Lobe Frontal Occipital Parietal Temporal
Hemisphere Left Right Left Right Left Right Left Right
Cortical GM thickness (mm)
2.68 ± 3.8%
2.67 ± 3.8%
2.03 ± 5.2%
2.04 ± 5.6%
2.34 ± 5.2%
2.33 ± 5.1%
2.88 ± 4.0%
2.90 ± 4.4%
Cortical GM
diffusivity (mm2/s/1000)
1.05 ± 5.2%
1.03 ± 5.1%
0.97 ± 6.1%
1.02 ± 5.9%
1.06 ± 7.6%
1.09 ± 6.9%
0.93 ± 4.6%
0.95 ± 4.4%
Pericortical WM anisotropy 0.30 ± 4.3%
0.31 ± 4.5%
0.25 ± 9.7%
0.24 ± 6.3%
0.28 ± 8.4%
0.27 ± 5.3%
0.27 ± 7.2%
0.25 ± 5.6%
Pericortical WM diffusivity (mm2/s/1000)
0.85 ± 3.0%
0.83 ± 2.8%
0.83 ± 6.1%
0.87 ± 4.3%
0.85 ± 5.3%
0.90 ± 4.2%
0.83 ± 3.1%
0.84 ± 2.6%
A, B. Cortical gray matter and pericortical tissue properties quantified along the cortical mantle in control subjects
Figure 4
Assessment of cortical surface alignment
Registration errors can occur when brain images from patients who have suffered brain atrophy are compared with images acquired from healthy controls, reducing the precision of structural comparisons. We assessed how well the cortical surface anatomy of the TBI patient was aligned with the mean cortical surface for the control group by vis-ualizing major features of sulcal anatomy in relation to the atlas for the normal brain. Figure 5 shows the anatom-ical labels attached to selected gyri and sulci in the patient's brain by Freesurfer. Major gyral and sulcal struc-tures were accurately identified and located close to pop-ulation-average locations.
In order to assess alignment of surface anatomy and minor differences in sulcal structure at a finer scale (e.g. sulcal interruptions), we defined a curvature similarity metric at each location on the cortical surface. Surface cur-vature maps for each subject were compared with the mean curvature for the database, and the squared differ-ence of a subject's regional cortical surface curvature from the mean was divided by the standard deviation of the database curvature to obtain a z-score curvature-similarity metric.
Results
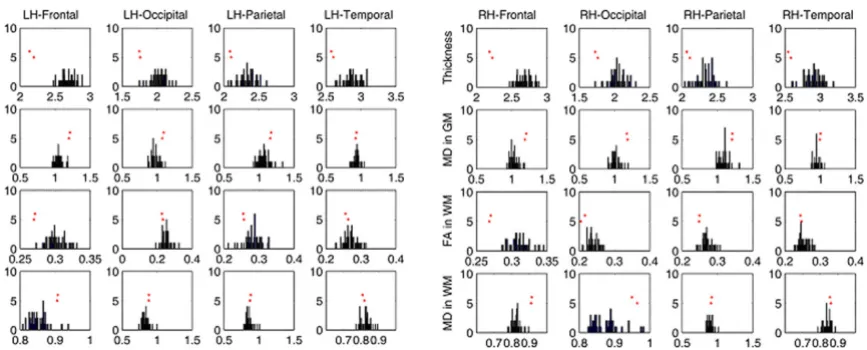
Lobar analysis revealed significant bilateral cortical thin-ning in the TBI patient's frontal, temporal and occipital lobes (see Table 2, Figure 6). The frontal lobes showed the largest mean decrease in cortical thickness (left = -20.4%, right = 18.3%, p < 0.001). These were accompanied by sig-nificant increases in gray matter diffusivity (left = +15.6%, right = +17.4%, p < 0.001) and reductions in white matter anisotropy (left = -10.0% and right = -12.8%, p < 0.05). The joint assessment of all four metrics using the Fisher combined probability test detected highly significant abnormalities in the frontal lobes bilaterally (p < 0.001) as well as the right occipital lobe (p < 0.01) on both imag-ing sessions (Table 2, final two rows).
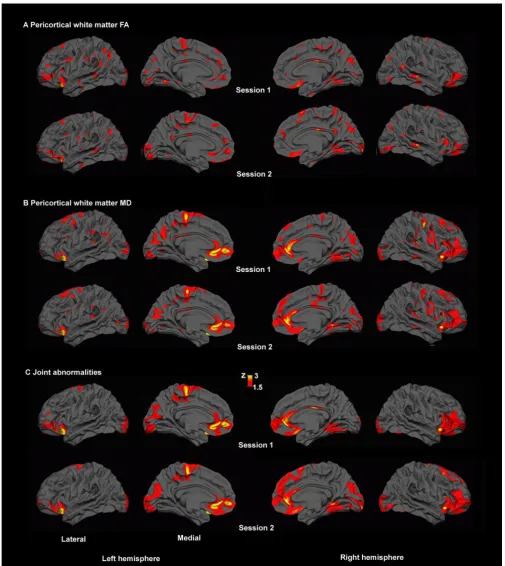
MSBM surface analysis revealed focal regions of abnor-mally thin cortex in the lateral and medial frontal cortex (see Figure 7A). There was also increased gray matter dif-fusivity in lateral frontal regions (Figure 7B). Analysis of pericortical white matter revealed broadly distributed regions of reduced anisotropy and increased diffusivity that replicated across two imaging sessions (Figure 8A, B).
Combined assessments of all four metrics (cortical thick-ness, gray matter diffusivity, pericortical white matter ani-sotropy and diffusivity) showed extensive abnormalities in the frontal lobes and in basal occipito-temporal regions bilaterally. More spatially restricted abnormalities were also found in the inferior temporal lobe of the right hem-isphere and the medial parietal regions and the posterior
cingulate gyrus of the left hemisphere (Figure 9). The regions showing abnormalities were almost identical on the two imaging sessions. They were spread over 29.1% and 27.5% of the total surface area of the left hemisphere in the two imaging sessions, and over 31.4% and 31.5% of the right hemisphere.
No such widespread abnormalities were detected in any of the control subjects. The leave-one-out procedure using Fisher's combined probability test found statistical abnor-malities in four of the 86 normal control hemispheres, resulting in an overall 4.7% false positive rate. Somewhat higher false-positive rates were seen for individual meas-ures: 12.8% for thickness and 8.1% for other measures. Among the control population, one control subject had bilateral abnormalities, and two others had abnormalities restricted to a single hemisphere. In these control subjects, the extent of the statistically significant joint abnormali-ties was 1.6%, 4.6%, 5.1%, and 6.6% of the total surface area in the four hemispheres that showed statistical abnormalities.
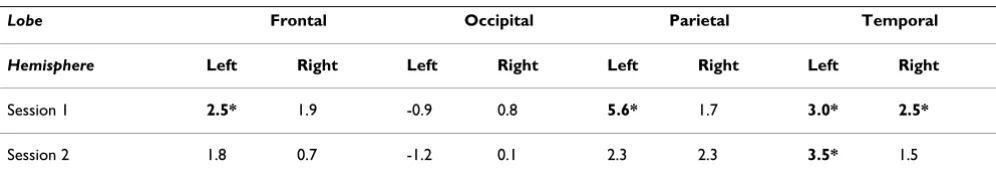
Assessment of the cortical surface curvature similarity between the patient and controls revealed marginally sig-nificant differences in fine cortical structure in the left frontal, left parietal and bilateral temporal lobes on the first scanning session. Significant differences were restricted to the left temporal lobe in the second session (Table 3). We therefore tested whether there was a system-atic relationship between surface curvature and the abnor-malities detected in the point-wise joint significance tests at each point on the cortical surface. Pearson correlation values for the first and second scanning sessions were 0.033 and 0.046, respectively, in the left hemisphere and were -0.020 and -0.059 in the right hemisphere. None of these effects reached statistical significance.
Discussion
cor-tex, the left medial parietal lobe and in the right inferior temporal lobe).
The control population showed predictably low false-pos-itive rates (4.7%). Moreover, the false-posfalse-pos-itive abnormal-ities detected in the control population were much less extensive than those observed in the patient. Because identical statistical procedures were used to evaluate each control subject and the patient, this indicates that the abnormalities observed in the patient were far outside the normal range of variability.
The effects observed in this patient are consistent with the diffuse cortical atrophy that is observed consistently in animal models of head trauma [16,17], and neuroimag-ing investigations of TBI patient groups [9,10]. Increased cortical diffusivity is consistent with neuropil density reductions seen in histological investigations of TBI [42]. Pericortical white matter abnormalities are consistent with the vulnerability of the gray-white matter junction to diffuse axonal injury (DAI) [13,16]. The frontal and ven-tral distribution of the abnormalities is consistent with
typical findings for TBI-related cortical damage [1,2,4,58,59].
The extensive frontal lobe abnormalities are consistent with the TBI patient's poor performance in neuropsycho-logical tests of executive function and attention. The dif-fuse lateral prefrontal cortex plays an important role in cognitive control [60], and brain lesions in this region produce deficits in high-level cognitive abilities [61]. The extent of the lateral prefrontal abnormalities (Figure 7), including the left dorsolateral frontal cortex which is crit-ical for cognitive control [62], can help explain the patient's severe and chronic cognitive impairments despite the absence of brain lesions evident in standard neuroradiological examination.
Diagnostic value of surface-based morphometry
The cortical abnormalities revealed by MSBM are difficult to detect on visual inspection of standard MRI slices for several reasons. First, the abnormalities are small in mag-nitude but widespread, spanning multiple image cross-sections. In addition, they are difficult to detect because the thickness of the cortical ribbon seen on cross sections Co-registration of the TBI patient's cortical surface anatomy with the Freesurfer atlas
Figure 5
Table 2: Lobar-level analysis of cortical tissue integrity.
Lobe Frontal Occipital Parietal Temporal
Hemisphere Left Right Left Right Left Right Left Right
Cortical GM Thickness
-20.4%
5.4***
-18.3%
4.7***
-14.1%
2.7*
-15.4%
2.7*
-10.7%
2.1
-11.3%
2.2
-10.5%
2.6*
-12.3%
2.8*
Cortical GM diffusivity
+15.6%
3.0*
+17.4%
3.4**
+13.1%
2.2
+15.9%
2.7*
+10.4%
1.3
+11.0%
1.6
+0.6%
0.1
+5.8%
1.3
Pericortical WM anisotropy
-10.0%
2.3
-12.8%
2.8*
-9.9%
1.0
-9.3%
1.5
-9.9%
1.2
-7.9%
1.5
-4.9%
0.7
-4.0%
0.7
Pericortical WM diffusivity
+6.5%
2.2
+10.6%
3.8**
+6.5%
1.1
+8.6%
2.0
+3.5%
0.7
+2.6%
0.6
-2.0%
-0.6
+1.8%
0.7
Joint abnormality (Fisher's z)
4.98*** 5.54*** 2.27 2.89* 1.63 1.94 1.34 2.20
Joint abnormality Replication
4.58*** 5.22*** 2.02 3.18* 1.45 1.74 1.04 1.94
Percentage difference in the TBI patient with respect to mean values for the control group and the corresponding z-scores (boldface) are shown for cortical thickness, cortical mean diffusivity, and fractional anisotropy and mean diffusivity of pericortical white matter (2 mm below the gray-white boundary). Results are from the first imaging session. Asterisks (*, **, ***) indicate z-scores significant at the p < 0.05, 0.005, 0.0005 levels (z > 2.5, 3.3, 3.9, respectively), Bonferroni corrected for multiple comparisons across the four lobes and the two hemispheres. The bottom two rows show joint z-scores of all tissue metrics using Fisher's combined test for imaging sessions 1 and session 2.
Histograms showing the lobar measurements from the patient in relation to the distributions for the control group
Figure 6
varies substantially because of the systematic gray matter thickness differences across cortical regions [19]. MSBM permits the automated, quantitative detection of abnor-malities across the cortical surface that are otherwise diffi-cult to detect on standard neuroradiological assessments.
Assessment of cortical and pericortical tissue properties using DTI
Diffusion tensor imaging has been used successfully to characterize deep white matter abnormalities in TBI. With the present approach, white matter integrity adjacent to cortex can also be assessed. DAI has a predilection for the gray-white matter junction [4] in both animal models [16,40] and post-mortem human investigations [13]. In the current study, lobar analysis revealed widespread
ani-sotropy reduction and diffusivity increase in frontal peri-cortical white matter. Point-wise analysis found multiple smaller patches of reduced anisotropy and increased dif-fusivity beneath the cortical mantle.
The architecture of white matter near the cortex is com-plex, with both short- and long-range fiber systems termi-nating in the same cortical zones [33,63]. Inspection of the FA map in Figure 3 reveals the large anisotropy varia-tions along the cortical sheet, partly reflecting the manner in which the cortical surface makes contact with the deep white matter tracts. DTI measurements are also less relia-ble in or near the cortex than in deep white matter [64]. The development of improved image post-processing and quantification procedures for quantifying DTI metrics Regional cortical gray matter abnormalities detected by SBM in the TBI patient
Figure 7
Pericortical white matter abnormalities
Figure 8
near the cortex [32-34,65] will further improve the assess-ment of pericortical white matter integrity.
Joint MSBM assessment of tissue integrity
Co-localized abnormalities evident with different tissue metrics were identified by the combined analysis of multi-modal data (e.g., the right frontal and right occipital lobe abnormalities in Table 1). As expected, TBI-related neu-ropathological processes produced co-localized abnor-malities, reflecting the causal link between the integrity of neuronal cell bodies, their dendrites, and their axons [41]. Subthreshold abnormalities that might be masked by high intersubject variability or measurement noise can be detected with higher sensitivity when assessed conjointly. For instance, the regionally-specific abnormalities in white matter anisotropy and diffusivity did not reach sig-nificance in isolation (Figure 8) but their joint assessment revealed significant white matter abnormalities consistent with DAI. Moreover, these abnormalities were typically
found in regions with significant cortical thinning. In con-trast, artifact-related abnormalities are unlikely to be aligned across imaging modalities. Thus, the Fisher com-bined probability test is a promising approach for reduc-ing the likelihood of detectreduc-ing artifactual differences while maximizing sensitivity [43,57].
Image co-registration
When comparing morphometric data from patients who suffered brain atrophy with a healthy control group, it is important to consider the possibility of co-registration errors due to global shape changes as well as alterations in fine-level texture of brain tissue. While smoothing serves to compensate for registration errors, there is a corre-sponding loss of spatial localization accuracy and the potential for partial-voluming due to averaging over dis-similar structures. These sources of error need to be care-fully assessed when interpreting the findings from individual patients.
Combined assessment of cortical abnormalities
Figure 9
Combined assessment of cortical abnormalities. Joint tests of significant cortical gray matter and pericortical white mat-ter abnormalities using Fisher's combined probability test revealed extensive abnormalities, concentrated mainly in the frontal lobes and basal occipito-temporal regions. The spatial distribution of the abnormalities replicated on the two different imaging sessions.
Table 3: Cortical surface curvature compared between the patient and the control group.
Lobe Frontal Occipital Parietal Temporal
Hemisphere Left Right Left Right Left Right Left Right
Session 1 2.5* 1.9 -0.9 0.8 5.6* 1.7 3.0* 2.5*
Session 2 1.8 0.7 -1.2 0.1 2.3 2.3 3.5* 1.5
In the present investigation, the TBI patient's brain anat-omy was judged to be normal on his initial radiological investigation, and his cortical anatomy aligned success-fully with normal brain templates. However, we found significant differences in fine-level cortical surface curva-ture measures in the patient and controls. This may have reflected changes in gyral morphology consequent to cor-tical tissue loss. However, the differences in curvature did not predict the regions showing significant tissue abnor-malities. This likely reflects a difference in spatial scale of the two measures. Curvature differences largely reflect sub-centimeter alterations in gyral morphology, while surface-based analyses using a 30 mm smoothing filter reflect differences on a coarser spatial scale [52,53]. Corti-cal thickness and DTI-derived measures were also aver-aged over the four lobes of the two hemispheres, and significant bilateral abnormalities were detected in the patient's frontal lobes. The lobar-level analysis does not rely on the precise alignment of fine sulcal structure, and provides a way to assess tissue abnormalities that is robust with respect to potential image-coregistration problems in patient populations.
The analysis of imaging data from patients with both focal lesions and possibly subtle and diffuse tissue alterations presents a technical challenge for automated morphomet-ric assessment methods. Image co-registration algorithms are liable to distortions due to the presence of such lesions [66]. While the effects of focal lesions on the performance of volume-based co-registration algorithms has been investigated [66-68], it will be important for future inves-tigations to assess how surface-based registration is affected by the presence of lesions and how possible dis-tortions can be addressed.
Generalizability of the MSBM approach
The sensitivity of MSBM in detecting abnormalities in other TBI patients remains to be determined. TBI patients constitute a heterogeneous population, with varying etiol-ogy and neuropatholetiol-ogy.
However, common patterns of cortical atrophy that are especially pronounced in frontal lobes have been reported consistently in imaging studies of TBI patient groups [9-12]. TBI is associated with significant reductions (up to 10%) in whole brain volume and total gray matter vol-ume [69-71], with greater TBI severity associated with more gray matter loss. This suggests that cortical thickness reductions ranging from 0.15 to 0.3 mm can be expected in moderate to severe TBI cases. Our normative data (Table 1) indicate that a 10% decrease can be detected at the lobar level with the present approach. Further improvements in sensitivity to co-localized cortical gray matter and pericortical white matter abnormalities are achieved with multi-modal integration.
TBI-related damage to long white matter tracts has also been well documented [72-74] and is associated with reductions in white matter fractional anisotropy of up to 20%, and increases in mean diffusivity of up to 15% [75,76]. The lobar-level analyses presented here are sensi-tive to abnormalities in tissue properties (e.g., 15% in fractional anisotropy and 10% in mean diffusivity) that would fall in the mid-range of the TBI-related anisotropy and diffusivity alterations reported in other structures.
The combined analysis increases sensitivity to borderline abnormalities in moderate and severe TBI cases that present a quandary for radiological diagnosis. The norma-tive data presented in Figure 4 and Table 1 indicate that the power to detect abnormalities is not uniform over the cortex in any of the imaged modalities. Further, the corti-cal regions with low coefficients of variation have differ-ent distributions for differdiffer-ent modalities. Therefore, multi-modal assessment should improve the power to detect statistically significant abnormalities in any cortical region. Progressive improvement in the automated detec-tion of abnormalities will also occur as more modalities are incorporated into the imaging protocols [77].
Other approaches based on multivariate classification have also been proposed to formally integrate multi-modal data in group studies to increase the power to detect disease-related abnormalities [78,79]. Our statisti-cal approach relies on characterizing the normal variabil-ity in data from different imaging modalities, and combining the results from a series of statistical tests in relation to the covariance structure of the normative data. Each test can be interpreted alone (e.g., reduced cortical thickness and low anisotropy in TBI) and in combination. This approach can be easily adapted to incorporate a larger number of imaging modalities and generalized to patient populations with different etiologies that may produce diffuse alterations in cortical structure and micro-architecture.
Conclusions
The present findings highlight the potential of multimo-dal surface-based morphometry (MSBM) for detecting and characterizing TBI-related diffuse cortical pathology. MSBM is a promising, generalizable method that permits the objective quantification and evaluation of subtle cor-tical abnormalities in TBI as well as other neurological, psychiatric and developmental conditions that produce diffuse alterations in cortical structure.
Competing interests
The authors declare that they have no competing interests.
Authors' contributions
Data analysis: AUT, TJH, XK, DLW; Literature review: AUT, TJH, DLW; Theoretical interpretation: AUT, TJH, DLW; Preparation of drafts of the manuscript: AUT, DLW, TJH. All authors read and approved the final manuscript.
Acknowledgements
Supported by a Department of Veterans Affairs Clinical Science Research and Development (CSR&D) Service Career Development Award (Project ID # 1142715) to Dr. Turken and the Department of Veterans Affairs Rehabilitation Research and Development (RR&D) Service grant B6120R to Dr. Woods. We thank Dr. Deborah Little and Dr. David Menon for their extensive contributions as reviewers for this manuscript. Finally, we thank the patient for his participation. Written consent for publication was obtained from the patient.
References
1. Levine B, Fujiwara E, O'Connor C, Richard N, Kovacevic N, Mandic M, Restagno A, Easdon C, Robertson IH, Graham SJ, et al.: In vivo characterization of traumatic brain injury neuropathology with structural and functional neuroimaging. J Neurotrauma
2006, 23(10):1396-1411.
2. Bigler ED: Quantitative magnetic resonance imaging in trau-matic brain injury. J Head Trauma Rehabil 2001, 16(2):117-134. 3. Azouvi P: Neuroimaging correlates of cognitive and functional
outcome after traumatic brain injury. Curr Opin Neurol 2000, 13(6):665-669.
4. Meythaler JM, Peduzzi JD, Eleftheriou E, Novack TA: Current con-cepts: diffuse axonal injury-associated traumatic brain injury. Arch Phys Med Rehabil 2001, 82(10):1461-1471.
5. Belanger HG, Vanderploeg RD, Curtiss G, Warden DL: Recent neu-roimaging techniques in mild traumatic brain injury. J Neu-ropsychiatry Clin Neurosci 2007, 19(1):5-20.
6. Smith DH, Meaney DF, Shull WH: Diffuse axonal injury in head trauma. J Head Trauma Rehabil 2003, 18(4):307-316.
7. Bigler ED: Neurobiology and neuropathology underlie the neuropsychological deficits associated with traumatic brain injury. Arch Clin Neuropsychol 2003, 18(6):595-621.
8. Merkley TL, Bigler ED, Wilde EA, McCauley SR, Hunter JV, Levin HS: Diffuse changes in cortical thickness in pediatric moderate-to-severe traumatic brain injury. J Neurotrauma 2008, 25(11):1343-1345.
9. Gale SD, Baxter L, Roundy N, Johnson SC: Traumatic brain injury and grey matter concentration: a preliminary voxel based morphometry study. J Neurol Neurosurg Psychiatry 2005, 76(7):984-988.
10. Salmond CH, Chatfield DA, Menon DK, Pickard JD, Sahakian BJ: Cog-nitive sequelae of head injury: involvement of basal forebrain and associated structures. Brain 2005, 128(Pt 1):189-200. 11. Fujiwara E, Schwartz ML, Gao F, Black SE, Levine B: Ventral frontal
cortex functions and quantified MRI in traumatic brain injury. Neuropsychologia 2008, 46(2):461-474.
12. Kim J, Avants B, Patel S, Whyte J, Coslett BH, Pluta J, Detre JA, Gee JC: Structural consequences of diffuse traumatic brain injury: a large deformation tensor-based morphometry study. Neu-roimage 2008, 39(3):1014-1026.
13. Adams H, Mitchell DE, Graham DI, Doyle D: Diffuse brain damage of immediate impact type. Its relationship to 'primary brain-stem damage' in head injury. Brain 1977, 100(3):489-502. 14. Raghupathi R, Graham DI, McIntosh TK: Apoptosis after
trau-matic brain injury. J Neurotrauma 2000, 17(10):927-938. 15. Immonen RJ, Kharatishvili I, Grohn H, Pitkanen A, Grohn OH:
Quan-titative MRI predicts long-term structural and functional outcome after experimental traumatic brain injury. Neuroim-age 2009, 45(1):1-9.
16. Ross DT, Meaney DF, Sabol MK, Smith DH, Gennarelli TA: Distribu-tion of forebrain diffuse axonal injury following inertial closed head injury in miniature swine. Exp Neurol 1994, 126(2):291-299.
17. Bramlett HM, Dietrich WD: Quantitative structural changes in white and gray matter 1 year following traumatic brain injury in rats. Acta Neuropathol 2002, 103(6):607-614.
18. Van Essen DC: A Population-Average, Landmark- and Sur-face-based (PALS) atlas of human cerebral cortex. Neuroim-age 2005, 28(3):635-662.
19. Fischl B, Dale AM: Measuring the thickness of the human cere-bral cortex from magnetic resonance images. Proc Natl Acad Sci USA 2000, 97(20):11050-11055.
20. Fischl B, Sereno MI, Tootell RB, Dale AM: High-resolution inter-subject averaging and a coordinate system for the cortical surface. Human Brain Mapping 1999, 8:272-284.
21. Van Essen DC, Drury HA: Structural and functional analyses of human cerebral cortex using a surface-based atlas. J Neurosci
1997, 17(18):7079-7102.
22. Thompson PM, MacDonald D, Mega MS, Holmes CJ, Evans AC, Toga AW: Detection and mapping of abnormal brain structure with a probabilistic atlas of cortical surfaces. J Comput Assist Tomogr 1997, 21(4):567-581.
23. Wisco JJ, Kuperberg G, Manoach D, Quinn BT, Busa E, Fischl B, Heck-ers S, Sorensen AG: Abnormal cortical folding patterns within Broca's area in schizophrenia: evidence from structural MRI. Schizophr Res 2007, 94(1-3):317-327.
24. Du AT, Schuff N, Kramer JH, Rosen HJ, Gorno-Tempini ML, Rankin K, Miller BL, Weiner MW: Different regional patterns of cortical thinning in Alzheimer's disease and frontotemporal demen-tia. Brain 2007, 130(Pt 4):1159-1166.
25. Shaw P, Lerch J, Greenstein D, Sharp W, Clasen L, Evans A, Giedd J, Castellanos FX, Rapoport J: Longitudinal mapping of cortical thickness and clinical outcome in children and adolescents with attention-deficit/hyperactivity disorder. Arch Gen Psychia-try 2006, 63(5):540-549.
26. Nordahl CW, Dierker D, Mostafavi I, Schumann CM, Rivera SM, Amaral DG, Van Essen DC: Cortical folding abnormalities in autism revealed by surface-based morphometry. J Neurosci
2007, 27(43):11725-11735.
27. Thompson PM, Mega MS, Woods RP, Zoumalan CI, Lindshield CJ, Blanton RE, Moussai J, Holmes CJ, Cummings JL, Toga AW: Cortical change in Alzheimer's disease detected with a disease-spe-cific population-based brain atlas. Cereb Cortex 2001, 11(1):1-16.
28. Desikan RS, Cabral HJ, Hess CP, Dillon WP, Glastonbury CM, Weiner MW, Schmansky NJ, Greve DN, Salat DH, Buckner RL, et al.: Automated MRI measures identify individuals with mild cog-nitive impairment and Alzheimer's disease. Brain 2009, 132(Pt 8):2048-2057.
29. Le Bihan D: Looking into the functional architecture of the brain with diffusion MRI. Nat Rev Neurosci 2003, 4(6):469-480. 30. Basser PJ: Inferring microstructural features and the
physio-logical state of tissues from diffusion-weighted images. NMR Biomed 1995, 8(7-8):333-344.
31. Thakkar KN, Polli FE, Joseph RM, Tuch DS, Hadjikhani N, Barton JJ, Manoach DS: Response monitoring, repetitive behaviour and anterior cingulate abnormalities in autism spectrum disor-ders (ASD). Brain 2008, 131(Pt 9):2464-2478.
32. Manoach DS, Ketwaroo GA, Polli FE, Thakkar KN, Barton JJ, Goff DC, Fischl B, Vangel M, Tuch DS: Reduced microstructural integ-rity of the white matter underlying anterior cingulate cortex is associated with increased saccadic latency in schizophre-nia. Neuroimage 2007, 37(2):599-610.
33. Fjell AM, Westlye LT, Greve DN, Fischl B, Benner T, Kouwe AJ van der, Salat D, Bjornerud A, Due-Tonnessen P, Walhovd KB: The rela-tionship between diffusion tensor imaging and volumetry as measures of white matter properties. Neuroimage 2008, 42(4):1654-1668.
34. Kang XJ, Herron TJ, Turken AU, Woods DL: The Analysis of Peri-Cortical White Matter: A Comparison of FA and MTR. Neu-roimage 2009, 47(Supplement 1):S39-S41.
35. Mac Donald CL, Dikranian K, Bayly P, Holtzman D, Brody D: Diffu-sion tensor imaging reliably detects experimental traumatic axonal injury and indicates approximate time of injury. J Neu-rosci 2007, 27(44):11869-11876.
36. Eriksson SH, Rugg-Gunn FJ, Symms MR, Barker GJ, Duncan JS: Diffu-sion tensor imaging in patients with epilepsy and malforma-tions of cortical development. Brain 2001, 124(Pt 3):617-626. 37. Arfanakis K, Haughton VM, Carew JD, Rogers BP, Dempsey RJ,
Mey-erand ME: Diffusion tensor MR imaging in diffuse axonal injury. AJNR Am J Neuroradiol 2002, 23(5):794-802.
axonal injury in closed head injury. J Comput Assist Tomogr 2003, 27(1):5-11.
39. Inglese M, Makani S, Johnson G, Cohen BA, Silver JA, Gonen O, Grossman RI: Diffuse axonal injury in mild traumatic brain injury: a diffusion tensor imaging study. J Neurosurg 2005, 103(2):298-303.
40. Meaney DF, Ross DT, Winkelstein BA, Brasko J, Goldstein D, Bilston LB, Thibault LE, Gennarelli TA: Modification of the cortical impact model to produce axonal injury in the rat cerebral cortex. J Neurotrauma 1994, 11(5):599-612.
41. Farkas O, Povlishock JT: Cellular and subcellular change evoked by diffuse traumatic brain injury: a complex web of change extending far beyond focal damage. Prog Brain Res 2007, 161:43-59.
42. Lifshitz J, Kelley BJ, Povlishock JT: Perisomatic thalamic axotomy after diffuse traumatic brain injury is associated with atrophy rather than cell death. J Neuropathol Exp Neurol 2007, 66(3):218-229.
43. Herron TJ, Turken AU, Kang XJ, Woods DL: Quantitative auto-mated lesion detection (QALD) after traumatic brain injury. Society for Neuroscience Abstracts 2007, 33:262-268.
44. Delis D, Kaplan E, Kramer J, Ober B: California Verbal Learning Test II. San Antonio, TX: The Psychological Corporation; 2000. 45. World Medical Association: Declaration of Helsinki: ethical
principles for medical research involving human subjects. J Int Bioethique 2004, 15(1):124-129.
46. Mangin JF, Poupon C, Clark C, Le Bihan D, Bloch I: Distortion cor-rection and robust tensor estimation for MR diffusion imag-ing. Med Image Anal 2002, 6(3):191-198.
47. Welk M, Weickert J, Becker F, Schnorr C, Feddern C, Burgeth B: Median and related local filters for tensor-valued images. Sig-nal Processing Magazine 2007, 87:291-308.
48. Koay CG, Chang LC, Carew JD, Pierpaoli C, Basser PJ: A unifying theoretical and algorithmic framework for least squares methods of estimation in diffusion tensor imaging. J Magn Reson 2006, 182(1):115-125.
49. Dale AM, Fischl B, Sereno MI: Cortical surface-based analysis. I. Segmentation and surface reconstruction. Neuroimage 1999, 9(2):179-194.
50. Fischl B, Sereno MI, Dale AM: Cortical surface-based analysis II: Inflation flattening and a surface-based coordinate system. Neuroimage 1999, 9:195-207.
51. Fischl B, Salat DH, Busa E, Albert M, Dieterich M, Haselgrove C, Kouwe A van der, Killiany R, Kennedy D, Klaveness S, et al.: Whole brain segmentation: automated labeling of neuroanatomical structures in the human brain. Neuron 2002, 33(3):341-355. 52. Lerch JP, Evans AC: Cortical thickness analysis examined
through power analysis and a population simulation. Neuroim-age 2005, 24(1):163-173.
53. Chung MK, Robbins SM, Dalton KM, Davidson RJ, Alexander AL, Evans AC: Cortical thickness analysis in autism with heat ker-nel smoothing. Neuroimage 2005, 25(4):1256-1265.
54. Xiong J, Gao J, Lancaster JL, Fox PT: Clustered pixels analysis for functional MRI activation studies of the human brain. Human Brain Mapping 1995, 3(4):287-301.
55. Kruggel F: MRI-based volumetry of head compartments: nor-mative values of healthy adults. Neuroimage 2006, 30(1):1-11. 56. Fisher RA: Statistical Methods for Research Workers.
Edin-burgh: Oliver and Boyd; 1925.
57. Brown MB: A Method for Combining Non-Independent, One-Sided Tests of Significance. Biometrics 1975, 31(4):987-992. 58. Zafonte RD, Ricker J, Yonas H, Wagner A: Frontal contusions
imaging and behavioral consequences. Am J Phys Med Rehabil
2005, 84(3):197-198.
59. Levine B, Kovacevic N, Nica EI, Cheung G, Gao F, Schwartz ML, Black SE: The Toronto traumatic brain injury study: injury severity and quantified MRI. Neurology 2008, 70(10):771-778.
60. Miller EK, Cohen JD: An integrative theory of prefrontal cortex function. Annu Rev Neurosci 2001, 24:167-202.
61. Lezak MD: Neuropsychological Assessment. 3rd edition. New York: Oxford University Press; 1995.
62. Stuss DT: Frontal lobes and attention: processes and net-works, fractionation and integration. J Int Neuropsychol Soc
2006, 12(2):261-271.
63. Oishi K, Zilles K, Amunts K, Faria A, Jiang H, Li X, Akhter K, Hua K, Woods R, Toga AW, et al.: Human brain white matter atlas:
identification and assignment of common anatomical struc-tures in superficial white matter. Neuroimage 2008, 43(3):447-457.
64. Marenco S, Rawlings R, Rohde GK, Barnett AS, Honea RA, Pierpaoli C, Weinberger DR: Regional distribution of measurement error in diffusion tensor imaging. Psychiatry Res 2006, 147(1):69-78.
65. Thakkar KN, Polli FE, Joseph RM, Tuch DS, Hadjikhani N, Barton JJ, Manoach DS: Response monitoring, repetitive behaviour and anterior cingulate abnormalities in ASD. Brain 2008. 66. Brett M, Leff AP, Rorden C, Ashburner J: Spatial normalization of
brain images with focal lesions using cost function masking. Neuroimage 2001, 14(2):486-500.
67. Crinion J, Ashburner J, Leff A, Brett M, Price C, Friston K: Spatial normalization of lesioned brains: performance evaluation and impact on fMRI analyses. Neuroimage 2007, 37(3):866-875. 68. Nachev P, Coulthard E, Jager HR, Kennard C, Husain M: Enantio-morphic normalization of focally lesioned brains. Neuroimage
2008, 39(3):1215-1226.
69. Sidaros A, Skimminge A, Liptrot MG, Sidaros K, Engberg AW, Hern-ing M, Paulson OB, Jernigan TL, Rostrup E: Long-term global and regional brain volume changes following severe traumatic brain injury: a longitudinal study with clinical correlates. Neu-roimage 2009, 44(1):1-8.
70. Blatter DD, Bigler ED, Gale SD, Johnson SC, Anderson CV, Burnett BM, Ryser D, Macnamara SE, Bailey BJ: MR-based brain and cere-brospinal fluid measurement after traumatic brain injury: correlation with neuropsychological outcome. AJNR Am J Neu-roradiol 1997, 18(1):1-10.
71. Trivedi MA, Ward MA, Hess TM, Gale SD, Dempsey RJ, Rowley HA, Johnson SC: Longitudinal changes in global brain volume between 79 and 409 days after traumatic brain injury: rela-tionship with duration of coma. J Neurotrauma 2007, 24(5):766-771.
72. Kraus MF, Susmaras T, Caughlin BP, Walker CJ, Sweeney JA, Little DM: White matter integrity and cognition in chronic trau-matic brain injury: a diffusion tensor imaging study. Brain
2007, 130(Pt 10):2508-2519.
73. Salmond CH, Menon DK, Chatfield DA, Williams GB, Pena A, Sahak-ian BJ, Pickard JD: Diffusion tensor imaging in chronic head injury survivors: correlations with learning and memory indi-ces. Neuroimage 2006, 29(1):117-124.
74. Sidaros A, Engberg AW, Sidaros K, Liptrot MG, Herning M, Petersen P, Paulson OB, Jernigan TL, Rostrup E: Diffusion tensor imaging during recovery from severe traumatic brain injury and rela-tion to clinical outcome: a longitudinal study. Brain 2008, 131(Pt 2):559-572.
75. Benson RR, Meda SA, Vasudevan S, Kou Z, Govindarajan KA, Hanks RA, Millis SR, Makki M, Latif Z, Coplin W, et al.: Global white mat-ter analysis of diffusion tensor images is predictive of injury severity in traumatic brain injury. J Neurotrauma 2007, 24(3):446-459.
76. Chappell MH, Ulug AM, Zhang L, Heitger MH, Jordan BD, Zimmer-man RD, Watts R: Distribution of microstructural damage in the brains of professional boxers: a diffusion MRI study. J Magn Reson Imaging 2006, 24(3):537-542.
77. Admiraal-Behloul F, Heuvel DM van den, Olofsen H, van Osch MJ, Grond J van der, van Buchem MA, Reiber JH: Fully automatic seg-mentation of white matter hyperintensities in MR images of the elderly. Neuroimage 2005, 28(3):607-617.
78. Anbeek P, Vincken KL, van Osch MJ, Bisschops RH, Grond J van der: Automatic segmentation of different-sized white matter lesions by voxel probability estimation. Med Image Anal 2004, 8(3):205-215.
79. Chappell MH, Brown JA, Dalrymple-Alford JC, Ulug AM, Watts R: Multivariate analysis of diffusion tensor imaging data improves the detection of microstructural damage in young professional boxers. Magn Reson Imaging 2008, 26(10):1398-1405.
Pre-publication history
The pre-publication history for this paper can be accessed here: